2020 Continental Ave · Tallahassee, FL
Flood risk 1/10 · Minimal
- FEMA flood zone
- X (unshaded)
- Chance of flooding over 30 yrs
- 0.0%
- Est. flood insurance / yr
- $507 – $1,088
Fire risk 1/10 · Minimal
- Est. fire insurance / yr
- $947 – $1,759
Heat risk 8/10 · Major
- Hot days now (above 108°F)
- 7 days/yr
- Hot days in 30 yrs
- 19 days/yr
Wind risk 9/10 · Severe
- Chance of severe wind over 30 yrs
- 99.0%
Air-quality risk 5/10 · Moderate
- Unhealthy air days now
- 7 days/yr
- Unhealthy air days in 30 yrs
- 7 days/yr
Risk factors via First Street. Map © Google.
Why this score? — see what drove the B grade
The composite is a weighted blend of 9 inputs, each scored 0–100. Each bar is that input's sub-score; the figure is the points it added to the 100-point composite (weight × sub-score).
- Cash flow +30.0/30.0
- 1% rule +10.0/10.0
- DSCR +10.0/10.0
- ARV discount +7.5/15.0
- Schools +4.3/10.0
- Livability +4.3/5.0
- Rent growth +3.7/5.0
- Condition / age +2.0/5.0
- Appreciation +0.0/10.0
$62,500
🖨 Deal sheet 📄 Offer letter ✓ Due diligence
Listing remarks MLS
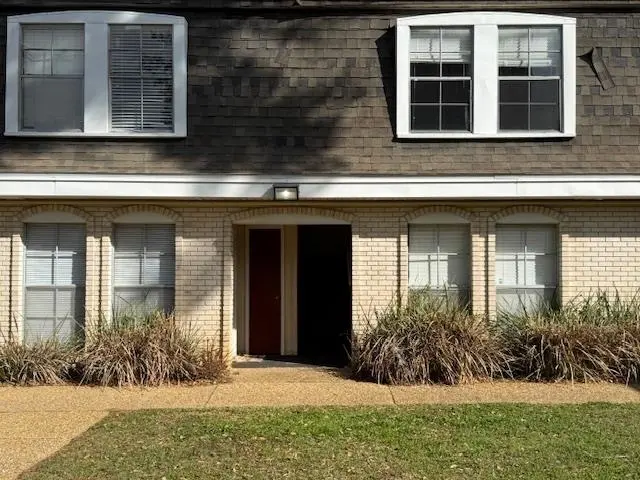
Great location on the FSU bus route. Move In Ready! upstairs unit - so you will not hear anyone walking above you. Sold FURNISHED - All appliances convey. kitchen has tile back splash, stainless steel appliances. Bedroom overlooks the swimming pool area. all appliances convey including Washer and Dryer! Excellent investment Opportunity!
Key facts
- View of pool
- Close to clubhouse
- $29 HOA
Tags
Property features AI
Finance
- Other: Offered for sale
- HOA & community: Association fee: $350 (includes pool access); Community pool
Exterior
- Parking: Parking space(s)
- Home design: Brick construction
- Construction: Brick construction
- Exterior features: Paved road access; Private pool (concrete); community pool access
Interior
- Kitchen: Oven; Range; Refrigerator; Dishwasher
- Bedrooms: Bedroom (13x12); Additional bedroom/rooms: Living Room (12x17), Family Room, Dining Room (9x11), Room (12x12)
- Flooring: Carpet
- Bathrooms: 1 full bathroom; 1 half bathroom
- Heating & cooling: Heat pump heating; Central air conditioning
- Interior features: Carpet flooring; No additional interior features listed
Neighborhood map
What this means for you Summary
Snapshot
- This is a 2-bed/1.5-bath condo listed at $62k. Condition is rated fair.
Deal economics
- At list price, monthly cash flow is $593 ($7k/yr) — positive.
- The deal already cash-flows at list — no discount required.
- Meets the 1% rule at list price ($1k rent vs $62k).
- Recommended offer: $59k (6.0% below list) — sets the bar for market timing.
- Cap rate 17.7% vs local median 4.2% in Tallahassee — top-decile yield for the area; either an underpriced asset or a hidden risk that comps aren't pricing in. Stress-test before assuming the spread holds.
Location & tenants
- Location reads 86/100 on livability (#19 in FL, #429 nationally) — a professional / high-income tenant draw. Strengths: amenities A+, commute A+, health & safety A+; Watch: employment D.
- Leon (urban): math 48% / reading 53% proficiency, ranked #33 of 73 in FL (top 45%) — acceptable for families but not a draw, mixed tenant base, ~2y average lease.
- Market conditions: Rents rising fast (+4.7%/yr); 142 active listings in the ZIP; 40 comparable units currently listed for rent nearby; rentals at typical pace (median 21d on market — plan ~3-4 weeks tenant-placement turnaround); lower-income renter base — watch delinquency; 1,765 units permitted in Leon County in 2024 (975 in 5+ unit buildings).
- At $1,334/mo this rent would consume 49% of the median local household income ($32k/yr) (locally 6995% of renters already pay >50% of income on rent) — very limited rent-growth headroom before tenants either downsize or default.
Forward outlook
- Local home prices are declining (-3.0%/yr); year-one equity from $432 of loan paydown is wiped out by about $2k of value loss. Plan a longer hold.
- Leon County population projected at +23% by 2050 — long-run rental-demand tailwind backs the buy-and-hold thesis.
- At projected returns (-3.0% appreciation + 4.7% rent growth), your $18k cash investment doubles in ~3 years — after that, you're playing with house money.
Negotiation context
- It's been on market 67 days — a 6% lower offer ($59k) is reasonable based on typical stale-listing flexibility.
- 32 sale attempts since 21y ago with the ask held roughly flat each time — persistent listings suggest the price (not the market) is what's stuck; bring a comps-based counter.
- Current owner paid $38k; list at $62k implies a 67% gain — meaningful room to come down on a strong offer.
Risks & watch-outs
- Climate carrying-cost: severe wind risk, 99% chance of damaging wind over 30y; extreme-heat days projected 7→19/yr by 2055 (HVAC capex compounding) — expect insurance premiums to compound above CPI over the hold.
Questions for the listing agent
- It's been on market 67 days. Have you received any prior offers? Is the seller open to a 6% concession, seller financing, or rate buy-down credit?
- Have any recent inspections been done? Can we get a copy of the seller's disclosures and any deferred-maintenance estimates?
- Built in 1967 — when were the roof, HVAC, electrical panel, plumbing, and water heater last replaced?
- What does the HOA fee cover, when was the last increase, and are there any pending special assessments or reserve-fund shortfalls?
- Any open or pending special assessments — roof, HVAC, plumbing, elevator, façade? What's the per-unit balance and payoff schedule, and is the seller paying it off at close or rolling it to the buyer?
- Why hasn't it sold? Are there any deal-killer items the seller is aware of (foundation, flood, title, zoning, code violations)?
- Is there a deadline driving the sale (1031 exchange, divorce, estate, relocation)? That informs how much negotiation room exists.
- Schools are B-rated — typically a magnet for longer-tenancy family renters. What's the average tenant stay here, and is there a school-zone premium baked into asking?
- What's the average days-on-market for RENTAL listings here right now (not sales)? A rising rental-DOM trend means longer vacancies and softer asking-rent achievability than the comps imply.
- What's the recent tenant-quality profile in this submarket — average credit score on applications, eviction rate, late-payment / NSF rate, and stable-employment percentage? A property-management company in the area should have these aggregated.
- How much new apartment / multifamily construction is in the pipeline within 1–3 miles? Heavy new supply (>2% of stock underway) typically softens rents 12–24 months out; light construction supports rent growth.
Investment metrics
- 1% rule
- 2.13% ✓
- Cap rate
- 17.68%
- Cash-on-cash
- 40.67%
- DSCR
- 2.81
- GRM
- 3.9
CMA / ARV
No comps found within radius.
Projected returns pro-forma
-3.0% appreciation · 4.69% rent growth · sell at horizon
- IRR
- 39.1%
- Equity multiple
- 2.71×
- Total profit
- $29,997
- Equity at exit
- $9,319
- IRR
- 46.4%
- Equity multiple
- 5.84×
- Total profit
- $84,721
- Equity at exit
- $5,404
Cash invested: $17,500 (down + closing). Projections, not guarantees.
Landlord ↔ Tenant lean methodology
- Overall (STATE)
- 87 Strongly Landlord-Friendly
- State Florida
- 87 Strongly Landlord-Friendly · R+3
- County
- — inherits STATE
- City
- — inherits STATE
ZIP-level market 32304
- Home prices YoY
- -21.2%
- Rents YoY
- 4.7%
- Active inventory
- 142
- Price-to-rent
- 3.9×
Monthly cashflow live
- Estimated rent
- $1,334 high interval (Pro) →
- Mortgage (P&I)
- −$328
- Tax est. 1.5%
- −$78 /mo · $938/yr
- Insurance
- −$26
- HOA
- −$29
- Vacancy / Maint / Mgmt
- −$280
- Net cashflow
- $593
Break-even live
UW: 25.0% down · 7.5% · 30yr · 1.5% tax · 5.0% vac · 8.0% maint · 8.0% mgmt
Financing live
Cash to close
- Down payment
- $15,625
- Closing costs
- $1,875
- Reserves months
- —
- Total cash needed
- —
Loan-product check · same deal, 3 products live
Conventional
25% down · 7.5% · 30yr
- Down + closing
- —
- Monthly P&I
- —
- Monthly cashflow
- —
- DSCR
- —
- Eligible?
- —
Personal DTI + credit; lowest rate.
DSCR
20% down · 8.5% · 30yr
- Down + closing
- —
- Monthly P&I
- —
- Monthly cashflow
- —
- DSCR
- —
- Eligible?
- —
No personal income docs; deal must DSCR.
Hard money
10% down · 12.0% · 12mo
- Down + closing
- —
- Monthly P&I
- —
- Monthly cashflow
- —
- DSCR
- —
- Eligible?
- —
Short-term bridge; refi at stabilization.
Rent comps 40 comps
| Address | Beds | Baths | Sqft | Rent | $/sqft | DOM | Units | Dist |
|---|---|---|---|---|---|---|---|---|
| 2020 Continental Ave Tallahassee, FL | 1.0–2.0 | 1.0–1.5 | 850 | $1,300 | $1.53 | 21d | 3 | 0.02mi |
| 1111 High Rd Tallahassee, FL | 2.0–3.0 | 2.0 | 1000 | $1,409 | $1.41 | 13d | 11 | 0.08mi |
| 1108 Greentree Ct Tallahassee, FL | 2.0 | 2.0 | 888 | $1,275 | $1.44 | 21d | 1 | 0.13mi |
| 2060 Continental Ave Tallahassee, FL | 1.0–3.0 | 1.0–2.5 | 1121 | $1,052 | $0.94 | 13d | 26 | 0.17mi |
| 832 Arkansas St Tallahassee, FL | 3.0 | 1.0 | 1296 | $1,400 | $1.08 | 21d | 1 | 0.24mi |
| 1303 Ocala Rd Tallahassee, FL | 1.0–4.0 | 1.0–2.0 | 1121 | $1,320 | $1.18 | 13d | 48 | 0.24mi |
| 1360 Ocala Rd Tallahassee, FL | 2.0 | 1.0 | 800 | $1,000 | $1.25 | 21d | 1 | 0.34mi |
| 1001 Ocala Rd Tallahassee, FL | 4.0 | 1.0–2.0 | 899 | $584 | $0.65 | 21d | 6 | 0.35mi |
| 1380 Ocala Rd Tallahassee, FL | 1.0 | 1.0 | 700 | $975 | $1.39 | 21d | 1 | 0.43mi |
| 1107 Basin St Unit A Tallahassee, FL | 3.0 | 2.0 | 1215 | $2,400 | $1.98 | 21d | 1 | 0.46mi |
| 1525 W Tennessee St #307 Tallahassee, FL | 2.0 | 1.0 | 1200 | $1,600 | $1.33 | 21d | 1 | 0.64mi |
| 1325 W Tharpe St Tallahassee, FL | 1.0–3.0 | 1.0–4.0 | 937 | $1,511 | $1.61 | 13d | 21 | 0.65mi |
| 1329 Nylic St #1 Tallahassee, FL | 3.0 | 3.0 | 1275 | $1,800 | $1.41 | 21d | 1 | 0.69mi |
| 1560 San Luis Rd Tallahassee, FL | 3.0 | 3.5 | 1500 | $774 | $0.52 | 21d | 22 | 0.75mi |
| 2182 Timberwood Cir S Unit 1 Tallahassee, FL | 3.0 | 2.5 | 1280 | $1,599 | $1.25 | 21d | 1 | 0.76mi |
| 322 Conradi St Tallahassee, FL | 3.0 | 2.0 | 1100 | $1,950 | $1.77 | 21d | 4 | 0.80mi |
| 2353 W Mission Rd Tallahassee, FL | 2.0–3.0 | 2.0–2.5 | 1012 | $1,250 | $1.23 | 13d | 11 | 0.82mi |
| 2350 Horne Ave Unit 2 Tallahassee, FL | 2.0 | 2.0 | 800 | $995 | $1.24 | 21d | 1 | 0.84mi |
| 916 N Woodward Ave #1 Tallahassee, FL | 2.0 | 1.0 | 794 | $1,000 | $1.26 | 13d | 1 | 0.96mi |
| 2259 Parrot Ln Tallahassee, FL | 2.0 | 2.0 | 992 | $1,275 | $1.29 | 21d | 1 | 1.01mi |
| 2327 Parrot Ln Tallahassee, FL | 3.0 | 2.0 | 1088 | $1,300 | $1.19 | 21d | 1 | 1.05mi |
| 205 White Dr Tallahassee, FL | 1.0–4.0 | 1.0–4.0 | 1155 | $637 | $0.55 | 21d | 1 | 1.11mi |
| 220 Atkinson Dr Unit D Tallahassee, FL | 2.0 | 1.0 | 928 | $1,100 | $1.19 | 21d | 1 | 1.17mi |
| 2202 W Pensacola St Tallahassee, FL | 1.0–3.0 | 1.0 | 950 | $1,224 | $1.29 | 21d | 3 | 1.17mi |
| 2301 Old Bainbridge Rd Tallahassee, FL | 2.0–3.0 | 1.0–2.0 | 1084 | $1,200 | $1.11 | 21d | 1 | 1.19mi |
| 2616 Mission Rd Tallahassee, FL | 1.0–2.0 | 1.0 | 750 | $1,195 | $1.59 | 13d | 12 | 1.20mi |
| 2614 W Tennessee St Tallahassee, FL | 1.0–4.0 | 1.0–4.0 | 1270 | $1,159 | $0.91 | 21d | 14 | 1.22mi |
| 1854 Belle Vue Way Tallahassee, FL | 2.0–4.0 | 1.0–2.0 | 1100 | $1,235 | $1.12 | 21d | 1 | 1.23mi |
| 1612 Overstreet St Tallahassee, FL | 3.0 | 3.0 | 1500 | $3,300 | $2.20 | 21d | 1 | 1.23mi |
| 2350 Wanda Way Tallahassee, FL | 2.0–3.0 | 1.0 | 861 | $1,200 | $1.39 | 21d | 1 | 1.24mi |
| 2309 Old Bainbridge Rd Tallahassee, FL | 1.0–2.0 | 1.0–2.0 | 798 | $1,420 | $1.78 | 13d | 10 | 1.25mi |
| 301 S Lipona Rd #24 Tallahassee, FL | 2.0 | 1.5 | 896 | $1,350 | $1.51 | 21d | 1 | 1.26mi |
| 1818 Sylvan Ct Unit D Tallahassee, FL | 2.0 | 1.0 | 850 | $1,200 | $1.41 | 13d | 1 | 1.27mi |
| 1571 Stone Rd Unit 5B Tallahassee, FL | 2.0 | 2.5 | 1216 | $1,795 | $1.48 | 21d | 1 | 1.31mi |
| 316 Ausley Rd Tallahassee, FL | 1.0–4.0 | 1.0–2.0 | 750 | $798 | $1.06 | 13d | 8 | 1.33mi |
| 2401 Atlas Rd Unit B Tallahassee, FL | 2.0 | 1.0 | 900 | $1,100 | $1.22 | 21d | 1 | 1.33mi |
| 1801 Lenora Dr Tallahassee, FL | 3.0 | 1.0 | 1150 | $1,800 | $1.57 | 21d | 1 | 1.36mi |
| 1447 Stone Rd Tallahassee, FL | 1.0–3.0 | 1.0–2.0 | 890 | $1,360 | $1.53 | 21d | 1 | 1.38mi |
| 317 Mabry St Tallahassee, FL | 2.0 | 1.0 | 808 | $898 | $1.11 | 21d | 1 | 1.38mi |
| 2412 Atlas Rd Tallahassee, FL | 3.0 | 1.5 | 1081 | $1,200 | $1.11 | 21d | 1 | 1.39mi |
HOA detail condo
- Monthly dues
- $29 · $348/yr
- Likely covers
- pool
- Assessments
- None detected in remarks — confirm with the listing agent.
Listing history 50 events
-
2026-06-17days on market $62,500 Active 67 DOM
-
2026-06-16days on market $62,500 Active 66 DOM
-
2026-06-15days on market $62,500 Active 65 DOM
-
2026-06-14days on market $62,500 Active 63 DOM
-
2026-06-10days on market $62,500 Active 60 DOM
-
2026-06-09days on market $62,500 Active 59 DOM
-
2026-06-08days on market $62,500 Active 58 DOM
-
2026-06-07days on market $62,500 Active 57 DOM
-
2026-06-05days on market $62,500 Active 54 DOM
-
2026-06-03days on market $62,500 Active 53 DOM
-
2026-06-02days on market $62,500 Active 52 DOM
-
2026-06-01days on market $62,500 Active 51 DOM
-
2026-05-31days on market $62,500 Active 50 DOM
-
2026-05-30days on market $62,500 Active 49 DOM
-
2026-04-10$62,500 Active
-
2026-02-26historical $1,325
-
2026-02-24$1,325
-
2026-02-22historical $1,325
-
2026-02-20historical $1,325
-
2026-02-16$1,325
-
2026-02-12historical $1,325
-
2026-02-02$1,325
-
2026-01-29historical $1,325
-
2026-01-19$1,325
-
2026-01-07price $1,325
-
2025-11-26price $1,350
-
2025-11-13price $1,375
-
2025-11-05price $1,425
-
2025-11-04price $1,400
-
2025-10-23historical $700
-
2025-09-27$700
-
2025-09-19price $1,475
-
2025-08-22price $1,525
-
2025-08-16$1,500
-
2025-05-15historical $1,200
-
2025-01-15$1,200
-
2024-12-12historical $1,395
-
2024-10-30$1,395
-
2024-10-23historical $1,195
-
2024-10-23historical $1,195
-
2024-10-23$1,195
-
2024-10-23$1,195
-
2024-10-16historical $1,195
-
2024-10-16historical $1,195
-
2024-10-12$1,195
-
2024-10-12$1,195
-
2024-09-29historical $1,195
-
2024-09-29historical $1,195
-
2024-09-29$1,195
-
2024-09-29$1,195
ⓘ Source: listings_history table (triggers on properties + properties_extension) + one-shot
backfill from property_details.listing_events for pre-trigger history.
Climate risk First Street
- Flood 1/10 Low FEMA zone X (unshaded) · 0% chance over 30 yrs
- Wildfire 1/10 Low
- Heat 8/10 Severe 7 d/yr ≥108°F today · 19 d/yr by 30 yrs out
- Wind 9/10 Extreme 99% chance of damaging wind over 30 yrs
- Air quality 5/10 Major 7 unhealthy d/yr today · 7 by 30 yrs out
Nearby sold comps map
Loading sold comps map…
Walkable amenities ~0.75 mi
Loading nearby amenities…
Taxation est. · year 1
- Rental income
- $16,012
- − Mortgage interest
- −$3,501
- − Property taxes
- −$938
- − Insurance
- −$312
- − Repairs & maintenance
- −$1,281
- − Management
- −$1,281
- − HOA
- −$348
- − Depreciation
- −$1,818
- Taxable income
- $6,533
- Est. tax owed @ 24.0%
- −$1,568
- After-tax cash flow
- $5,550/yr
For passive investors: Depreciation is non-cash, so a rental often shows a tax loss while cash-flowing — sheltering income. Rental losses are passive: they offset passive income freely, and up to $25,000/yr can offset ordinary (W-2) income if you actively participate and your MAGI is under $100k (phasing out to $0 by $150k); unused losses carry forward. On sale, claimed depreciation is recaptured at up to 25%, and gains may owe capital-gains tax (a 1031 exchange can defer both). Figures are a year-1 estimate at your 24.0% rate — not tax advice; consult a CPA.
Condition & rehab AI · 12 photos
This property requires moderate renovations to improve its condition and increase its value. Key areas for improvement include the kitchen, bathrooms, flooring, and landscaping.
Repairs flagged
- Major Kitchen flooring — Carpeted floor in poor condition.
- Major Kitchen cabinets — Outdated and in poor condition.
- Major Kitchen appliances — Outdated and in poor condition.
- Major Bathroom fixtures — Older and in poor condition.
- Major Bathroom paint — Peeling paint and outdated decor.
- Major Living area flooring — Carpeted floor in poor condition.
- Major Living area walls — Peeling paint and outdated decor.
- Major Landscaping — Overgrown and basic landscaping
Value-add opportunities
- Both New kitchen flooring — New flooring will improve both resale and rental value.
- Both New kitchen cabinets and appliances — New cabinets and appliances will improve both resale and rental value.
- Both New bathroom fixtures and paint — New fixtures and paint will improve both resale and rental value.
- Both Landscaping — Landscaping will improve curb appeal and rental value.
- Both Paint interior walls — Painting will improve the interior and rental value.
- Both Replace carpeted flooring — Replacing carpeted flooring will improve the interior and rental value.
Renovation cost estimate screening
| Repair item | Severity | Est. cost |
|---|---|---|
| Kitchen flooring · Carpeted floor in poor condition. | Major | $15,000–50,000 |
| Kitchen cabinets · Outdated and in poor condition. | Major | $15,000–50,000 |
| Kitchen appliances · Outdated and in poor condition. | Major | $15,000–50,000 |
| Bathroom fixtures · Older and in poor condition. | Major | $15,000–50,000 |
| Bathroom paint · Peeling paint and outdated decor. | Major | $15,000–50,000 |
| Living area flooring · Carpeted floor in poor condition. | Major | $15,000–50,000 |
| Living area walls · Peeling paint and outdated decor. | Major | $15,000–50,000 |
| Landscaping · Overgrown and basic landscaping | Major | $15,000–50,000 |
| Total estimated repair cost · 8 items | $120,000–400,000 |
Value-add ROI direction
- Both New kitchen flooring — New flooring will improve both resale and rental value. ↑
- Both New kitchen cabinets and appliances — New cabinets and appliances will improve both resale and rental value. ↑
- Both New bathroom fixtures and paint — New fixtures and paint will improve both resale and rental value. ↑
- Both Landscaping — Landscaping will improve curb appeal and rental value. ↑
- Both Paint interior walls — Painting will improve the interior and rental value. ↑
- Both Replace carpeted flooring — Replacing carpeted flooring will improve the interior and rental value. ↑
ⓘ Cost ranges are severity-bucket heuristics (US national rule-of-thumb). Get contractor quotes + a written scope before underwriting a rehab budget.
Schools (NCES district)
- District
- Leon
- NCES district ID
- 1201110
- Math proficiency
- 48% ▼ -13.00%
- Reading proficiency
- 53% ▼ -5.00%
- Median HH income
- $46,339
- Composite
- 42.84/100
- National rank
- #3131
- State rank
- #33 of 73 in FL
Livability — Tallahassee
- Score
- 86/100
- State rank
- #19
- US rank
- #429
Category grades
Schools grade is shown separately in the Schools card above.
Census & demographics
- Census place
- Tallahassee, FL
- County
- Leon County · 294,472 people
- City population
- 294,472
- Metro
- Tallahassee, FL
- Population (ZIP)
- 51,673
- Household income
- $32,348
- Rent vs Own
- Severe rent burden
- 6995.0
Population outlook (Leon County) Hauer SSP2
- Today (2025)
- 315,507 people
- By 2030
- 330,677 · +4.8%
- By 2040
- 358,465 · +13.6%
- By 2050
- 386,804 · +22.6%
- By 2075
- 465,480 · +47.5%
- By 2100
- 519,959 · +64.8%
Race, ethnicity, and origin ACS 2023
- Neighborhood character
- Diverse neighborhood (Simpson 0.65)
- Race & ethnicity
- White 45% Black 36% Hispanic / Latino 10% Two or more races 7% Asian 4%
- Hispanic origin (detail)
- Mexican 2% Puerto Rican 2% Cuban 2%
- Common ancestry
- Romanian 2% Lithuanian 1% Italian 1%
- Foreign-born
- 8% · Canada, China
- Languages at home
- 86% English-only · Spanish 7% Other Indo-European 2% French/Haitian/Cajun 1%
Political lean MEDSL · Leon
- 2024 margin
- Strong D (+21.8) · D 60.3% · R 38.5% · Other 1.2%
- 2008→2024 swing
- -2.5pp toward R · 2008: 24.3pp · 2024: 21.8pp
- All cycles
- 2024: D+21.8 2020: D+28.3 2016: D+25.1 2012: D+23.6 2008: D+24.3
Not yet ingested
- Civics
- —
Market trends
- HPI YoY
- ▼ -72.04%
- Current HPI
- 267.8426
- Rent YoY
- ▲ 4.69%
- Metro
- Tallahassee, FL
- State GDP YoY
- ▲ 3.28%
- F500 in state
- 36
Industry mix (Fortune 500 HQ in FL)
| Industry | F500 HQs | Revenue |
|---|---|---|
| Industrial Technology | 2 | $29B |
|
||
| Insurance | 2 | $17B |
|
||
| Retail | 1 | $60B |
|
||
| Technology Distribution | 1 | $58B |
|
||
| Homebuilding | 1 | $35B |
|
||
| Technology Manufacturing | 1 | $35B |
|
||
Price history
-23.7% since first listed70 events — show timeline
- 2026-04-10 Listed $62,500 CATRS
- 2026-02-26 Rental Removed $1,325 APPFOLIO
- 2026-02-24 Listed for Rent $1,325 APPFOLIO
- 2026-02-22 Rental Removed $1,325 APPFOLIO
- 2026-02-20 Rental Removed $1,325 APPFOLIO
- 2026-02-16 Listed for Rent $1,325 APPFOLIO
- 2026-02-12 Rental Removed $1,325 APPFOLIO
- 2026-02-02 Listed for Rent $1,325 APPFOLIO
- 2026-01-29 Rental Removed $1,325 APPFOLIO
- 2026-01-19 Listed for Rent $1,325 APPFOLIO
- 2026-01-07 Price Changed $1,325 APPFOLIO
- 2025-11-26 Price Changed $1,350 APPFOLIO
- 2025-11-13 Price Changed $1,375 APPFOLIO
- 2025-11-05 Price Changed $1,425 APPFOLIO
- 2025-11-04 Price Changed $1,400 APPFOLIO
- 2025-10-23 Rental Removed $700 TURBOTENANT
- 2025-09-27 Listed for Rent $700 TURBOTENANT
- 2025-09-19 Price Changed $1,475 APPFOLIO
- 2025-08-22 Price Changed $1,525 APPFOLIO
- 2025-08-16 Listed for Rent $1,500 APPFOLIO
- 2025-05-15 Rental Removed $1,200 APPFOLIO
- 2025-01-15 Listed for Rent $1,200 APPFOLIO
- 2024-12-12 Rental Removed $1,395 APPFOLIO
- 2024-10-30 Listed for Rent $1,395 APPFOLIO
- 2024-10-23 Rental Removed $1,195 APPFOLIO
- 2024-10-23 Rental Removed $1,195 APPFOLIO
- 2024-10-23 Listed for Rent $1,195 APPFOLIO
- 2024-10-23 Listed for Rent $1,195 APPFOLIO
- 2024-10-16 Rental Removed $1,195 APPFOLIO
- 2024-10-16 Rental Removed $1,195 APPFOLIO
- 2024-10-12 Listed for Rent $1,195 APPFOLIO
- 2024-10-12 Listed for Rent $1,195 APPFOLIO
- 2024-09-29 Rental Removed $1,195 APPFOLIO
- 2024-09-29 Rental Removed $1,195 APPFOLIO
- 2024-09-29 Listed for Rent $1,195 APPFOLIO
- 2024-09-29 Listed for Rent $1,195 APPFOLIO
- 2024-09-18 Rental Removed $1,195 APPFOLIO
- 2024-09-18 Rental Removed $1,195 APPFOLIO
- 2024-09-17 Listed for Rent $1,195 APPFOLIO
- 2024-09-17 Listed for Rent $1,195 APPFOLIO
- 2024-09-07 Rental Removed $1,195 APPFOLIO
- 2024-09-07 Rental Removed $1,195 APPFOLIO
- 2024-09-07 Listed for Rent $1,195 APPFOLIO
- 2024-09-07 Listed for Rent $1,195 APPFOLIO
- 2024-08-31 Rental Removed $1,195 APPFOLIO
- 2024-08-31 Rental Removed $1,195 APPFOLIO
- 2024-08-28 Listed for Rent $1,195 APPFOLIO
- 2024-08-28 Listed for Rent $1,195 APPFOLIO
- 2024-08-14 Rental Removed $1,195 APPFOLIO
- 2024-08-14 Rental Removed $1,195 APPFOLIO
- 2024-08-14 Listed for Rent $1,195 APPFOLIO
- 2024-08-09 Listed for Rent $1,195 APPFOLIO
- 2024-07-24 Rental Removed $1,195 APPFOLIO
- 2024-07-22 Listed for Rent $1,195 APPFOLIO
- 2024-06-26 Rental Removed $1,350 APPFOLIO
- 2024-06-15 Listed for Rent $1,350 APPFOLIO
- 2024-06-05 Rental Removed $1,350 APPFOLIO
- 2024-05-24 Listed for Rent $1,350 APPFOLIO
- 2023-12-14 Rental Removed $950 APPFOLIO
- 2023-12-07 Listed for Rent $950 APPFOLIO
- 2019-09-20 Sold (MLS) $37,500 CATRS
- 2019-07-31 Listed $42,500 CATRS
- 2007-03-01 Listing Removed — CATRS
- 2007-02-08 Listed $365,000 CATRS
- 2006-10-06 Sold (MLS) $88,900 CATRS
- 2006-06-30 Sold (MLS) $77,400 CATRS
- 2006-06-16 Sold (MLS) $81,900 CATRS
- 2006-05-01 Listed $77,400 CATRS
- 2006-01-01 Listed $88,900 CATRS
- 2005-10-15 Listed $81,900 CATRS
Cash-flow waterfall
monthlySold comps — $/sqft
last 12 mo · ≤1 miLoading sold comps…