45 Trafford Rd · Chenango Bridge, NY
Flood risk 5/10 · Moderate
- FEMA flood zone
- X
- Chance of flooding over 30 yrs
- 0.26%
- Est. flood insurance / yr
- $473 – $860
Fire risk 3/10 · Minor
- Est. fire insurance / yr
- $691 – $1,283
Heat risk 3/10 · Minor
- Hot days now (above 92°F)
- 7 days/yr
- Hot days in 30 yrs
- 16 days/yr
Wind risk 2/10 · Minimal
- Chance of severe wind over 30 yrs
- 2.0%
Air-quality risk 2/10 · Minimal
- Unhealthy air days now
- 0 days/yr
- Unhealthy air days in 30 yrs
- 1 days/yr
Risk factors via First Street. Map © Google.
Why this score? — see what drove the B+ grade
The composite is a weighted blend of 9 inputs, each scored 0–100. Each bar is that input's sub-score; the figure is the points it added to the 100-point composite (weight × sub-score).
- Cash flow +30.0/30.0
- ARV discount +15.0/15.0
- 1% rule +10.0/10.0
- DSCR +10.0/10.0
- Schools +4.5/10.0
- Livability +3.5/5.0
- Rent growth +2.5/5.0
- Condition / age +2.5/5.0
- Appreciation +0.0/10.0
$72,000
🖨 Deal sheet (PDF) 📄 Offer letter ✓ Due diligence
Listing remarks MLS
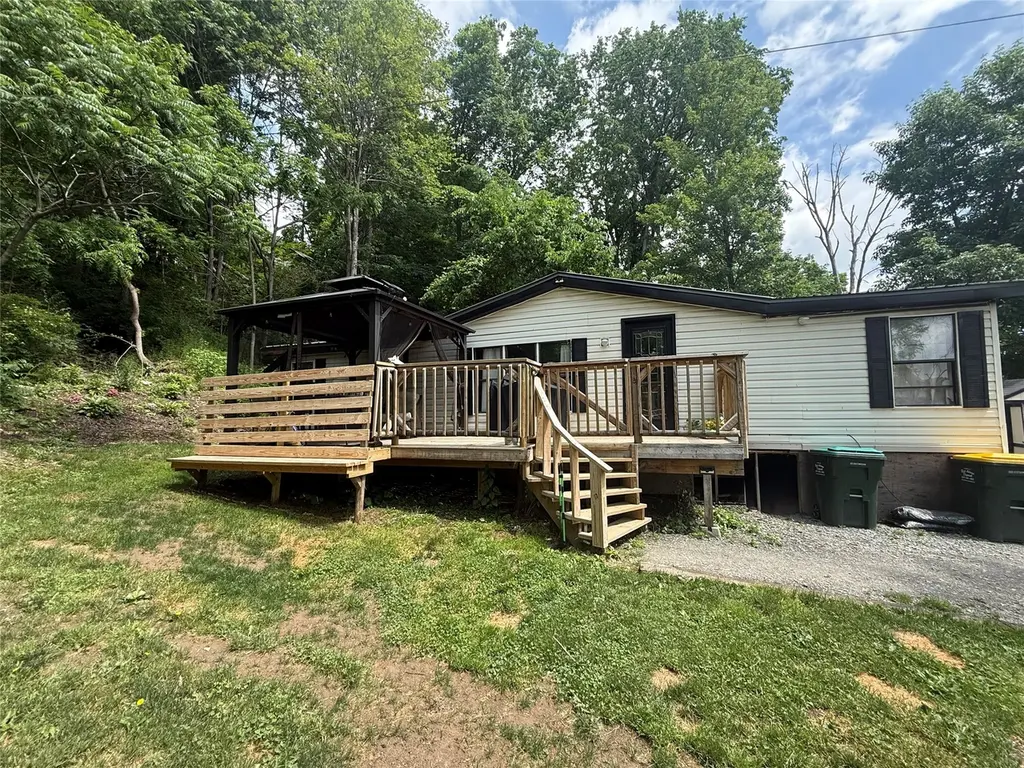
INTERIOR HAS BEEN DONE OVER, NEW CARPET AND PAINTNICE LEVEL LOT WITH TREES. GOOD LOCATION!!
Key facts
- New plumbing
- Metal roof
- Insulation added
Tags
Property features AI
Exterior
- Utilities: Public water; Public sewer; Cable available
- Home design: Manufactured home (double wide); Residential property
- Construction: Vinyl siding; Pillar/post/pier foundation; Built area above grade approximately 1,200
- Exterior features: Deck; Shed(s); Level and wooded lot
Interior
- Flooring: Carpet; Vinyl
- Bathrooms: 2 full bathrooms
- Heating & cooling: Forced air heating
- Interior features: Gas water heater; Carpet and vinyl flooring
Neighborhood map
What this means for you Summary
Snapshot
- This is a 4-bed/2.0-bath manufactured listed at $72k.
Deal economics
- At list price, monthly cash flow is $796 ($10k/yr) — positive.
- The deal already cash-flows at list — no discount required.
- Meets the 1% rule at list price ($2k rent vs $72k).
- Cap rate 19.6% vs local median 4.0% in Chenango Bridge — top-decile yield for the area; either an underpriced asset or a hidden risk that comps aren't pricing in. Stress-test before assuming the spread holds.
Location & tenants
- Location reads 69/100 on livability (#505 in NY) — a middle-class / working-renter tenant base. Strengths: housing A+, crime A-, employment B+; Watch: amenities F, commute F, health & safety D-.
- Chenango Valley Central School District (suburban): math 47% / reading 57% proficiency, ranked #339 of 590 in NY (top 58%) — acceptable for families but not a draw, mixed tenant base, ~2y average lease.
- Zoned schools: Port Dickinson Elementary School (408 students, 39% FRL).
- Market conditions: 92 active listings in the ZIP; 340 units permitted in Broome County in 2024 (269 in 5+ unit buildings).
- This rent runs 38% of the median local income ($56k/yr) — at the standard rent-burdened threshold; future hikes will face affordability resistance.
Forward outlook
- Local home prices are declining (-3.0%/yr); year-one equity from $498 of loan paydown is wiped out by about $2k of value loss. Plan a longer hold.
- Broome County population projected at -13% by 2050 — secular population decline; favor cash flow + early exit over multi-decade hold.
- At projected returns (-3.0% appreciation + 3.0% rent growth), your $20k cash investment doubles in ~3 years — after that, you're playing with house money.
Negotiation context
- Only 1 days on market — expect competitive offers; lowballing is unlikely to land.
- 3 sale attempts since 21y ago with the ask held roughly flat each time — persistent listings suggest the price (not the market) is what's stuck; bring a comps-based counter.
- Current owner paid $40k; list at $72k implies a 80% gain — meaningful room to come down on a strong offer.
Risks & watch-outs
- Watch-outs: property tax is 3.1% of price.
- Climate carrying-cost: moderate flood risk — expect insurance premiums to compound above CPI over the hold.
Questions for the listing agent
- Property tax is high relative to price — has the assessment been appealed recently, and will the sale trigger a re-assessment?
- Is there a deadline driving the sale (1031 exchange, divorce, estate, relocation)? That informs how much negotiation room exists.
- Schools are D-rated, which usually means shorter tenancies and higher turnover. Who's the typical renter profile here, and what's been the actual vacancy rate?
- What's the average days-on-market for RENTAL listings here right now (not sales)? A rising rental-DOM trend means longer vacancies and softer asking-rent achievability than the comps imply.
- What's the recent tenant-quality profile in this submarket — average credit score on applications, eviction rate, late-payment / NSF rate, and stable-employment percentage? A property-management company in the area should have these aggregated.
- How much new for-sale + rental construction is in the pipeline within 1–3 miles? Heavy new supply typically softens prices + rents 12–24 months out; constrained supply supports both.
Investment metrics
- 1% rule
- 2.45% ✓
- Cap rate
- 19.56%
- Cash-on-cash
- 47.39%
- DSCR
- 3.11
- GRM
- 3.4
CMA / ARV
- ARV (on-the-fly)
- $112,860
- Comps found
- 1
Show comp detail 1 sale within ~0.75 mi
| Address | Dist | Beds/Ba | Sqft | Sold | Price | $/sf | Match |
|---|---|---|---|---|---|---|---|
| 133 Kennedy Rd | 0.21mi | 3/2.0 (-1) | 1,344 (+13%) | 2mo | $127,500 | $95 | 61 |
Match score weights: distance 35% · size 25% · config 20% · recency 20%. Top-matched comps best support the ARV.
Projected returns pro-forma
-3.0% appreciation · 3.0% rent growth · sell at horizon
- IRR
- 44.8%
- Equity multiple
- 2.94×
- Total profit
- $39,127
- Equity at exit
- $10,735
- IRR
- 50.8%
- Equity multiple
- 5.95×
- Total profit
- $99,718
- Equity at exit
- $6,225
Cash invested: $20,160 (down + closing). Projections, not guarantees.
Landlord ↔ Tenant lean methodology
- Overall (STATE)
- 15 Strongly Tenant-Friendly
- State New York
- 15 Strongly Tenant-Friendly · D+10
- County
- — inherits STATE
- City
- — inherits STATE
ZIP-level market 13901
- Home prices YoY
- -5.1%
- Active inventory
- 92
- Price-to-rent
- 3.4×
Monthly cashflow live
- Estimated rent
- $1,762 medium interval (Pro) →
- Mortgage (P&I)
- −$378
- Tax from tax record
- −$188 /mo · $2,262/yr
- Insurance
- −$30
- HOA
- −$0
- Vacancy / Maint / Mgmt
- −$370
- Net cashflow
- $796
Break-even live
Sensitivity live
| Price | -10% $837 | -5% $817 | +0% $796 | +5% $776 | +10% $755 |
|---|---|---|---|---|---|
| Rent | -10% $657 | -5% $727 | +0% $796 | +5% $866 | +10% $935 |
| Rate | -1.0pp $832 | -0.5pp $814 | base $796 | +0.5pp $777 | +1.0pp $759 |
UW: 25.0% down · 7.5% · 30yr · 1.5% tax · 5.0% vac · 8.0% maint · 8.0% mgmt
Financing live
Cash to close
- Down payment
- $18,000
- Closing costs
- $2,160
- Reserves months
- —
- Total cash needed
- —
Loan-product check · same deal, 3 products live
Conventional
25% down · 7.5% · 30yr
- Down + closing
- —
- Monthly P&I
- —
- Monthly cashflow
- —
- DSCR
- —
- Eligible?
- —
Personal DTI + credit; lowest rate.
DSCR
20% down · 8.5% · 30yr
- Down + closing
- —
- Monthly P&I
- —
- Monthly cashflow
- —
- DSCR
- —
- Eligible?
- —
No personal income docs; deal must DSCR.
Hard money
10% down · 12.0% · 12mo
- Down + closing
- —
- Monthly P&I
- —
- Monthly cashflow
- —
- DSCR
- —
- Eligible?
- —
Short-term bridge; refi at stabilization.
Listing history 2 events
-
2026-06-13remarks 699-char remark
-
2026-06-13$72,000 Active 1 DOM
ⓘ Source: listings_history table (triggers on properties + properties_extension) + one-shot
backfill from property_details.listing_events for pre-trigger history.
Tax reassessment forecast NY · Partial reset (capped growth)
- Current annual tax
- $2,262 · $188/mo
- Projected year-2 tax
- $2,262 · $188/mo
- Expected delta
- $0/yr ($0/mo · 0.0%)
ⓘ Screening estimate from a state-policy table — verify with the county assessor before closing.
Climate risk First Street
- Flood 5/10 Major FEMA zone X · 26% chance over 30 yrs
- Wildfire 3/10 Moderate
- Heat 3/10 Moderate 7 d/yr ≥92°F today · 16 d/yr by 30 yrs out
- Wind 2/10 Low 2% chance of damaging wind over 30 yrs
- Air quality 2/10 Low 0 unhealthy d/yr today · 1 by 30 yrs out
Nearby sold comps map
Loading sold comps map…
Walkable amenities ~0.75 mi
Loading nearby amenities…
Taxation est. · year 1
- Rental income
- $21,147
- − Mortgage interest
- −$4,033
- − Property taxes
- −$2,262
- − Insurance
- −$360
- − Repairs & maintenance
- −$1,692
- − Management
- −$1,692
- − Depreciation
- −$2,095
- Taxable income
- $9,014
- Est. tax owed @ 24.0%
- −$2,163
- After-tax cash flow
- $7,390/yr
For passive investors: Depreciation is non-cash, so a rental often shows a tax loss while cash-flowing — sheltering income. Rental losses are passive: they offset passive income freely, and up to $25,000/yr can offset ordinary (W-2) income if you actively participate and your MAGI is under $100k (phasing out to $0 by $150k); unused losses carry forward. On sale, claimed depreciation is recaptured at up to 25%, and gains may owe capital-gains tax (a 1031 exchange can defer both). Figures are a year-1 estimate at your 24.0% rate — not tax advice; consult a CPA.
Schools (NCES district)
- District
- Chenango Valley Central School District
- NCES district ID
- 3607290
- Math proficiency
- 47% ▼ -11.00%
- Reading proficiency
- 57% ▲ 4.00%
- Median HH income
- $53,938
- Composite
- 44.78/100
- National rank
- #2745
- State rank
- #339 of 590 in NY
Livability — Chenango Bridge
- Score
- 69/100
- State rank
- #505
- US rank
- #8828
Category grades
Schools grade is shown separately in the Schools card above.
Census & demographics
- County
- Broome County · 126,805 people
- Metro
- Binghamton, NY
- Population (ZIP)
- 19,613
- Household income
- $55,523
- Rent vs Own
- Severe rent burden
- 1230.0
Population outlook (Broome County) Hauer SSP2
- Today (2025)
- 187,989 people
- By 2030
- 183,066 · -2.6%
- By 2040
- 172,228 · -8.4%
- By 2050
- 163,161 · -13.2%
- By 2075
- 153,641 · -18.3%
- By 2100
- 140,851 · -25.1%
Race, ethnicity, and origin ACS 2023
- Neighborhood character
- Predominantly White (80%)
- Race & ethnicity
- White 80% Two or more races 7% Hispanic / Latino 7% Black 5% Asian 2%
- Hispanic origin (detail)
- Puerto Rican 3%
- Common ancestry
- Romanian 6% Lithuanian 1% Italian 1%
- Foreign-born
- 5% · Canada, Jamaica
- Languages at home
- 93% English-only · Spanish 3% Russian/Polish/Slavic 1% Other Indo-European 1%
Political lean MEDSL · Broome
- 2024 margin
- Toss-up / Even · D 50.2% · R 49.8%
- 2008→2024 swing
- -7.6pp toward R · 2008: 8.0pp · 2024: 0.4pp
- All cycles
- 2024: D+0.4 2020: D+3.5 2016: R+3.7 2012: D+4.6 2008: D+8.0
Not yet ingested
- Civics
- —
Market trends
- HPI YoY
- ▼ -16.13%
- Current HPI
- 300.7692
- Rent YoY
- —
- Metro
- Binghamton, NY
- State GDP YoY
- ▲ 2.60%
- F500 in state
- 92
Industry mix (Fortune 500 HQ in NY)
| Industry | F500 HQs | Revenue |
|---|---|---|
| Financial Services | 10 | $950B |
|
||
| Consumer Goods | 9 | $162B |
|
||
| Insurance | 4 | $225B |
|
||
| Telecommunications | 2 | $144B |
|
||
| Pharmaceuticals | 2 | $112B |
|
||
| Media / Entertainment | 2 | $69B |
|
||
Price history
+29.8% since first listed8 events — show timeline
- 2026-06-12 Listed $72,000 GBAOR
- 2010-12-21 Sold (Public Records) $39,900 Public Records
- 2010-12-17 Sold (MLS) $39,900 GBAOR
- 2010-08-26 Listed $39,900 GBAOR
- 2009-02-24 Sold (Public Records) $21,500 Public Records
- 2005-04-14 Sold (MLS) $16,000 GBAOR
- 2005-02-23 Listed $17,900 GBAOR
- 2004-06-21 Sold (Public Records) $55,462 Public Records
Property tax history
+9.2%/yrLatest (2025): $2,262 · +19.4% YoY. Source: county tax records.
Cash-flow waterfall
monthlySold comps — $/sqft
last 12 mo · ≤1 miLoading sold comps…