 🏷️ Likely Rental
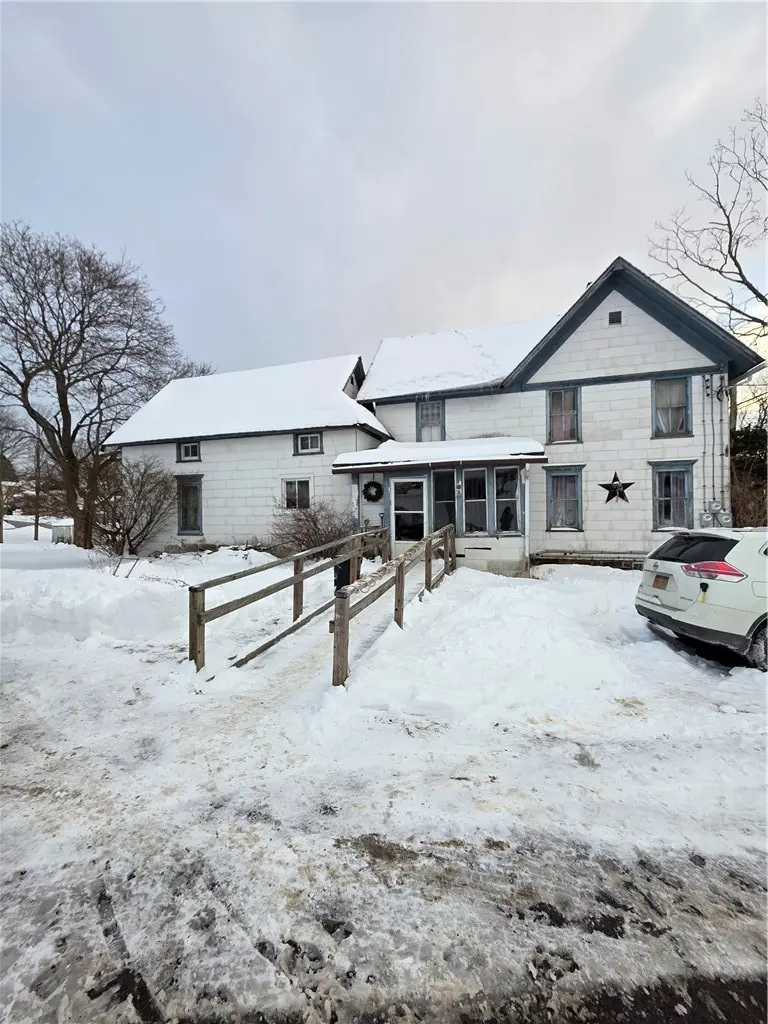
1136 Taft Ave · Endwell, NY
Flood risk 1/10 · Minimal
- FEMA flood zone
- X
- Chance of flooding over 30 yrs
- 0.0%
- Est. flood insurance / yr
- $473 – $860
Fire risk 1/10 · Minimal
- Est. fire insurance / yr
- $691 – $1,283
Heat risk 3/10 · Minor
- Hot days now (above 94°F)
- 7 days/yr
- Hot days in 30 yrs
- 16 days/yr
Wind risk 2/10 · Minimal
- Chance of severe wind over 30 yrs
- 1.0%
Air-quality risk 2/10 · Minimal
- Unhealthy air days now
- 0 days/yr
- Unhealthy air days in 30 yrs
- 1 days/yr
Risk factors via First Street. Map © Google.
Why this score? — see what drove the B grade
The composite is a weighted blend of 9 inputs, each scored 0–100. Each bar is that input's sub-score; the figure is the points it added to the 100-point composite (weight × sub-score).
- Cash flow +30.0/30.0
- 1% rule +10.0/10.0
- DSCR +10.0/10.0
- ARV discount +7.5/15.0
- Rent growth +4.3/5.0
- Schools +4.3/10.0
- Livability +3.7/5.0
- Condition / age +2.5/5.0
- Appreciation +0.0/10.0
$199,000
🖨 Deal sheet (PDF) 📄 Offer letter ✓ Due diligence
Multi-family units
County records classify this as Multi-Family (2-4 Unit). Listing-text estimate: 2 units. confirmed
Listing remarks
Rare opportunity to own a high-stability investment in the heart of Endicott! This unique 2-unit property sits on a massive 2.1-acre lot, offering incredible room for future development. The property generates $1,550 in total monthly rent with a dream tenant profile: both residents have occupied the home for over 20 years and wish to stay. The breakdown includes a lower unit ($800), an upper unit ($600), and a 5-bay garage where 3 bays are currently rented for additional income ($150 total). Featuring a convenient paved driveway loop, this is a "buy and hold" with massive upside. Private well water. This listing is intended to be a novation of contract from a third party at the se
Key facts
- Private well water
- Paved driveway loop
- 2 unit property
Tags
Property features AI
Finance
- Other: Property contains 2 units (3 units in the community); Separate meters: 2 gas meters, 3 electric meters
- Financial info: Tenant pays all utilities; Professional management included in operating expenses (multi-unit)
Exterior
- Parking: 5-car garage; Paved parking; Two or more parking spaces
- Utilities: Sewer connected; Well water
- Home design: 2-story building; Resale property
- Construction: Brick, frame and vinyl siding construction; Poured foundation; Existing (already built)
- Exterior features: Rectangular lot; Main thoroughfare frontage
Interior
- Flooring: Carpet; Hardwood; Tile; Vinyl; Varies
- Bathrooms: 2 full bathrooms; 1 half bathroom
- Heating & cooling: Heating present; Electric heating; Gas heating; Forced air; Wall furnace
- Interior features: Full basement; Varied flooring including carpet, hardwood, tile and vinyl
- Laundry & utility: Gas water heater
Neighborhood map
What this means for you Summary
Snapshot
- This is a 2 × 4-bed/1.2-bath units multifamily listed at $199k.
Deal economics
- At list price, monthly cash flow is $1k ($17k/yr) — positive. Per door: $694/mo.
- The deal already cash-flows at list — no discount required.
- Meets the 1% rule at list price ($4k rent vs $199k).
- Recommended offer: $193k (3.0% below list) — sets the bar for market timing.
- Cap rate 14.7% vs local median 4.0% in Endwell — top-decile yield for the area; either an underpriced asset or a hidden risk that comps aren't pricing in. Stress-test before assuming the spread holds.
Location & tenants
- Location reads 73/100 on livability (#303 in NY, #4,992 nationally) — a middle-class / working-renter tenant base. Strengths: housing A+, health & safety A+, schools A; Watch: crime D-, amenities F, commute F.
- Union-Endicott Central School District (suburban): math 43% / reading 57% proficiency, ranked #387 of 590 in NY (top 66%) — acceptable for families but not a draw, mixed tenant base, ~2y average lease.
- Market conditions: Rents rising fast (+7.1%/yr); 213 active listings in the ZIP; 340 units permitted in Broome County in 2024 (269 in 5+ unit buildings).
- At $3,713/mo this rent would consume 67% of the median local household income ($66k/yr) (locally 1480% of renters already pay >50% of income on rent) — very limited rent-growth headroom before tenants either downsize or default.
Forward outlook
- Local home prices are declining (-3.0%/yr); year-one equity from $1k of loan paydown is wiped out by about $6k of value loss. Plan a longer hold.
- Broome County population projected at -13% by 2050 — secular population decline; favor cash flow + early exit over multi-decade hold.
- At projected returns (-3.0% appreciation + 7.1% rent growth), your $56k cash investment doubles in ~4 years — after that, you're playing with house money.
Negotiation context
- It's been on market 45 days — a 3% lower offer ($193k) is reasonable based on typical stale-listing flexibility.
- 4 sale attempts since 13y ago with the ask held roughly flat each time — persistent listings suggest the price (not the market) is what's stuck; bring a comps-based counter.
- Current owner paid $110k; list at $199k implies a 81% gain — meaningful room to come down on a strong offer.
Risks & watch-outs
- Watch-outs: property tax is 2.5% of price; built in 1938 — expect roof / HVAC / electrical / plumbing capex.
Questions for the listing agent
- It's been on market 45 days. Have you received any prior offers? Is the seller open to a 3% concession, seller financing, or rate buy-down credit?
- Can we see the unit-by-unit rent roll, current vacancy, and any below-market leases? What's the average tenancy length?
- What capital expenditures (roof, boiler, parking lot, exteriors) have been made in the last 5 years, and what's planned in the next 2?
- Built in 1938 — when were the roof, HVAC, electrical panel, plumbing, and water heater last replaced?
- Property tax is high relative to price — has the assessment been appealed recently, and will the sale trigger a re-assessment?
- Is there a deadline driving the sale (1031 exchange, divorce, estate, relocation)? That informs how much negotiation room exists.
- Schools are A-rated — typically a magnet for longer-tenancy family renters. What's the average tenant stay here, and is there a school-zone premium baked into asking?
- Crime grade is D in this area — have there been break-ins, vandalism, or insurance claims at this property in the last 3 years? What carrier currently insures it and at what premium?
- What's the average days-on-market for RENTAL listings here right now (not sales)? A rising rental-DOM trend means longer vacancies and softer asking-rent achievability than the comps imply.
- What's the recent tenant-quality profile in this submarket — average credit score on applications, eviction rate, late-payment / NSF rate, and stable-employment percentage? A property-management company in the area should have these aggregated.
- How much new apartment / multifamily construction is in the pipeline within 1–3 miles? Heavy new supply (>2% of stock underway) typically softens rents 12–24 months out; light construction supports rent growth.
Investment metrics
- 1% rule
- 1.87% ✓
- Cap rate
- 14.67%
- Cash-on-cash
- 29.90%
- DSCR
- 2.33
- GRM
- 4.5
CMA / ARV
- ARV (median comp)
- $405,788
- List price
- $199,000
- Delta
- -50.96%
- Verdict
- UNDERPRICED
- Comps
- 2 within 1.0 mi
Projected returns pro-forma
-3.0% appreciation · 7.09% rent growth · sell at horizon
- IRR
- 29.3%
- Equity multiple
- 2.30×
- Total profit
- $72,249
- Equity at exit
- $29,672
- IRR
- 39.1%
- Equity multiple
- 5.46×
- Total profit
- $248,457
- Equity at exit
- $17,206
Cash invested: $55,720 (down + closing). Projections, not guarantees.
Landlord ↔ Tenant lean methodology
- Overall (STATE)
- 15 Strongly Tenant-Friendly
- State New York
- 15 Strongly Tenant-Friendly · D+10
- County
- — inherits STATE
- City
- — inherits STATE
ZIP-level market 13760
- Home prices YoY
- -32.7%
- Rents YoY
- 7.1%
- Active inventory
- 213
- Price-to-rent
- 8.9×
Monthly cashflow live
- Estimated rent
- $3,713 medium interval (Pro) →
- Mortgage (P&I)
- −$1,044
- Tax from tax record
- −$418 /mo · $5,021/yr
- Insurance
- −$83
- HOA
- −$0
- Vacancy / Maint / Mgmt
- −$780
- Net cashflow
- $1,388
Break-even live
Sensitivity live
| Price | -10% $1,501 | -5% $1,445 | +0% $1,388 | +5% $1,332 | +10% $1,276 |
|---|---|---|---|---|---|
| Rent | -10% $1,095 | -5% $1,242 | +0% $1,388 | +5% $1,535 | +10% $1,682 |
| Rate | -1.0pp $1,489 | -0.5pp $1,439 | base $1,388 | +0.5pp $1,337 | +1.0pp $1,284 |
2-unit breakdown (identical units grouped — click to expand)
| Units | Beds | Baths | Est. rent |
|---|---|---|---|
| 2× units | 4 | 1.2 | $3,714 |
| #1 | 4 | 1.2 | $1,857 |
| #2 | 4 | 1.2 | $1,857 |
| Total (2 units) | $3,713 | ||
UW: 25.0% down · 7.5% · 30yr · 1.5% tax · 5.0% vac · 8.0% maint · 8.0% mgmt
Financing live
Cash to close
- Down payment
- $49,750
- Closing costs
- $5,970
- Reserves months
- —
- Total cash needed
- —
Loan-product check · same deal, 3 products live
Conventional
25% down · 7.5% · 30yr
- Down + closing
- —
- Monthly P&I
- —
- Monthly cashflow
- —
- DSCR
- —
- Eligible?
- —
Personal DTI + credit; lowest rate.
DSCR
20% down · 8.5% · 30yr
- Down + closing
- —
- Monthly P&I
- —
- Monthly cashflow
- —
- DSCR
- —
- Eligible?
- —
No personal income docs; deal must DSCR.
Hard money
10% down · 12.0% · 12mo
- Down + closing
- —
- Monthly P&I
- —
- Monthly cashflow
- —
- DSCR
- —
- Eligible?
- —
Short-term bridge; refi at stabilization.
Listing history 26 events
-
2026-06-19days on market $199,000 Active 45 DOM
-
2026-06-18days on market $199,000 Active 44 DOM
-
2026-06-17days on market $199,000 Active 43 DOM
-
2026-06-16days on market $199,000 Active 42 DOM
-
2026-06-15days on market $199,000 Active 41 DOM
-
2026-06-14days on market $199,000 Active 39 DOM
-
2026-06-13pricedays on market $199,000 Active 38 DOM
-
2026-06-10days on market $207,400 Active 36 DOM
-
2026-06-09days on market $207,400 Active 35 DOM
-
2026-06-08days on market $207,400 Active 34 DOM
-
2026-06-07days on market $207,400 Active 33 DOM
-
2026-06-05days on market $207,400 Active 30 DOM
-
2026-06-03days on market $207,400 Active 29 DOM
-
2026-06-02days on market $207,400 Active 28 DOM
-
2026-06-01days on market $207,400 Active 27 DOM
-
2026-05-31days on market $207,400 Active 26 DOM
-
2026-05-30days on market $207,400 Active 25 DOM
-
2026-05-05$207,400 Active 720-char remark
-
2026-04-30historical
-
2026-04-07price $209,900
-
2026-03-12price $229,000
-
2026-02-06$239,000 Active
-
2017-09-12soldstatus $110,000
-
2017-09-07soldstatus $110,000
-
2016-01-06$136,500
-
2013-08-29$168,000
ⓘ Source: listings_history table (triggers on properties + properties_extension) + one-shot
backfill from property_details.listing_events for pre-trigger history.
Tax reassessment forecast NY · Partial reset (capped growth)
- Current annual tax
- $5,021 · $418/mo
- Projected year-2 tax
- $5,021 · $418/mo
- Expected delta
- $0/yr ($0/mo · 0.0%)
ⓘ Screening estimate from a state-policy table — verify with the county assessor before closing.
Climate risk First Street
- Flood 1/10 Low FEMA zone X · 0% chance over 30 yrs
- Wildfire 1/10 Low
- Heat 3/10 Moderate 7 d/yr ≥94°F today · 16 d/yr by 30 yrs out
- Wind 2/10 Low 100% chance of damaging wind over 30 yrs
- Air quality 2/10 Low 0 unhealthy d/yr today · 1 by 30 yrs out
Nearby sold comps map
Loading sold comps map…
Walkable amenities ~0.75 mi
Loading nearby amenities…
Taxation est. · year 1
- Rental income
- $44,556
- − Mortgage interest
- −$11,147
- − Property taxes
- −$5,021
- − Insurance
- −$995
- − Repairs & maintenance
- −$3,564
- − Management
- −$3,564
- − Depreciation
- −$5,789
- Taxable income
- $14,475
- Est. tax owed @ 24.0%
- −$3,474
- After-tax cash flow
- $13,187/yr
For passive investors: Depreciation is non-cash, so a rental often shows a tax loss while cash-flowing — sheltering income. Rental losses are passive: they offset passive income freely, and up to $25,000/yr can offset ordinary (W-2) income if you actively participate and your MAGI is under $100k (phasing out to $0 by $150k); unused losses carry forward. On sale, claimed depreciation is recaptured at up to 25%, and gains may owe capital-gains tax (a 1031 exchange can defer both). Figures are a year-1 estimate at your 24.0% rate — not tax advice; consult a CPA.
Schools (NCES district)
- District
- Union-Endicott Central School District
- NCES district ID
- 3610710
- Math proficiency
- 43% ▼ -9.00%
- Reading proficiency
- 57% ▲ 11.00%
- Median HH income
- $49,265
- Composite
- 42.66/100
- National rank
- #3176
- State rank
- #387 of 590 in NY
Livability — Endwell
- Score
- 73/100
- State rank
- #303
- US rank
- #4992
Category grades
Schools grade is shown separately in the Schools card above.
Census & demographics
- County
- Broome County · 126,805 people
- Metro
- Binghamton, NY
- Population (ZIP)
- 42,896
- Household income
- $66,095
- Rent vs Own
- Severe rent burden
- 1480.0
Population outlook (Broome County) Hauer SSP2
- Today (2025)
- 187,989 people
- By 2030
- 183,066 · -2.6%
- By 2040
- 172,228 · -8.4%
- By 2050
- 163,161 · -13.2%
- By 2075
- 153,641 · -18.3%
- By 2100
- 140,851 · -25.1%
Race, ethnicity, and origin ACS 2023
- Neighborhood character
- Predominantly White (84%)
- Race & ethnicity
- White 84% Two or more races 7% Hispanic / Latino 6% Black 4% Asian 2%
- Hispanic origin (detail)
- Puerto Rican 2%
- Common ancestry
- Romanian 6% Lithuanian 2% Slovak 2%
- Foreign-born
- 5% · Canada, China
- Languages at home
- 94% English-only · Spanish 2% Other Indo-European 1% Russian/Polish/Slavic 1%
Political lean MEDSL · Broome
- 2024 margin
- Toss-up / Even · D 50.2% · R 49.8%
- 2008→2024 swing
- -7.6pp toward R · 2008: 8.0pp · 2024: 0.4pp
- All cycles
- 2024: D+0.4 2020: D+3.5 2016: R+3.7 2012: D+4.6 2008: D+8.0
Not yet ingested
- Civics
- —
Market trends
- HPI YoY
- ▼ -131.29%
- Current HPI
- 270.2661
- Rent YoY
- ▲ 7.09%
- Metro
- Binghamton, NY
- State GDP YoY
- ▲ 2.60%
- F500 in state
- 92
Industry mix (Fortune 500 HQ in NY)
| Industry | F500 HQs | Revenue |
|---|---|---|
| Financial Services | 10 | $950B |
|
||
| Consumer Goods | 9 | $162B |
|
||
| Insurance | 4 | $225B |
|
||
| Telecommunications | 2 | $144B |
|
||
| Pharmaceuticals | 2 | $112B |
|
||
| Media / Entertainment | 2 | $69B |
|
||
Price history
+18.5% since first listed10 events — show timeline
- 2026-06-10 Price Changed $199,000 UNYREIS
- 2026-05-05 Listed $207,400 UNYREIS
- 2026-04-30 Listing Removed — UNYREIS
- 2026-04-07 Price Changed $209,900 UNYREIS
- 2026-03-12 Price Changed $229,000 UNYREIS
- 2026-02-06 Listed $239,000 UNYREIS
- 2017-09-12 Sold (Public Records) $110,000 Public Records
- 2017-09-07 Sold (MLS) $110,000 GBAOR
- 2016-01-06 Listed $136,500 GBAOR
- 2013-08-29 Listed $168,000 GBAOR
Property tax history
+2.0%/yrLatest (2025): $5,021 · +3.7% YoY. Source: county tax records.
Cash-flow waterfall
monthlySold comps — $/sqft
last 12 mo · ≤1 miLoading sold comps…