 🏗️ New Construction
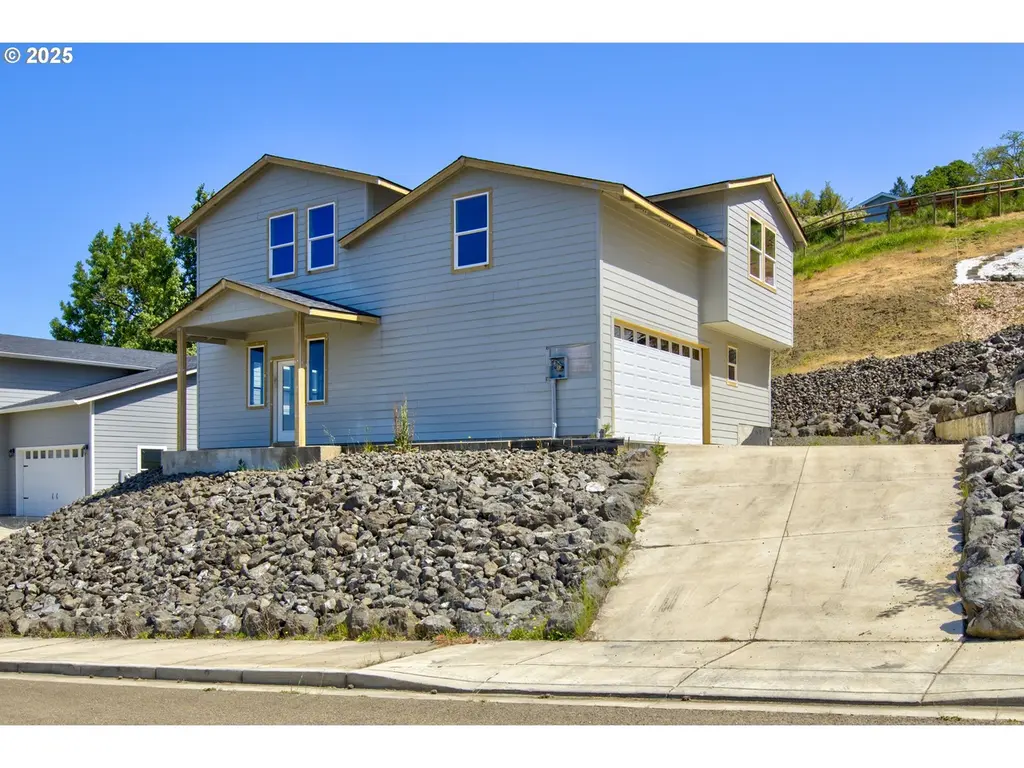
1030 Forest Heights St · Sutherlin, OR
Flood risk 1/10 · Minimal
- FEMA flood zone
- X (unshaded)
- Chance of flooding over 30 yrs
- 0.0%
- Est. flood insurance / yr
- $507 – $1,088
Fire risk 8/10 · Major
- Est. fire insurance / yr
- $498 – $926
Heat risk 4/10 · Minor
- Hot days now (above 92°F)
- 7 days/yr
- Hot days in 30 yrs
- 16 days/yr
Wind risk 1/10 · Minimal
- Chance of severe wind over 30 yrs
- —
Air-quality risk 9/10 · Severe
- Unhealthy air days now
- 12 days/yr
- Unhealthy air days in 30 yrs
- 12 days/yr
Risk factors via First Street. Map © Google.
Why this score? — see what drove the F grade
The composite is a weighted blend of 9 inputs, each scored 0–100. Each bar is that input's sub-score; the figure is the points it added to the 100-point composite (weight × sub-score).
- ARV discount +7.5/15.0
- Cash flow +6.1/30.0
- Livability +3.5/5.0
- Rent growth +2.5/5.0
- Schools +2.5/10.0
- Condition / age +2.5/5.0
- 1% rule +0.5/10.0
- DSCR +0.4/10.0
- Appreciation +0.0/10.0
$239,900
🖨 Deal sheet 📄 Offer letter ✓ Due diligence
Listing remarks
Investment opportunity awaits at 1030 Forest Heights in Sutherlin, OR—a partially completed home in the sought-after Forest Heights subdivision, ready for you to finish to your vision. Ideal for investors, builders, or homeowners eager to customize and build equity, this project already has a durable composition roof, lap siding, vinyl windows, and a finished concrete driveway in place. Inside, the home is a blank canvas, awaiting plumbing, electrical, HVAC, insulation, drywall, and all interior finishes. Whether you plan to create your dream home or complete it for resale, this property offers a rare chance to take over a promising build with significant progress made. Don’t mi
Key facts
- Vinyl windows
- Lap siding
- Composition roof
Tags
Property features AI
Finance
- Other: Property zoned RH; Lot roughly 0.2 acre (7,000–9,999 sq ft range)
Exterior
- Parking: Driveway and on-street parking; Attached 2-car garage
- Utilities: Public water; Public sewer; Electricity and gas available; DSL internet service
- Home design: Single-family residence (residential); Under construction / new construction; Two-story layout (main and upper levels); Mountain and valley views
- Construction: Built in 2019; Concrete perimeter and stem wall foundation
- Exterior features: Lap siding exterior; Composition roof; Public road access; Paved road frontage; Lot is gentle sloping to level
Interior
- Kitchen: Kitchen on the main level
- Bedrooms: Primary bedroom on the upper level; Second bedroom on the upper level; Third bedroom on the upper level
- Bathrooms: Two full bathrooms; One half bathroom
- Heating & cooling: Forced air heating; No central cooling listed
- Interior features: Accessible design with a main-level utility/laundry room; Double-pane windows with vinyl frames; Crawl space basement
- Laundry & utility: Laundry/utility room on the main level
Neighborhood map
What this means for you Summary
Snapshot
- This is a 4-bed/4.0-bath single-family listed at $240k.
Deal economics
- At list price, monthly cash flow is $-754 ($-9k/yr) — negative.
- The deal already cash-flows at list — no discount required.
- To meet the 1% rule (rent ≥ 1% of price), the offer needs to be $223k (7.0% below list).
- Recommended offer: $223k (7.0% below list) — sets the bar for 1% rule.
Location & tenants
- Location reads 70/100 on livability (#135 in OR) — a middle-class / working-renter tenant base. Strengths: cost of living A+, housing A+; Watch: employment C-, health & safety C-, amenities F.
- Sutherlin SD 130 (town): math 19% / reading 40% proficiency, ranked #47 of 58 in OR (top 81%) — low school quality limits family demand, transient renter base, plan for 1-2y turnover.
- Zoned schools: East Sutherlin Primary School (296 students, 67% FRL); Sutherlin Middle School (math 17% / reading 37%, grade F, #96 of 128 statewide, top 78%, 289 students, 65% FRL); Sutherlin High School (math 24% / reading 44%, grade F, #94 of 143 statewide, top 70%, 361 students, 83% FRL) — zoned schools average 72% FRL vs 55% district-wide (17 pts higher); higher-poverty schools than district average — tighter screening recommended.
- Market conditions: 109 active listings in the ZIP; 190 units permitted in Douglas County in 2024 (0 in 5+ unit buildings).
Forward outlook
- Local home prices are declining (-3.0%/yr); year-one equity from $3k of loan paydown is wiped out by about $12k of value loss. Plan a longer hold.
- Douglas County population projected at -13% by 2050 — secular population decline; favor cash flow + early exit over multi-decade hold.
Negotiation context
- It's been on market 43 days — a 3% lower offer ($233k) is reasonable based on typical stale-listing flexibility.
Risks & watch-outs
- Climate carrying-cost: severe wildfire risk — expect insurance premiums to compound above CPI over the hold.
Questions for the listing agent
- What do current leases actually rent for vs. the listed asking? Can we see a recent rent roll and the last 12 months of T-12 income?
- It's been on market 43 days. Have you received any prior offers? Is the seller open to a 7% concession, seller financing, or rate buy-down credit?
- Is there a deadline driving the sale (1031 exchange, divorce, estate, relocation)? That informs how much negotiation room exists.
- The area grade is low — what's the realistic commute time and amenity access for the typical tenant pool here? Any planned neighborhood developments (good or bad) we should know about?
- What's the average days-on-market for RENTAL listings here right now (not sales)? A rising rental-DOM trend means longer vacancies and softer asking-rent achievability than the comps imply.
- What's the recent tenant-quality profile in this submarket — average credit score on applications, eviction rate, late-payment / NSF rate, and stable-employment percentage? A property-management company in the area should have these aggregated.
- How much new for-sale + rental construction is in the pipeline within 1–3 miles? Heavy new supply typically softens prices + rents 12–24 months out; constrained supply supports both.
Investment metrics
- 1% rule
- 0.55% ✗
- Cap rate
- 4.06%
- Cash-on-cash
- -7.99%
- DSCR
- 0.64
- GRM
- 15.1
CMA / ARV
- ARV (median comp)
- $404,061
- List price
- $239,900
- Delta
- -40.63%
- Verdict
- UNDERPRICED
- Comps
- 19 within 1.0 mi
Show comp detail 3 sales within ~0.75 mi
| Address | Dist | Beds/Ba | Sqft | Sold | Price | $/sf | Match |
|---|---|---|---|---|---|---|---|
| 835 Forest Heights St | 0.18mi | 3/3.0 (-1) | 2,492 (+2%) | 15mo | $425,000 | $171 | 66 |
| 1028 Forest Heights St | 0.01mi | 3/3.0 (-1) | 2,120 (-13%) | 7mo | $370,000 | $175 | 63 |
| 998 Forest Heights St | 0.05mi | 3/3.0 (-1) | 2,073 (-15%) | 16mo | $223,250 | $108 | 51 |
Match score weights: distance 35% · size 25% · config 20% · recency 20%. Top-matched comps best support the ARV.
Projected returns pro-forma
-3.0% appreciation · 3.0% rent growth · sell at horizon
- IRR
- -30.4%
- Equity multiple
- -0.00×
- Total profit
- $-113,603
- Equity at exit
- $60,247
- IRR
- -32.6%
- Equity multiple
- -0.43×
- Total profit
- $-161,275
- Equity at exit
- $34,936
Cash invested: $113,137 (down + closing). Projections, not guarantees.
Landlord ↔ Tenant lean methodology
- Overall (STATE)
- 28 Tenant-Leaning
- State Oregon
- 28 Tenant-Leaning · D+6
- County
- — inherits STATE
- City
- — inherits STATE
ZIP-level market 97479
- Home prices YoY
- -19.2%
- Active inventory
- 109
- Price-to-rent
- 9.0×
Monthly cashflow live
- Estimated rent
- $2,231 medium interval (Pro) →
- Mortgage (P&I)
- −$2,119
- Tax from tax record
- −$229 /mo · $2,742/yr
- Insurance
- −$168
- HOA
- −$0
- Vacancy / Maint / Mgmt
- −$468
- Net cashflow
- $-754
Break-even live
UW: 25.0% down · 7.5% · 30yr · 1.5% tax · 5.0% vac · 8.0% maint · 8.0% mgmt
Financing live
Cash to close
- Down payment
- $101,015
- Closing costs
- $12,122
- Reserves months
- —
- Total cash needed
- —
Loan-product check · same deal, 3 products live
Conventional
25% down · 7.5% · 30yr
- Down + closing
- —
- Monthly P&I
- —
- Monthly cashflow
- —
- DSCR
- —
- Eligible?
- —
Personal DTI + credit; lowest rate.
DSCR
20% down · 8.5% · 30yr
- Down + closing
- —
- Monthly P&I
- —
- Monthly cashflow
- —
- DSCR
- —
- Eligible?
- —
No personal income docs; deal must DSCR.
Hard money
10% down · 12.0% · 12mo
- Down + closing
- —
- Monthly P&I
- —
- Monthly cashflow
- —
- DSCR
- —
- Eligible?
- —
Short-term bridge; refi at stabilization.
Listing history 19 events
-
2026-06-19days on market $239,900 Active 43 DOM
-
2026-06-18days on market $239,900 Active 42 DOM
-
2026-06-17days on market $239,900 Active 41 DOM
-
2026-06-16days on market $239,900 Active 40 DOM
-
2026-06-15days on market $239,900 Active 39 DOM
-
2026-06-14days on market $239,900 Active 37 DOM
-
2026-06-12days on market $239,900 Active 36 DOM
-
2026-06-09days on market $239,900 Active 33 DOM
-
2026-06-08days on market $239,900 Active 32 DOM
-
2026-06-07days on market $239,900 Active 31 DOM
-
2026-06-03days on market $239,900 Active 27 DOM
-
2026-06-02days on market $239,900 Active 26 DOM
-
2026-06-01days on market $239,900 Active 25 DOM
-
2026-05-31days on market $239,900 Active 24 DOM
-
2026-05-30days on market $239,900 Active 23 DOM
-
2026-05-07$239,900 Active 905-char remark
-
2022-07-27soldstatus $535,160
-
2018-08-21soldstatus $616,000
-
2013-12-30soldstatus $417,857
ⓘ Source: listings_history table (triggers on properties + properties_extension) + one-shot
backfill from property_details.listing_events for pre-trigger history.
Tax reassessment forecast OR · Resets to sale price
- Current annual tax
- $2,742 · $229/mo
- Projected year-2 tax
- $2,742 · $229/mo
- Expected delta
- $0/yr ($0/mo · 0.0%)
ⓘ Screening estimate from a state-policy table — verify with the county assessor before closing.
Climate risk First Street
- Flood 1/10 Low FEMA zone X (unshaded) · 0% chance over 30 yrs
- Wildfire 8/10 Severe
- Heat 4/10 Moderate 7 d/yr ≥92°F today · 16 d/yr by 30 yrs out
- Wind 1/10 Low
- Air quality 9/10 Extreme 12 unhealthy d/yr today · 12 by 30 yrs out
Nearby sold comps map
Loading sold comps map…
Walkable amenities ~0.75 mi
Loading nearby amenities…
Taxation est. · year 1
- Rental income
- $26,769
- − Mortgage interest
- −$22,634
- − Property taxes
- −$2,742
- − Insurance
- −$2,020
- − Repairs & maintenance
- −$2,142
- − Management
- −$2,142
- − Depreciation
- −$11,755
- Taxable loss
- −$16,665
- Est. tax savings @ 24.0%
- +$4,000
- After-tax cash flow
- $-5,043/yr
For passive investors: Depreciation is non-cash, so a rental often shows a tax loss while cash-flowing — sheltering income. Rental losses are passive: they offset passive income freely, and up to $25,000/yr can offset ordinary (W-2) income if you actively participate and your MAGI is under $100k (phasing out to $0 by $150k); unused losses carry forward. On sale, claimed depreciation is recaptured at up to 25%, and gains may owe capital-gains tax (a 1031 exchange can defer both). Figures are a year-1 estimate at your 24.0% rate — not tax advice; consult a CPA.
Schools (NCES district)
- District
- Sutherlin SD 130
- NCES district ID
- 4111940
- Math proficiency
- 19% ▼ -19.00%
- Reading proficiency
- 40% ▼ -14.00%
- Median HH income
- $40,425
- Composite
- 24.79/100
- National rank
- #7598
- State rank
- #47 of 58 in OR
Livability — Sutherlin
- Score
- 70/100
- State rank
- #135
- US rank
- #7711
Category grades
Schools grade is shown separately in the Schools card above.
Census & demographics
- Census place
- Sutherlin, OR
- Population (ZIP)
- 10,479
Population outlook (Douglas County) Hauer SSP2
- Today (2025)
- 105,191 people
- By 2030
- 102,664 · -2.4%
- By 2040
- 96,668 · -8.1%
- By 2050
- 91,279 · -13.2%
- By 2075
- 79,395 · -24.5%
- By 2100
- 66,107 · -37.2%
Race, ethnicity, and origin ACS 2023
- Neighborhood character
- Predominantly White (91%)
- Race & ethnicity
- White 91% Two or more races 4% Hispanic / Latino 3% Black 1%
- Common ancestry
- Italian 3% Serbian 3% Slovak 3%
- Foreign-born
- 2%
- Languages at home
- 99% English-only · Spanish 1%
Political lean MEDSL · Douglas
- 2024 margin
- Solid R (+37.7) · D 29.9% · R 67.6% · Other 2.5%
- 2008→2024 swing
- -17.6pp toward R · 2008: -20.1pp · 2024: -37.7pp
- All cycles
- 2024: R+37.7 2020: R+37.5 2016: R+39.4 2012: R+27.6 2008: R+20.1
Not yet ingested
- Civics
- —
Market trends
- HPI YoY
- ▼ -78.34%
- Current HPI
- 328.8614
- Rent YoY
- —
- Metro
- —
- State GDP YoY
- ▲ 2.05%
- F500 in state
- 2
Industry mix (Fortune 500 HQ in OR)
| Industry | F500 HQs | Revenue |
|---|---|---|
| Consumer Goods | 1 | $51B |
|
||
Price history
-42.6% since first listed4 events — show timeline
- 2026-05-07 Listed $239,900 RMLS
- 2022-07-27 Sold (Public Records) $535,160 Public Records
- 2018-08-21 Sold (Public Records) $616,000 Public Records
- 2013-12-30 Sold (Public Records) $417,857 Public Records
Property tax history
+11.7%/yrLatest (2025): $2,742 · +2.6% YoY. Source: county tax records.
Cash-flow waterfall
monthlySold comps — $/sqft
last 12 mo · ≤1 miLoading sold comps…