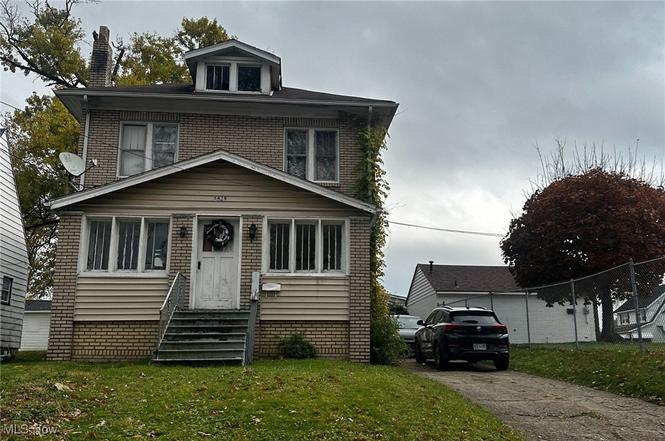
3419 Hillman St · Youngstown, OH
Flood risk 1/10 · Minimal
- FEMA flood zone
- X (unshaded)
- Chance of flooding over 30 yrs
- 0.0%
- Est. flood insurance / yr
- $473 – $860
Fire risk 1/10 · Minimal
- Est. fire insurance / yr
- $713 – $1,323
Heat risk 3/10 · Minor
- Hot days now (above 97°F)
- 7 days/yr
- Hot days in 30 yrs
- 17 days/yr
Wind risk 1/10 · Minimal
- Chance of severe wind over 30 yrs
- —
Air-quality risk 2/10 · Minimal
- Unhealthy air days now
- 1 days/yr
- Unhealthy air days in 30 yrs
- 2 days/yr
Risk factors via First Street. Map © Google.
Why this score? — see what drove the B+ grade
The composite is a weighted blend of 9 inputs, each scored 0–100. Each bar is that input's sub-score; the figure is the points it added to the 100-point composite (weight × sub-score).
- Cash flow +30.0/30.0
- ARV discount +12.1/15.0
- 1% rule +10.0/10.0
- DSCR +10.0/10.0
- Appreciation +4.6/10.0
- Livability +4.0/5.0
- Rent growth +2.5/5.0
- Condition / age +2.5/5.0
- Schools +0.9/10.0
$67,900
🖨 Deal sheet (PDF) 📄 Offer letter ✓ Due diligence
Listing remarks
Tenant-occupied, income-producing single-family rental generating $850 per month in rent. Tenant pays all utilities and maintains the yard, resulting in low operating expenses for ownership. Solid brick exterior with long-term tenant in place. Interior reflects tenant occupancy and features original finishes throughout. Property is being sold as-is. Strong rent-to-price ratio makes this a reliable buy-and-hold investment with upside through future rent increases or value-add improvements. Seller owns multiple rental properties and is open to selling individually or as part of a package.
Key facts
- 5,009 sq ft lot
- Garage
- Built 1950
Property features AI
Finance
- Financial info: Annual taxes listed (see broker for details)
Exterior
- Parking: Driveway; 1-car garage
- Utilities: Public water; Public sewer
- Home design: 2 stories; Above-grade finished area about 1,201
- Construction: Built (year per public records); Brick exterior; Shingle roof; Unfinished basement foundation
- Exterior features: Brick construction; Shingle roof; Lot approximately 0.115 acres
Interior
- Bedrooms: Total rooms: 8
- Bathrooms: 1 full bathroom
- Heating & cooling: Forced air heating; Gas heating
- Interior features: Unfinished basement; Fireplace (1)
Neighborhood map
What this means for you Summary
Snapshot
- This is a 4-bed/1.0-bath single-family listed at $68k.
Deal economics
- At list price, monthly cash flow is $495 ($6k/yr) — positive.
- The deal already cash-flows at list — no discount required.
- Meets the 1% rule at list price ($1k rent vs $68k).
- Recommended offer: $60k (12.0% below list) — sets the bar for market timing.
- Cap rate 15.0% vs local median 6.3% in Youngstown — top-decile yield for the area; either an underpriced asset or a hidden risk that comps aren't pricing in. Stress-test before assuming the spread holds.
Location & tenants
- Location reads 81/100 on livability (#99 in OH, #1,506 nationally) — a professional / high-income tenant draw. Strengths: amenities A+, commute A+, cost of living A+; Watch: crime F, employment F.
- Youngstown City (urban): math 8% / reading 17% proficiency, ranked #649 of 656 in OH (top 99%) — low school quality limits family demand, transient renter base, plan for 1-2y turnover; 88% free/reduced lunch — lower-income household profile, screen leases tightly.
- Market conditions: 34 active listings in the ZIP; 2 comparable units currently listed for rent nearby; lower-income renter base — watch delinquency; 147 units permitted in Mahoning County in 2024 (0 in 5+ unit buildings).
- At $1,157/mo this rent would consume 54% of the median local household income ($26k/yr) (locally 17% of renters already pay >50% of income on rent) — very limited rent-growth headroom before tenants either downsize or default.
Forward outlook
- Local home prices are declining (-0.8%/yr); year-one equity from $469 of loan paydown is wiped out by about $562 of value loss. Plan a longer hold.
- Mahoning County population projected at -14% by 2050 — secular population decline; favor cash flow + early exit over multi-decade hold.
- At projected returns (-0.8% appreciation + 3.0% rent growth), your $19k cash investment doubles in ~4 years — after that, you're playing with house money.
Negotiation context
- It's been on market 159 days — a 12% lower offer ($60k) is reasonable based on typical stale-listing flexibility.
- 2 sale attempts since 34y ago; this cycle's ask has dropped $10k (13%) from the opening price — seller is motivated, your offer sets the floor, not the list.
- Current owner paid $12k; list at $68k implies a 466% gain — meaningful room to come down on a strong offer.
Risks & watch-outs
- Watch-outs: built in 1950 — expect roof / HVAC / electrical / plumbing capex.
Questions for the listing agent
- It's been on market 159 days. Have you received any prior offers? Is the seller open to a 12% concession, seller financing, or rate buy-down credit?
- Built in 1950 — when were the roof, HVAC, electrical panel, plumbing, and water heater last replaced?
- Why hasn't it sold? Are there any deal-killer items the seller is aware of (foundation, flood, title, zoning, code violations)?
- Is there a deadline driving the sale (1031 exchange, divorce, estate, relocation)? That informs how much negotiation room exists.
- Crime grade is F in this area — have there been break-ins, vandalism, or insurance claims at this property in the last 3 years? What carrier currently insures it and at what premium?
- What's the average days-on-market for RENTAL listings here right now (not sales)? A rising rental-DOM trend means longer vacancies and softer asking-rent achievability than the comps imply.
- What's the recent tenant-quality profile in this submarket — average credit score on applications, eviction rate, late-payment / NSF rate, and stable-employment percentage? A property-management company in the area should have these aggregated.
- How much new for-sale + rental construction is in the pipeline within 1–3 miles? Heavy new supply typically softens prices + rents 12–24 months out; constrained supply supports both.
Investment metrics
- 1% rule
- 1.70% ✓
- Cap rate
- 15.04%
- Cash-on-cash
- 31.24%
- DSCR
- 2.39
- GRM
- 4.9
CMA / ARV
- ARV (on-the-fly)
- $75,663
- Comps found
- 12
Show comp detail 12 sales within ~0.75 mi
| Address | Dist | Beds/Ba | Sqft | Sold | Price | $/sf | Match |
|---|---|---|---|---|---|---|---|
| 311 Ferndale Ave | 0.11mi | 3/1.0 (-1) | 1,189 (-1%) | 18mo | $88,000 | $74 | 73 |
| 21 Vermont Ave | 0.41mi | 3/1.0 (-1) | 1,156 (-4%) | 0mo | $155,000 | $134 | 69 |
| 159 E Ravenwood Ave | 0.49mi | 3/1.0 (-1) | 1,249 (+4%) | 6mo | $45,000 | $36 | 61 |
| 221 E Avondale Ave | 0.63mi | 3/1.0 (-1) | 1,181 (-2%) | 3mo | $53,000 | $45 | 60 |
| 471 W Hylda | 0.57mi | 4/1.5 | 1,151 (-4%) | 12mo | $29,000 | $25 | 55 |
| 34 Labelle Ave | 0.26mi | 3/1.5 (-1) | 1,327 (+10%) | 14mo | $105,000 | $79 | 52 |
| 230 Clarencedale Ave | 0.72mi | 3/1.5 (-1) | 1,232 (+3%) | 5mo | $130,000 | $106 | 51 |
| 464 W Hylda Ave | 0.58mi | 3/2.0 (-1) | 1,152 (-4%) | 12mo | $60,000 | $52 | 47 |
| 570 Almyra Ave | 0.60mi | 3/1.0 (-1) | 1,328 (+11%) | 14mo | $59,000 | $44 | 37 |
| 4340 Helena Ave | 0.72mi | 3/2.0 (-1) | 1,328 (+11%) | 4mo | $110,000 | $83 | 36 |
| 2733 Griselda Ave | 0.69mi | 3/1.5 (-1) | 1,025 (-15%) | 3mo | $65,000 | $63 | 34 |
| 210 Hollywood Ave | 0.74mi | 3/2.0 (-1) | 1,066 (-11%) | 14mo | $41,000 | $38 | 26 |
Match score weights: distance 35% · size 25% · config 20% · recency 20%. Top-matched comps best support the ARV.
Projected returns pro-forma
-0.83% appreciation · 3.0% rent growth · sell at horizon
- IRR
- 30.3%
- Equity multiple
- 2.42×
- Total profit
- $26,931
- Equity at exit
- $16,954
- IRR
- 34.9%
- Equity multiple
- 4.69×
- Total profit
- $70,075
- Equity at exit
- $18,288
Cash invested: $19,012 (down + closing). Projections, not guarantees.
Landlord ↔ Tenant lean methodology
- Overall (STATE)
- 73 Landlord-Friendly
- State Ohio
- 73 Landlord-Friendly · R+6
- County
- — inherits STATE
- City
- — inherits STATE
ZIP-level market 44507
- Home prices YoY
- -0.3%
- Active inventory
- 34
- Price-to-rent
- 4.9×
Monthly cashflow live
- Estimated rent
- $1,157 medium interval (Pro) →
- Mortgage (P&I)
- −$356
- Tax from tax record
- −$35 /mo · $417/yr
- Insurance
- −$28
- HOA
- −$0
- Vacancy / Maint / Mgmt
- −$243
- Net cashflow
- $495
Break-even live
Sensitivity live
| Price | -10% $533 | -5% $514 | +0% $495 | +5% $476 | +10% $457 |
|---|---|---|---|---|---|
| Rent | -10% $404 | -5% $449 | +0% $495 | +5% $541 | +10% $586 |
| Rate | -1.0pp $529 | -0.5pp $512 | base $495 | +0.5pp $477 | +1.0pp $460 |
UW: 25.0% down · 7.5% · 30yr · 1.5% tax · 5.0% vac · 8.0% maint · 8.0% mgmt
Financing live
Cash to close
- Down payment
- $16,975
- Closing costs
- $2,037
- Reserves months
- —
- Total cash needed
- —
Loan-product check · same deal, 3 products live
Conventional
25% down · 7.5% · 30yr
- Down + closing
- —
- Monthly P&I
- —
- Monthly cashflow
- —
- DSCR
- —
- Eligible?
- —
Personal DTI + credit; lowest rate.
DSCR
20% down · 8.5% · 30yr
- Down + closing
- —
- Monthly P&I
- —
- Monthly cashflow
- —
- DSCR
- —
- Eligible?
- —
No personal income docs; deal must DSCR.
Hard money
10% down · 12.0% · 12mo
- Down + closing
- —
- Monthly P&I
- —
- Monthly cashflow
- —
- DSCR
- —
- Eligible?
- —
Short-term bridge; refi at stabilization.
Rent comps 2 comps
| Address | Beds | Baths | Sqft | Rent | $/sqft | DOM | Units | Dist |
|---|---|---|---|---|---|---|---|---|
| 236 Hilton Ave Youngstown, OH | 4.0 | 1.5 | 1488 | $1,195 | $0.80 | 23d | 1 | 0.67mi |
| 158 Beechwood Dr Youngstown, OH | 3.0 | 1.5 | 1438 | $1,100 | $0.76 | 15d | 1 | 1.04mi |
Listing history 21 events
-
2026-06-21days on market $67,900 Active 159 DOM
-
2026-06-19days on market $67,900 Active 157 DOM
-
2026-06-18days on market $67,900 Active 156 DOM
-
2026-06-17days on market $67,900 Active 155 DOM
-
2026-06-16days on market $67,900 Active 154 DOM
-
2026-06-15days on market $67,900 Active 153 DOM
-
2026-06-14days on market $67,900 Active 151 DOM
-
2026-06-13days on market $67,900 Active 150 DOM
-
2026-06-10days on market $67,900 Active 148 DOM
-
2026-06-09days on market $67,900 Active 147 DOM
-
2026-06-08days on market $67,900 Active 146 DOM
-
2026-06-07days on market $67,900 Active 145 DOM
-
2026-06-03days on market $67,900 Active 141 DOM
-
2026-06-02days on market $67,900 Active 140 DOM
-
2026-06-01days on market $67,900 Active 139 DOM
-
2026-05-31days on market $67,900 Active 138 DOM
-
2026-05-30days on market $67,900 Active 137 DOM
-
2026-02-03price $67,900
-
2026-01-13$77,900 Active
-
1992-06-08soldstatus $12,000
-
1992-02-12$19,900
ⓘ Source: listings_history table (triggers on properties + properties_extension) + one-shot
backfill from property_details.listing_events for pre-trigger history.
Tax reassessment forecast OH · Partial reset (capped growth)
- Current annual tax
- $417 · $35/mo
- Projected year-2 tax
- $738 · $61/mo
- Expected delta
- +$321/yr (+$27/mo · 77.1%)
ⓘ Screening estimate from a state-policy table — verify with the county assessor before closing.
Climate risk First Street
- Flood 1/10 Low FEMA zone X (unshaded) · 0% chance over 30 yrs
- Wildfire 1/10 Low
- Heat 3/10 Moderate 7 d/yr ≥97°F today · 17 d/yr by 30 yrs out
- Wind 1/10 Low
- Air quality 2/10 Low 1 unhealthy d/yr today · 2 by 30 yrs out
Nearby sold comps map
Loading sold comps map…
Walkable amenities ~0.75 mi
Loading nearby amenities…
Taxation est. · year 1
- Rental income
- $13,885
- − Mortgage interest
- −$3,803
- − Property taxes
- −$417
- − Insurance
- −$340
- − Repairs & maintenance
- −$1,111
- − Management
- −$1,111
- − Depreciation
- −$1,975
- Taxable income
- $5,129
- Est. tax owed @ 24.0%
- −$1,231
- After-tax cash flow
- $4,709/yr
For passive investors: Depreciation is non-cash, so a rental often shows a tax loss while cash-flowing — sheltering income. Rental losses are passive: they offset passive income freely, and up to $25,000/yr can offset ordinary (W-2) income if you actively participate and your MAGI is under $100k (phasing out to $0 by $150k); unused losses carry forward. On sale, claimed depreciation is recaptured at up to 25%, and gains may owe capital-gains tax (a 1031 exchange can defer both). Figures are a year-1 estimate at your 24.0% rate — not tax advice; consult a CPA.
Schools (NCES district)
- District
- Youngstown City
- NCES district ID
- 3904516
- Math proficiency
- 8% ▼ -15.00%
- Reading proficiency
- 17% ▼ -10.00%
- Median HH income
- $25,257
- Composite
- 9.29/100
- National rank
- #9858
- State rank
- #649 of 656 in OH
Livability — Youngstown
- Score
- 81/100
- State rank
- #99
- US rank
- #1506
Category grades
Schools grade is shown separately in the Schools card above.
Census & demographics
- Census place
- Youngstown, OH
- County
- Mahoning · 224,175 people
- City population
- 28,503
- Metro
- Youngstown-Warren, OH
- Population (ZIP)
- 4,402
- Household income
- $25,767
- Rent vs Own
- Severe rent burden
- 17.1
Population outlook (Mahoning County) Hauer SSP2
- Today (2025)
- 223,932 people
- By 2030
- 218,387 · -2.5%
- By 2040
- 205,367 · -8.3%
- By 2050
- 193,606 · -13.5%
- By 2075
- 173,694 · -22.4%
- By 2100
- 151,147 · -32.5%
Race, ethnicity, and origin ACS 2023
- Neighborhood character
- Diverse neighborhood (Simpson 0.58)
- Race & ethnicity
- Black 60% White 20% Hispanic / Latino 12% Two or more races 10%
- Hispanic origin (detail)
- Puerto Rican 10%
- Common ancestry
- Subsaharan African 2% Hispanic 2% Romanian 1%
- Foreign-born
- 3% · Canada
- Languages at home
- 89% English-only · Spanish 10%
Political lean MEDSL · Mahoning
- 2024 margin
- Lean R (+9.4) · D 44.9% · R 54.4%
- 2008→2024 swing
- -36.1pp toward R · 2008: 26.6pp · 2024: -9.4pp
- All cycles
- 2024: R+9.4 2020: R+1.9 2016: D+3.0 2012: D+27.7 2008: D+26.6
Not yet ingested
- Civics
- —
Market trends
- HPI YoY
- ▼ -0.83%
- Current HPI
- 282.496
- Rent YoY
- —
- Metro
- —
- State GDP YoY
- ▲ 1.98%
- F500 in state
- 48
Industry mix (Fortune 500 HQ in OH)
| Industry | F500 HQs | Revenue |
|---|---|---|
| Insurance | 3 | $145B |
|
||
| Industrial Machinery | 3 | $49B |
|
||
| Financial Services | 3 | $24B |
|
||
| Consumer Goods | 2 | $93B |
|
||
| Aerospace / Defense | 2 | $47B |
|
||
| Utilities | 2 | $33B |
|
||
Price history
+241.2% since first listed4 events — show timeline
- 2026-02-03 Price Changed $67,900 MLSNOW
- 2026-01-13 Listed $77,900 MLSNOW
- 1992-06-08 Sold (Public Records) $12,000 Public Records
- 1992-02-12 Listed $19,900 MLSNOW
Property tax history
+1.9%/yrLatest (2025): $417 · -11.8% YoY. Source: county tax records.
Cash-flow waterfall
monthlySold comps — $/sqft
last 12 mo · ≤1 miLoading sold comps…