320 Liliuokalani Ave #804 · Urban Honolulu, HI
Flood risk 8/10 · Major
- FEMA flood zone
- AE
- Chance of flooding over 30 yrs
- 0.99%
- Est. flood insurance / yr
- $1,737 – $8,500
Fire risk No data
- Est. fire insurance / yr
- —
Heat risk No data
- Hot days now (above threshold)
- —
- Hot days in 30 yrs
- —
Wind risk No data
- Chance of severe wind over 30 yrs
- —
Air-quality risk 1/10 · Minimal
- Unhealthy air days now
- —
- Unhealthy air days in 30 yrs
- —
Risk factors via First Street. Map © Google.
Why this score? — see what drove the D grade
The composite is a weighted blend of 9 inputs, each scored 0–100. Each bar is that input's sub-score; the figure is the points it added to the 100-point composite (weight × sub-score).
- ARV discount +15.0/15.0
- Appreciation +6.4/10.0
- 1% rule +6.3/10.0
- Cash flow +4.7/30.0
- Rent growth +4.0/5.0
- Schools +3.7/10.0
- Livability +2.5/5.0
- Condition / age +2.5/5.0
- DSCR +0.0/10.0
$235,000
🖨 Deal sheet 📄 Offer letter ✓ Due diligence
Listing remarks MLS
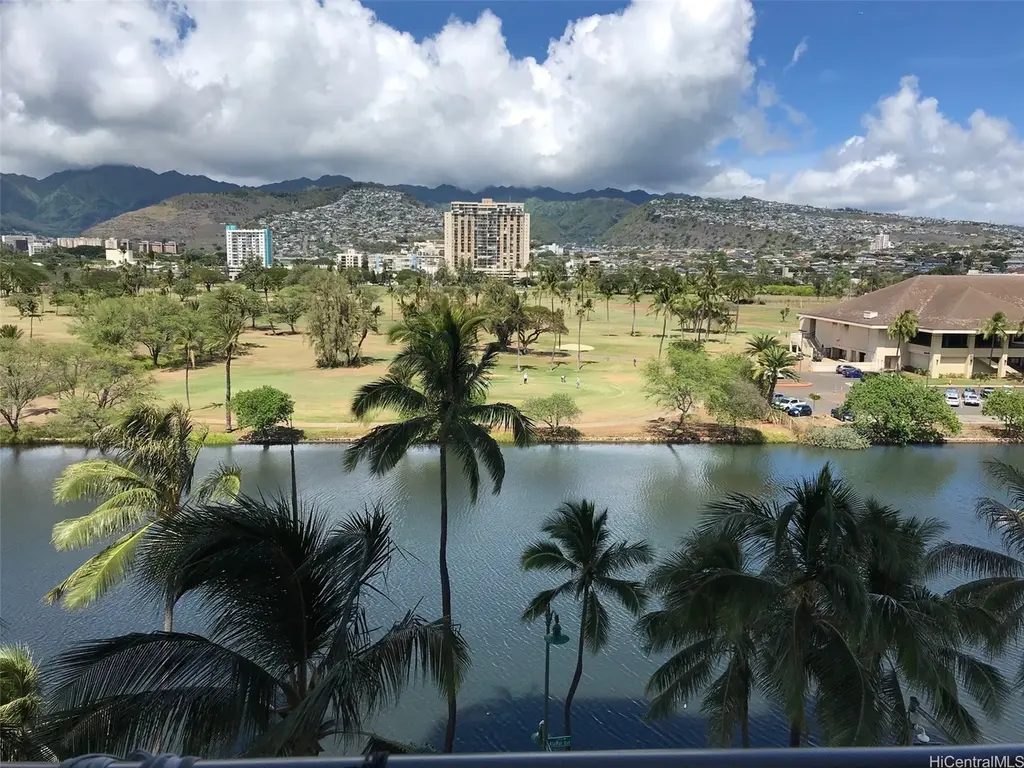
Monte Vista is a high rise building reminiscent of Old Hawaii and Waikiki but with modern conveniences. SELLER FINANCING. 100% HURRICANE INSURED. FULLY FURNISHED AND APPOINTED 2 bedroom 1.5 bathroom 1 parking stall WASHER DRYER has it all. FOREVER UNOBSTRUCTED VIEWS of the Ala Wai , Golf Course and Mountains. Breezy. Sunny Air Conditioning, PARKING, FULLKITCHEN, POOL on Property. Site Manager. ONLY 2 BLOCKS to OCEAN ACTIVITIES AND WORLD FAMOUS WAIKIKI BEACH, SHOPS GALORE AND EATERIES TOO! LEASEHOLD TO 2042 and the FEE is AVAILABLE ($200,000). BUNDLE YOUR LEASE WITH THE FEE AND CLOSE IN FEE SIMPLE! or GET YOUR FOOT IN THE DOOR WITH VALUES CONSTANTLY INCREASEING AND BUY THE FEE LATER. MEW MARBELESQUE FLOORING. MOVE RIGHT IN! OR rent MINIMUM 30 DAY RENTALS ITS ALL HERE FOR YOU TO ENJOY THE HAWAII LIFESTYLE.
Key facts
- Pool on property
- Full kitchen
- Unobstructed views
Tags
Neighborhood map
What this means for you Summary
Snapshot
- This is a 2-bed/1.0-bath condo listed at $235k.
Deal economics
- At list price, monthly cash flow is $-1k ($-12k/yr) — negative.
- To cash-flow at today's rent, offer at most $55k (76.4% below list).
- Meets the 1% rule at list price ($3k rent vs $235k).
- Recommended offer: $55k (76.4% below list) — sets the bar for cash-flow.
- Cap rate 3.3% vs local median 1.5% in Urban Honolulu — top-decile yield for the area; either an underpriced asset or a hidden risk that comps aren't pricing in. Stress-test before assuming the spread holds.
Location & tenants
- Location reads: area grade D — affects rentability + tenant quality, not the cash-flow math above.
- Hawaii Department Of Education (suburban): math 32% / reading 50% proficiency, ranked #1 of 1 in HI (top 100%) — families likely to look elsewhere, expect single-tenant / working-renter base with shorter leases.
- Market conditions: Rents rising fast (+6.0%/yr); 814 active listings in the ZIP; 40 comparable units currently listed for rent nearby; rentals at typical pace (median 24d on market — plan ~3-4 weeks tenant-placement turnaround); solid renter incomes; 1,638 units permitted in Honolulu County in 2024 (793 in 5+ unit buildings).
- This rent runs 41% of the median local income ($77k/yr) — at the standard rent-burdened threshold; future hikes will face affordability resistance.
Forward outlook
- In year one you build about $8k of equity ($2k loan paydown + $6k appreciation (2.7% local appreciation)).
- Honolulu County population projected at +17% by 2050 — long-run rental-demand tailwind backs the buy-and-hold thesis.
- By year 5, paydown + projected appreciation supports a ~$35k cash-out refi (75% LTV) — recoverable capital for the next deal without selling this one.
Negotiation context
- It's been on market 587 days — a 12% lower offer ($207k) is reasonable based on typical stale-listing flexibility.
- 5 sale attempts since 12y ago; this cycle's ask has dropped $40k (15%) from the opening price — seller is motivated, your offer sets the floor, not the list.
Risks & watch-outs
- Watch-outs: flood insurance adds $427/mo; HOA is 46% of rent.
- Climate carrying-cost: in FEMA flood zone AE (mandatory federal flood insurance) — expect insurance premiums to compound above CPI over the hold.
Questions for the listing agent
- What do current leases actually rent for vs. the listed asking? Can we see a recent rent roll and the last 12 months of T-12 income?
- It's been on market 587 days. Have you received any prior offers? Is the seller open to a 76% concession, seller financing, or rate buy-down credit?
- Built in 1978 — when were the roof, HVAC, electrical panel, plumbing, and water heater last replaced?
- What's the actual annual flood-insurance premium (NFIP or private), and is the property in a SFHA with mandatory coverage?
- What does the HOA fee cover, when was the last increase, and are there any pending special assessments or reserve-fund shortfalls?
- Any open or pending special assessments — roof, HVAC, plumbing, elevator, façade? What's the per-unit balance and payoff schedule, and is the seller paying it off at close or rolling it to the buyer?
- Why hasn't it sold? Are there any deal-killer items the seller is aware of (foundation, flood, title, zoning, code violations)?
- Is there a deadline driving the sale (1031 exchange, divorce, estate, relocation)? That informs how much negotiation room exists.
- The area grade is low — what's the realistic commute time and amenity access for the typical tenant pool here? Any planned neighborhood developments (good or bad) we should know about?
- What's the average days-on-market for RENTAL listings here right now (not sales)? A rising rental-DOM trend means longer vacancies and softer asking-rent achievability than the comps imply.
- What's the recent tenant-quality profile in this submarket — average credit score on applications, eviction rate, late-payment / NSF rate, and stable-employment percentage? A property-management company in the area should have these aggregated.
- How much new apartment / multifamily construction is in the pipeline within 1–3 miles? Heavy new supply (>2% of stock underway) typically softens rents 12–24 months out; light construction supports rent growth.
Investment metrics
- 1% rule
- 1.13% ✓
- Cap rate
- 3.28%
- Cash-on-cash
- -10.76%
- DSCR
- 0.52
- GRM
- 7.4
CMA / ARV
- ARV (median comp)
- $313,956
- List price
- $235,000
- Delta
- -25.15%
- Verdict
- UNDERPRICED
- Comps
- 20 within 1.0 mi
Projected returns pro-forma
2.74% appreciation · 6.0% rent growth · sell at horizon
- IRR
- -7.9%
- Equity multiple
- 0.54×
- Total profit
- $-30,430
- Equity at exit
- $102,280
- IRR
- 0.1%
- Equity multiple
- 1.02×
- Total profit
- $1,502
- Equity at exit
- $155,043
Cash invested: $65,800 (down + closing). Projections, not guarantees.
Landlord ↔ Tenant lean methodology
- Overall (STATE)
- 37 Tenant-Leaning
- State Hawaii
- 37 Tenant-Leaning · D+13
- County
- — inherits STATE
- City
- — inherits STATE
ZIP-level market 96815
- Home prices YoY
- 0.9%
- Rents YoY
- 6.0%
- Active inventory
- 814
- Price-to-rent
- 7.4×
Monthly cashflow live
- Estimated rent
- $2,645 high interval (Pro) →
- Mortgage (P&I)
- −$1,232
- Tax from tax record
- −$129 /mo · $1,545/yr
- Insurance
- −$98
- Flood insurance flood zone
- −$427 /mo · $5,118/yr
- HOA
- −$1,220
- Vacancy / Maint / Mgmt
- −$555
- Net cashflow
- $-1,016
Break-even live
UW: 25.0% down · 7.5% · 30yr · 1.5% tax · 5.0% vac · 8.0% maint · 8.0% mgmt
Financing live
Cash to close
- Down payment
- $58,750
- Closing costs
- $7,050
- Reserves months
- —
- Total cash needed
- —
Loan-product check · same deal, 3 products live
Conventional
25% down · 7.5% · 30yr
- Down + closing
- —
- Monthly P&I
- —
- Monthly cashflow
- —
- DSCR
- —
- Eligible?
- —
Personal DTI + credit; lowest rate.
DSCR
20% down · 8.5% · 30yr
- Down + closing
- —
- Monthly P&I
- —
- Monthly cashflow
- —
- DSCR
- —
- Eligible?
- —
No personal income docs; deal must DSCR.
Hard money
10% down · 12.0% · 12mo
- Down + closing
- —
- Monthly P&I
- —
- Monthly cashflow
- —
- DSCR
- —
- Eligible?
- —
Short-term bridge; refi at stabilization.
Rent comps 40 comps
| Address | Beds | Baths | Sqft | Rent | $/sqft | DOM | Units | Dist |
|---|---|---|---|---|---|---|---|---|
| 320 Liliuokalani Ave Honolulu, HI | 2.0 | 1.0–1.5 | 762 | $3,000 | $3.94 | 20d | 1 | 0.01mi |
| 2503 Ala Wai Blvd Unit C Honolulu, HI | 1.0 | 1.0 | 400 | $1,670 | $4.17 | 17d | 1 | 0.02mi |
| 2452 Tusitala St Unit 1327721P Honolulu, HI | 1.0 | 1.0 | 592 | $2,960 | $5.00 | 2d | 1 | 0.05mi |
| 2452 Tusitala St Honolulu, HI | 1.0 | 1.0 | 558 | $3,000 | $5.38 | 3d | 1 | 0.05mi |
| 240 Liliuokalani Ave #301 Honolulu, HI | 1.0 | 1.0 | 600 | $2,200 | $3.67 | 17d | 1 | 0.06mi |
| 240 Liliuokalani Ave Unit 401 Honolulu, HI | 1.0 | 1.0 | 600 | $2,000 | $3.33 | 44d | 1 | 0.06mi |
| 236 Liliuokalani Ave Honolulu, HI | 1.0 | 1.0 | 490 | $2,375 | $4.85 | 17d | 1 | 0.07mi |
| 225 Liliuokalani Ave Unit 2A Honolulu, HI | 1.0 | 1.0 | 680 | $1,800 | $2.65 | 20d | 1 | 0.10mi |
| 2421 Tusitala St Honolulu, HI | 1.0–2.0 | 1.0 | 590 | $2,849 | $4.83 | 44d | 2 | 0.11mi |
| 2421 Tusitala St #902 Honolulu, HI | 2.0 | 1.0 | 590 | $2,775 | $4.70 | 12d | 1 | 0.11mi |
| 2440 Khi Ave Unit 1608 Honolulu, HI | 1.0 | 1.0 | 488 | $2,800 | $5.74 | 44d | 1 | 0.12mi |
| 2440 Khi AVE Unit 511 Honolulu, HI | 1.0 | 1.0 | 488 | $2,400 | $4.92 | 23d | 1 | 0.13mi |
| 2440 Khi AVE Unit 1412 Honolulu, HI | 1.0 | 1.0 | 536 | $2,700 | $5.04 | 44d | 1 | 0.13mi |
| 2440 Khi AVE Unit 1710 Honolulu, HI | 1.0 | 1.0 | 488 | $2,600 | $5.33 | 17d | 1 | 0.13mi |
| 2440 Khi AVE Unit 601 Honolulu, HI | 1.0 | 1.0 | 537 | $2,200 | $4.10 | 3d | 1 | 0.13mi |
| 2440 Khi AVE Unit 507 Honolulu, HI | 1.0 | 1.0 | 488 | $2,350 | $4.82 | 44d | 1 | 0.13mi |
| 2440 Khi AVE Unit 511 Honolulu, HI | 1.0 | 1.0 | 488 | $2,400 | $4.92 | 44d | 1 | 0.13mi |
| 2440 Khi AVE Unit 601 Honolulu, HI | 1.0 | 1.0 | 537 | $2,200 | $4.10 | 23d | 1 | 0.13mi |
| 2415 Ala Wai Blvd Honolulu, HI | 1.0–2.0 | 1.0 | 665 | $3,500 | $5.26 | 17d | 3 | 0.13mi |
| 2415 Ala Wai Blvd #1802 Honolulu, HI | 1.0 | 1.0 | 560 | $3,000 | $5.36 | 44d | 1 | 0.13mi |
| 2410 Cleghorn St #2403 Honolulu, HI | 1.0 | 1.0 | 602 | $2,500 | $4.15 | 23d | 1 | 0.14mi |
| 2423 Cleghorn St #204 Honolulu, HI | 2.0 | 1.0 | 600 | $1,595 | $2.66 | 23d | 1 | 0.14mi |
| 300 Wai Nani Way Unit 302 Honolulu, HI | 1.0 | 1.0 | 620 | $2,700 | $4.35 | 23d | 1 | 0.14mi |
| 2407 Tusitala St Unit 304 Honolulu, HI | 1.0 | 1.0 | 480 | $1,500 | $3.12 | 44d | 1 | 0.15mi |
| 201 Ohua Ave Unit 1112 Honolulu, HI | 1.0 | 1.0 | 533 | $2,300 | $4.32 | 21d | 1 | 0.16mi |
| 201 Ohua Ave Unit 3704-1 Honolulu, HI | 1.0 | 1.0 | 557 | $2,700 | $4.85 | 44d | 1 | 0.16mi |
| 300 Wai Nani Way Unit 2203 Honolulu, HI | 1.0 | 1.0 | 570 | $2,700 | $4.74 | 44d | 1 | 0.17mi |
| 232 Kaiulani Ave Honolulu, HI | 3.0 | 1.0 | 656 | $4,225 | $6.44 | 23d | 8 | 0.18mi |
| 417 Kanekapolei St Honolulu, HI | 1.0 | 1.0 | 566 | $1,695 | $2.99 | 44d | 1 | 0.21mi |
| 2600 Pualani Way #3003 Honolulu, HI | 1.0 | 1.0 | 625 | $3,200 | $5.12 | 17d | 1 | 0.21mi |
| 2600 Pualani Way #1404 Honolulu, HI | 1.0 | 1.0 | 625 | $2,600 | $4.16 | 3d | 1 | 0.21mi |
| 2611 Ala Wai Blvd #2006 Honolulu, HI | 1.0 | 1.0 | 598 | $2,400 | $4.01 | 44d | 1 | 0.23mi |
| 2380 Kuhio Ave Honolulu, HI | 3.0 | 1.0–3.0 | 1212 | $10,275 | $8.47 | 1d | 51 | 0.24mi |
| 2345 Ala Wai Blvd #1514 Honolulu, HI | 1.0 | 1.0 | 555 | $2,800 | $5.05 | 23d | 1 | 0.28mi |
| 2572 Lemon Rd Honolulu, HI | 1.0 | 1.0 | 398 | $2,597 | $6.53 | 3d | 3 | 0.32mi |
| 2281 Ala Wai Blvd #902 Honolulu, HI | 2.0 | 1.0 | 609 | $3,950 | $6.49 | 14d | 1 | 0.39mi |
| 445 Seaside Ave #2220 Honolulu, HI | 1.0 | 1.0 | 570 | $2,625 | $4.61 | 12d | 1 | 0.40mi |
| 3124 Brokaw St Unit 98502H Honolulu, HI | 1.0 | 1.0 | 400 | $1,675 | $4.19 | 17d | 1 | 0.45mi |
| 3320 Campbell Ave Apt 201 Honolulu, HI | 2.0 | 1.0 | 700 | $2,000 | $2.86 | 44d | 1 | 0.51mi |
| 3353 Campbell Ave #4 Honolulu, HI | 1.0 | 1.0 | 504 | $1,450 | $2.88 | 44d | 1 | 0.51mi |
HOA detail condo
- Monthly dues
- $1,220 · $14,640/yr
- Likely covers
- pool
- Assessments
- None detected in remarks — confirm with the listing agent.
Listing history 35 events
-
2026-06-18days on market $235,000 Active 587 DOM
-
2026-06-17days on market $235,000 Active 586 DOM
-
2026-06-15days on market $235,000 Active 584 DOM
-
2026-06-13days on market $235,000 Active 582 DOM
-
2026-06-13days on market $235,000 Active 581 DOM
-
2026-06-10days on market $235,000 Active 579 DOM
-
2026-06-09days on market $235,000 Active 578 DOM
-
2026-06-08days on market $235,000 Active 577 DOM
-
2026-06-07days on market $235,000 Active 576 DOM
-
2026-06-05days on market $235,000 Active 573 DOM
-
2026-06-03days on market $235,000 Active 572 DOM
-
2026-06-02days on market $235,000 Active 571 DOM
-
2026-06-01days on market $235,000 Active 570 DOM
-
2026-05-31days on market $235,000 Active 569 DOM
-
2025-08-28price $235,000 823-char remark
Show marketing remark (823 chars)
Monte Vista is a high rise building reminiscent of Old Hawaii and Waikiki but with modern conveniences. SELLER FINANCING. 100% HURRICANE INSURED. FULLY FURNISHED AND APPOINTED 2 bedroom 1.5 bathroom 1 parking stall WASHER DRYER has it all. FOREVER UNOBSTRUCTED VIEWS of the Ala Wai , Golf Course and Mountains. Breezy. Sunny Air Conditioning, PARKING, FULLKITCHEN, POOL on Property. Site Manager. ONLY 2 BLOCKS to OCEAN ACTIVITIES AND WORLD FAMOUS WAIKIKI BEACH, SHOPS GALORE AND EATERIES TOO! LEASEHOLD TO 2042 and the FEE is AVAILABLE ($200,000). BUNDLE YOUR LEASE WITH THE FEE AND CLOSE IN FEE SIMPLE! or GET YOUR FOOT IN THE DOOR WITH VALUES CONSTANTLY INCREASEING AND BUY THE FEE LATER. MEW MARBELESQUE FLOORING. MOVE RIGHT IN! OR rent MINIMUM 30 DAY RENTALS ITS ALL HERE FOR YOU TO ENJOY THE HAWAII LIFESTYLE.
-
2024-11-08$275,000 Active 823-char remark
Show marketing remark (823 chars)
Monte Vista is a high rise building reminiscent of Old Hawaii and Waikiki but with modern conveniences. SELLER FINANCING. 100% HURRICANE INSURED. FULLY FURNISHED AND APPOINTED 2 bedroom 1.5 bathroom 1 parking stall WASHER DRYER has it all. FOREVER UNOBSTRUCTED VIEWS of the Ala Wai , Golf Course and Mountains. Breezy. Sunny Air Conditioning, PARKING, FULLKITCHEN, POOL on Property. Site Manager. ONLY 2 BLOCKS to OCEAN ACTIVITIES AND WORLD FAMOUS WAIKIKI BEACH, SHOPS GALORE AND EATERIES TOO! LEASEHOLD TO 2042 and the FEE is AVAILABLE ($200,000). BUNDLE YOUR LEASE WITH THE FEE AND CLOSE IN FEE SIMPLE! or GET YOUR FOOT IN THE DOOR WITH VALUES CONSTANTLY INCREASEING AND BUY THE FEE LATER. MEW MARBELESQUE FLOORING. MOVE RIGHT IN! OR rent MINIMUM 30 DAY RENTALS ITS ALL HERE FOR YOU TO ENJOY THE HAWAII LIFESTYLE.
-
2024-09-26historical
-
2023-08-26$295,000 Active
-
2023-07-17historical
-
2023-05-11price $295,000
-
2023-03-13price $300,000
-
2022-09-13$350,000 Active
-
2014-07-31soldstatus $239,000
-
2014-06-01historical
-
2014-03-26$239,000
-
2014-03-17historical
-
2014-01-21$239,000
-
2003-06-03soldstatus $162,500
-
2003-06-03soldstatus $162,500
-
1997-03-14soldstatus $37,800
-
1981-02-02soldstatus $114,000
-
1981-02-01soldstatus $114,000
-
1979-07-01soldstatus $95,000
-
1979-07-01soldstatus $105,000
-
1979-01-01soldstatus $77,000
ⓘ Source: listings_history table (triggers on properties + properties_extension) + one-shot
backfill from property_details.listing_events for pre-trigger history.
Tax reassessment forecast HI · Partial reset (capped growth)
- Current annual tax
- $1,545 · $129/mo
- Projected year-2 tax
- $1,545 · $129/mo
- Expected delta
- $0/yr ($0/mo · 0.0%)
ⓘ Screening estimate from a state-policy table — verify with the county assessor before closing.
Climate risk First Street
- Flood 8/10 Severe FEMA zone AE · 99% chance over 30 yrs
- Air quality 1/10 Low
Nearby sold comps map
Loading sold comps map…
Walkable amenities ~0.75 mi
Loading nearby amenities…
Taxation est. · year 1
- Rental income
- $31,736
- − Mortgage interest
- −$13,164
- − Property taxes
- −$1,545
- − Insurance
- −$6,294
- − Repairs & maintenance
- −$2,539
- − Management
- −$2,539
- − HOA
- −$14,640
- − Depreciation
- −$6,836
- Taxable loss
- −$15,820
- Est. tax savings @ 24.0%
- +$3,797
- After-tax cash flow
- $-8,399/yr
For passive investors: Depreciation is non-cash, so a rental often shows a tax loss while cash-flowing — sheltering income. Rental losses are passive: they offset passive income freely, and up to $25,000/yr can offset ordinary (W-2) income if you actively participate and your MAGI is under $100k (phasing out to $0 by $150k); unused losses carry forward. On sale, claimed depreciation is recaptured at up to 25%, and gains may owe capital-gains tax (a 1031 exchange can defer both). Figures are a year-1 estimate at your 24.0% rate — not tax advice; consult a CPA.
Schools (NCES district)
- District
- Hawaii Department Of Education
- NCES district ID
- 1500030
- Math proficiency
- 32% ▼ -10.00%
- Reading proficiency
- 50% ▼ -3.00%
- Median HH income
- $69,005
- Composite
- 37.07/100
- National rank
- #4504
- State rank
- #1 of 1 in HI
Livability — Urban Honolulu
No livability data for this city. (Only ~50 U.S. cities are tracked.)
Census & demographics
- Census place
- Urban Honolulu, HI
- County
- Honolulu County · 963,448 people
- City population
- 309,956
- Metro
- Urban Honolulu, HI
- Population (ZIP)
- 27,530
- Household income
- $77,096
- Rent vs Own
- Severe rent burden
- 2422.0
Population outlook (Honolulu County) Hauer SSP2
- Today (2025)
- 1,072,641 people
- By 2030
- 1,110,460 · +3.5%
- By 2040
- 1,181,593 · +10.2%
- By 2050
- 1,257,584 · +17.2%
- By 2075
- 1,501,120 · +39.9%
- By 2100
- 1,764,430 · +64.5%
Race, ethnicity, and origin ACS 2023
- Neighborhood character
- Highly diverse neighborhood (Simpson 0.71)
- Race & ethnicity
- Asian 41% White 35% Two or more races 16% Hispanic / Latino 6% Pacific Islander 4% Black 2%
- Hispanic origin (detail)
- Mexican 3% Puerto Rican 1%
- Common ancestry
- Romanian 2% Lithuanian 2% Slovak 2%
- Foreign-born
- 30% · China, South Korea, Canada
- Languages at home
- 66% English-only · Other Asian/Pacific 15% Chinese 5% Korean 3%
Political lean MEDSL · Honolulu
- 2024 margin
- Strong D (+21.6) · D 59.9% · R 38.3% · Other 1.8%
- 2008→2024 swing
- -19.4pp toward R · 2008: 41.1pp · 2024: 21.6pp
- All cycles
- 2024: D+21.6 2020: D+26.9 2016: D+29.9 2012: D+39.1 2008: D+41.1
Not yet ingested
- Civics
- —
Market trends
- HPI YoY
- ▲ 2.74%
- Current HPI
- 291.9404
- Rent YoY
- ▲ 6.00%
- Metro
- Urban Honolulu, HI
- State GDP YoY
- —
- F500 in state
- 0
Price history
+205.2% since first listed21 events — show timeline
- 2025-08-28 Price Changed $235,000 HiCentral MLS
- 2024-11-08 Listed $275,000 HiCentral MLS
- 2024-09-26 Listing Removed — HiCentral MLS
- 2023-08-26 Listed $295,000 HiCentral MLS
- 2023-07-17 Listing Removed — HiCentral MLS
- 2023-05-11 Price Changed $295,000 HiCentral MLS
- 2023-03-13 Price Changed $300,000 HiCentral MLS
- 2022-09-13 Listed $350,000 HiCentral MLS
- 2014-07-31 Sold (Public Records) $239,000 Public Records
- 2014-06-01 Listing Removed — HiCentral MLS
- 2014-03-26 Listed $239,000 HiCentral MLS
- 2014-03-17 Listing Removed — HiCentral MLS
- 2014-01-21 Listed $239,000 HiCentral MLS
- 2003-06-03 Sold (Public Records) $162,500 Public Records
- 2003-06-03 Sold (Public Records) $162,500 Public Records
- 1997-03-14 Sold (Public Records) $37,800 Public Records
- 1981-02-02 Sold (Public Records) $114,000 Public Records
- 1981-02-01 Sold (Public Records) $114,000 Public Records
- 1979-07-01 Sold (Public Records) $105,000 Public Records
- 1979-07-01 Sold (Public Records) $95,000 Public Records
- 1979-01-01 Sold (Public Records) $77,000 Public Records
Property tax history
+3.2%/yrLatest (2022): $1,545 · +11.9% YoY. Source: county tax records.
Cash-flow waterfall
monthlySold comps — $/sqft
last 12 mo · ≤1 miLoading sold comps…