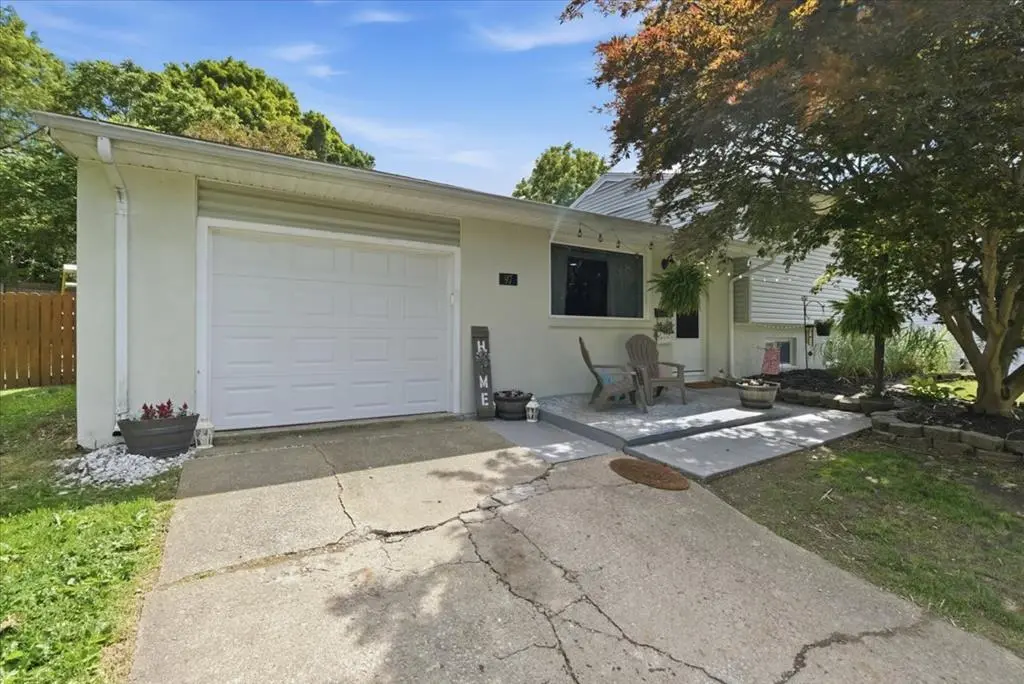
97 Templeton Ter · Lexington, OH
Flood risk 1/10 · Minimal
- FEMA flood zone
- X (unshaded)
- Chance of flooding over 30 yrs
- 0.0%
- Est. flood insurance / yr
- $473 – $860
Fire risk 1/10 · Minimal
- Est. fire insurance / yr
- $713 – $1,323
Heat risk 3/10 · Minor
- Hot days now (above 97°F)
- 7 days/yr
- Hot days in 30 yrs
- 17 days/yr
Wind risk 2/10 · Minimal
- Chance of severe wind over 30 yrs
- —
Air-quality risk 2/10 · Minimal
- Unhealthy air days now
- 1 days/yr
- Unhealthy air days in 30 yrs
- 1 days/yr
Risk factors via First Street. Map © Google.
Why this score? — see what drove the D+ grade
The composite is a weighted blend of 9 inputs, each scored 0–100. Each bar is that input's sub-score; the figure is the points it added to the 100-point composite (weight × sub-score).
- ARV discount +12.9/15.0
- Cash flow +12.6/30.0
- Schools +6.3/10.0
- Livability +3.9/5.0
- DSCR +3.8/10.0
- 1% rule +3.3/10.0
- Rent growth +2.5/5.0
- Condition / age +2.5/5.0
- Appreciation +0.0/10.0
$194,900
🖨 Deal sheet 📄 Offer letter ✓ Due diligence
Listing remarks MLS
Centrally located in the heart of Lexington is this adorable 3 level split home. Tastefully decorated complete with new cabinets, granite countertops and stainless steel appliances. Central air along with a spacious lower level rec room complete with a fireplace for this cozy winter evenings. Some of the recent updates include bamboo flooring, updated kitchen and backsplash, recessed lighting, fire pit & patio. Walk to the Blueberry Festival, parks, bark trail and school from this great location.
Key facts
- Open-concept kitchen
- Rec room
- Concrete patio
Tags
Property features AI
Exterior
- Parking: Attached garage (1 car)
- Utilities: Public water; Public sewer
- Home design: Residential single-family home
- Construction: Stucco and vinyl siding exterior; Composition roof; Has basement
- Exterior features: Fenced yard; Located on a cul-de-sac; Concrete parking surfaces
Interior
- Kitchen: Dishwasher; Range; Microwave; Refrigerator
- Bathrooms: 1 full bathroom; 9 half bathrooms
- Heating & cooling: Central air conditioning; Forced air heating with natural gas
- Interior features: Eat-in kitchen; Crawl space and partially finished basement; Fireplace in recreation room
- Laundry & utility: Washer; Dryer
Neighborhood map
What this means for you Summary
Snapshot
- This is a 3-bed/1.0-bath single-family listed at $195k.
Deal economics
- At list price, monthly cash flow is $-24 ($-293/yr) — negative.
- To cash-flow at today's rent, offer at most $191k (2.2% below list).
- To meet the 1% rule (rent ≥ 1% of price), the offer needs to be $163k (16.6% below list).
- Recommended offer: $163k (16.6% below list) — sets the bar for 1% rule.
- Cap rate 6.1% vs local median 4.4% in Lexington — top-decile yield for the area; either an underpriced asset or a hidden risk that comps aren't pricing in. Stress-test before assuming the spread holds.
Location & tenants
- Location reads 77/100 on livability (#198 in OH, #3,037 nationally) — a middle-class / working-renter tenant base. Strengths: schools A+, cost of living A+, housing A+; Watch: amenities D-, commute F.
- Lexington Local (suburban): math 72% / reading 75% proficiency, ranked #113 of 656 in OH (top 17%) — strong family-tenant draw, lease renewals of 3-5y typical.
- Market conditions: 62 active listings in the ZIP; 1 comparable units currently listed for rent nearby; 145 units permitted in Richland County in 2024 (0 in 5+ unit buildings).
- This rent runs 31% of the median local income ($62k/yr) — at the standard rent-burdened threshold; future hikes will face affordability resistance.
Forward outlook
- Local home prices are declining (-3.0%/yr); year-one equity from $1k of loan paydown is wiped out by about $6k of value loss. Plan a longer hold.
- Richland County population projected at -18% by 2050 — secular population decline; favor cash flow + early exit over multi-decade hold.
Negotiation context
- Only 3 days on market — expect competitive offers; lowballing is unlikely to land.
- 3 sale attempts since 12y ago with the ask held roughly flat each time — persistent listings suggest the price (not the market) is what's stuck; bring a comps-based counter.
- Current owner paid $124k; list at $195k implies a 57% gain — meaningful room to come down on a strong offer.
Questions for the listing agent
- What do current leases actually rent for vs. the listed asking? Can we see a recent rent roll and the last 12 months of T-12 income?
- Built in 1961 — when were the roof, HVAC, electrical panel, plumbing, and water heater last replaced?
- Is there a deadline driving the sale (1031 exchange, divorce, estate, relocation)? That informs how much negotiation room exists.
- Schools are A-rated — typically a magnet for longer-tenancy family renters. What's the average tenant stay here, and is there a school-zone premium baked into asking?
- The area grade is low — what's the realistic commute time and amenity access for the typical tenant pool here? Any planned neighborhood developments (good or bad) we should know about?
- What's the average days-on-market for RENTAL listings here right now (not sales)? A rising rental-DOM trend means longer vacancies and softer asking-rent achievability than the comps imply.
- What's the recent tenant-quality profile in this submarket — average credit score on applications, eviction rate, late-payment / NSF rate, and stable-employment percentage? A property-management company in the area should have these aggregated.
- How much new for-sale + rental construction is in the pipeline within 1–3 miles? Heavy new supply typically softens prices + rents 12–24 months out; constrained supply supports both.
Investment metrics
- 1% rule
- 0.83% ✗
- Cap rate
- 6.14%
- Cash-on-cash
- -0.54%
- DSCR
- 0.98
- GRM
- 10.0
CMA / ARV
- ARV (on-the-fly)
- $221,728
- Comps found
- 12
Show comp detail 12 sales within ~0.75 mi
| Address | Dist | Beds/Ba | Sqft | Sold | Price | $/sf | Match |
|---|---|---|---|---|---|---|---|
| 72 Grange | 0.20mi | 3/1.0 | 1,302 (-1%) | 3mo | $159,000 | $122 | 87 |
| 23 Pembroke Blvd | 0.22mi | 3/2.0 | 1,260 (-4%) | 1mo | $245,000 | $194 | 78 |
| 80 Essex Cir | 0.27mi | 3/1.5 | 1,234 (-6%) | 1mo | $209,000 | $169 | 75 |
| 45 Maple St | 0.16mi | 3/1.5 | 1,197 (-9%) | 3mo | $182,500 | $152 | 74 |
| 80 Essex Rd | 0.32mi | 3/1.5 | 1,235 (-6%) | 1mo | $209,000 | $169 | 72 |
| 77 Frederick St | 0.27mi | 4/2.0 (+1) | 1,380 (+5%) | 2mo | $160,000 | $116 | 68 |
| 235 Hanover Rd | 0.47mi | 3/1.5 | 1,276 (-3%) | 6mo | $206,000 | $161 | 66 |
| 45 Clever Ln | 0.40mi | 4/2.0 (+1) | 1,332 (+2%) | 8mo | $224,900 | $169 | 63 |
| 141 Essex Road Rd | 0.32mi | 4/1.5 (+1) | 1,471 (+12%) | 6mo | $219,000 | $149 | 53 |
| 304 Otterbein Dr | 0.74mi | 3/2.0 | 1,391 (+6%) | 6mo | $180,000 | $129 | 46 |
| 113 Gables Blvd | 0.69mi | 3/2.0 | 1,504 (+15%) | 6mo | $407,500 | $271 | 34 |
| 343 Sherwood Dr | 0.69mi | 4/1.5 (+1) | 1,501 (+14%) | 3mo | $269,900 | $180 | 34 |
Match score weights: distance 35% · size 25% · config 20% · recency 20%. Top-matched comps best support the ARV.
Projected returns pro-forma
-3.0% appreciation · 3.0% rent growth · sell at horizon
- IRR
- -17.2%
- Equity multiple
- 0.39×
- Total profit
- $-33,137
- Equity at exit
- $29,060
- IRR
- -9.1%
- Equity multiple
- 0.43×
- Total profit
- $-30,854
- Equity at exit
- $16,851
Cash invested: $54,572 (down + closing). Projections, not guarantees.
Landlord ↔ Tenant lean methodology
- Overall (STATE)
- 73 Landlord-Friendly
- State Ohio
- 73 Landlord-Friendly · R+6
- County
- — inherits STATE
- City
- — inherits STATE
ZIP-level market 44904
- Active inventory
- 62
- Price-to-rent
- 10.0×
Monthly cashflow live
- Estimated rent
- $1,625 medium interval (Pro) →
- Mortgage (P&I)
- −$1,022
- Tax from tax record
- −$205 /mo · $2,460/yr
- Insurance
- −$81
- HOA
- −$0
- Vacancy / Maint / Mgmt
- −$341
- Net cashflow
- $-24
Break-even live
UW: 25.0% down · 7.5% · 30yr · 1.5% tax · 5.0% vac · 8.0% maint · 8.0% mgmt
Financing live
Cash to close
- Down payment
- $48,725
- Closing costs
- $5,847
- Reserves months
- —
- Total cash needed
- —
Loan-product check · same deal, 3 products live
Conventional
25% down · 7.5% · 30yr
- Down + closing
- —
- Monthly P&I
- —
- Monthly cashflow
- —
- DSCR
- —
- Eligible?
- —
Personal DTI + credit; lowest rate.
DSCR
20% down · 8.5% · 30yr
- Down + closing
- —
- Monthly P&I
- —
- Monthly cashflow
- —
- DSCR
- —
- Eligible?
- —
No personal income docs; deal must DSCR.
Hard money
10% down · 12.0% · 12mo
- Down + closing
- —
- Monthly P&I
- —
- Monthly cashflow
- —
- DSCR
- —
- Eligible?
- —
Short-term bridge; refi at stabilization.
Rent comps 1 comps
| Address | Beds | Baths | Sqft | Rent | $/sqft | DOM | Units | Dist |
|---|---|---|---|---|---|---|---|---|
| 335 Castor Rd Mansfield, OH | 2.0–3.0 | 1.0 | 926 | $1,099 | $1.19 | 43d | 4 | 0.84mi |
Listing history 4 events
-
2026-06-19days on market $194,900 Active 3 DOM
-
2026-06-18days on market $194,900 Active 2 DOM
-
2026-06-17remarks 695-char remark
-
2026-06-17$194,900 Active 1 DOM
ⓘ Source: listings_history table (triggers on properties + properties_extension) + one-shot
backfill from property_details.listing_events for pre-trigger history.
Tax reassessment forecast OH · Partial reset (capped growth)
- Current annual tax
- $2,460 · $205/mo
- Projected year-2 tax
- $2,750 · $229/mo
- Expected delta
- +$290/yr (+$24/mo · 11.8%)
ⓘ Screening estimate from a state-policy table — verify with the county assessor before closing.
Climate risk First Street
- Flood 1/10 Low FEMA zone X (unshaded) · 0% chance over 30 yrs
- Wildfire 1/10 Low
- Heat 3/10 Moderate 7 d/yr ≥97°F today · 17 d/yr by 30 yrs out
- Wind 2/10 Low
- Air quality 2/10 Low 1 unhealthy d/yr today · 1 by 30 yrs out
Nearby sold comps map
Loading sold comps map…
Walkable amenities ~0.75 mi
Loading nearby amenities…
Taxation est. · year 1
- Rental income
- $19,502
- − Mortgage interest
- −$10,917
- − Property taxes
- −$2,460
- − Insurance
- −$974
- − Repairs & maintenance
- −$1,560
- − Management
- −$1,560
- − Depreciation
- −$5,670
- Taxable loss
- −$3,640
- Est. tax savings @ 24.0%
- +$874
- After-tax cash flow
- $581/yr
For passive investors: Depreciation is non-cash, so a rental often shows a tax loss while cash-flowing — sheltering income. Rental losses are passive: they offset passive income freely, and up to $25,000/yr can offset ordinary (W-2) income if you actively participate and your MAGI is under $100k (phasing out to $0 by $150k); unused losses carry forward. On sale, claimed depreciation is recaptured at up to 25%, and gains may owe capital-gains tax (a 1031 exchange can defer both). Figures are a year-1 estimate at your 24.0% rate — not tax advice; consult a CPA.
Schools (NCES district)
- District
- Lexington Local
- NCES district ID
- 3904943
- Math proficiency
- 72% ▼ -9.00%
- Reading proficiency
- 75% ▼ -4.00%
- Median HH income
- $56,984
- Composite
- 62.93/100
- National rank
- #659
- State rank
- #113 of 656 in OH
Livability — Lexington
- Score
- 77/100
- State rank
- #198
- US rank
- #3037
Category grades
Schools grade is shown separately in the Schools card above.
Census & demographics
- Census place
- Lexington, OH
- County
- Richland County · 43,943 people
- City population
- 13,450
- Metro
- Mansfield, OH
- Population (ZIP)
- 13,450
- Household income
- $62,364
- Rent vs Own
- Severe rent burden
- 237.0
Population outlook (Richland County) Hauer SSP2
- Today (2025)
- 115,577 people
- By 2030
- 111,669 · -3.4%
- By 2040
- 103,323 · -10.6%
- By 2050
- 95,135 · -17.7%
- By 2075
- 76,719 · -33.6%
- By 2100
- 57,188 · -50.5%
Race, ethnicity, and origin ACS 2023
- Neighborhood character
- Predominantly White (96%)
- Race & ethnicity
- White 96% Two or more races 2% Hispanic / Latino 2%
- Common ancestry
- Lithuanian 4% Italian 3% Slovak 2%
- Foreign-born
- 3% · Canada
- Languages at home
- 96% English-only · Spanish 1% German/W. Germanic 1% French/Haitian/Cajun 1%
Political lean MEDSL · Richland
- 2024 margin
- Solid R (+42.3) · D 28.4% · R 70.8%
- 2008→2024 swing
- -28.8pp toward R · 2008: -13.6pp · 2024: -42.3pp
- All cycles
- 2024: R+42.3 2020: R+39.7 2016: R+37.5 2012: R+20.1 2008: R+13.6
Not yet ingested
- Civics
- —
Market trends
- HPI YoY
- ▼ -130.61%
- Current HPI
- 203.175
- Rent YoY
- —
- Metro
- Mansfield, OH
- State GDP YoY
- ▲ 1.98%
- F500 in state
- 48
Industry mix (Fortune 500 HQ in OH)
| Industry | F500 HQs | Revenue |
|---|---|---|
| Insurance | 3 | $145B |
|
||
| Industrial Machinery | 3 | $49B |
|
||
| Financial Services | 3 | $24B |
|
||
| Consumer Goods | 2 | $93B |
|
||
| Aerospace / Defense | 2 | $47B |
|
||
| Utilities | 2 | $33B |
|
||
Price history
+154.8% since first listed6 events — show timeline
- 2026-06-16 Listed $194,900 MARMLS
- 2019-08-01 Sold (Public Records) $124,000 Public Records
- 2019-07-29 Sold (MLS) $124,000 MARMLS
- 2019-05-20 Listed $119,900 MARMLS
- 2014-04-25 Sold (MLS) $71,500 MARMLS
- 2014-03-19 Listed $76,500 MARMLS
Property tax history
+8.5%/yrLatest (2025): $2,460 · -2.3% YoY. Source: county tax records.
Cash-flow waterfall
monthlySold comps — $/sqft
last 12 mo · ≤1 miLoading sold comps…