1255 W Grangeville Space# 53 Blvd · Hanford, CA
Flood risk 1/10 · Minimal
- FEMA flood zone
- X (unshaded)
- Chance of flooding over 30 yrs
- 0.0%
- Est. flood insurance / yr
- $507 – $1,088
Fire risk 5/10 · Moderate
- Est. fire insurance / yr
- $659 – $1,223
Heat risk 8/10 · Major
- Hot days now (above 105°F)
- 7 days/yr
- Hot days in 30 yrs
- 15 days/yr
Wind risk 1/10 · Minimal
- Chance of severe wind over 30 yrs
- —
Air-quality risk 10/10 · Severe
- Unhealthy air days now
- 31 days/yr
- Unhealthy air days in 30 yrs
- 35 days/yr
Risk factors via First Street. Map © Google.
Why this score? — see what drove the B grade
The composite is a weighted blend of 9 inputs, each scored 0–100. Each bar is that input's sub-score; the figure is the points it added to the 100-point composite (weight × sub-score).
- Cash flow +30.0/30.0
- 1% rule +10.0/10.0
- DSCR +10.0/10.0
- ARV discount +7.5/15.0
- Livability +3.8/5.0
- Schools +3.6/10.0
- Rent growth +3.2/5.0
- Condition / age +2.5/5.0
- Appreciation +0.0/10.0
$99,000
🖨 Deal sheet (PDF) 📄 Offer letter ✓ Due diligence
Listing remarks MLS
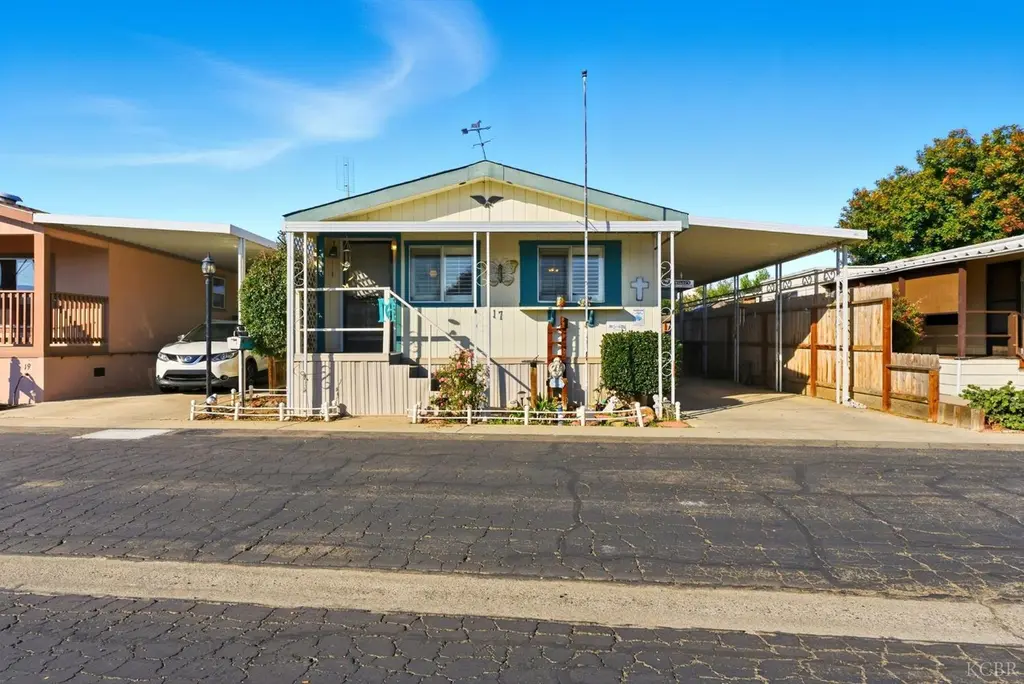
Charming 2/2 mobile in Tara Mobile Estates, 55+ community! Well maintained double wide that features spacious rooms, a cozy fireplace in the living room, formal dining area and breakfast nook. Outdoor garden area including a shed in the backyard for all your storage needs, entertaining area great for enjoying the day, and relaxing with friends.
Key facts
- Premium location
- Natural light
- Pond views
Tags
Property features AI
Finance
- Other: Directions: From 12th & Grangeville, east on Grangeville, pull into park and drive straight ahead; property will be on the right.
- HOA & community: Monthly association fee (listed): $701; Located in a senior community; Park name: Oak Manor
Exterior
- Parking: Detached garage with 1 parking space
- Utilities: Public water; Public sewer
- Home design: Manufactured home (residential); Single-story
- Exterior features: Covered porch; Composition roof; Located on a city street
Interior
- Bathrooms: 2 full bathrooms
- Heating & cooling: Central heating; Central air conditioning
- Interior features: Vaulted ceilings; Gas water heater
- Laundry & utility: Dedicated laundry room
Neighborhood map
What this means for you Summary
Snapshot
- This is a 2-bed/2.0-bath land listed at $99k.
Deal economics
- At list price, monthly cash flow is $383 ($5k/yr) — positive.
- The deal already cash-flows at list — no discount required.
- Meets the 1% rule at list price ($2k rent vs $99k).
- Cap rate 10.9% vs local median 3.9% in Hanford — top-decile yield for the area; either an underpriced asset or a hidden risk that comps aren't pricing in. Stress-test before assuming the spread holds.
Location & tenants
- Location reads 75/100 on livability (#121 in CA, #4,255 nationally) — a middle-class / working-renter tenant base. Strengths: commute A+, housing A+, amenities B; Watch: crime D+, health & safety D+, cost of living F.
- Hanford Joint Union High (urban): math 20% / reading 58% proficiency, ranked #765 of 1,400 in CA (top 55%) — families likely to look elsewhere, expect single-tenant / working-renter base with shorter leases.
- Market conditions: Rents rising (+2.9%/yr); 434 active listings in the ZIP; 11 comparable units currently listed for rent nearby; rentals at typical pace (median 15d on market — plan ~3-4 weeks tenant-placement turnaround); solid renter incomes; 741 units permitted in Kings County in 2024 (307 in 5+ unit buildings).
- This rent runs 35% of the median local income ($76k/yr) — at the standard rent-burdened threshold; future hikes will face affordability resistance.
Forward outlook
- Local home prices are declining (-3.0%/yr); year-one equity from $684 of loan paydown is wiped out by about $3k of value loss. Plan a longer hold.
- At projected returns (-3.0% appreciation + 2.9% rent growth), your $28k cash investment doubles in ~8 years — after that, you're playing with house money.
Negotiation context
- Only 8 days on market — expect competitive offers; lowballing is unlikely to land.
- 47 sale attempts since 13y ago; this cycle's ask is 98% above the opening price — seller raised mid-cycle; expect resistance to lowballs.
- Current owner paid $52k; list at $99k implies a 90% gain — meaningful room to come down on a strong offer.
Risks & watch-outs
- Watch-outs: HOA is 31% of rent.
- Climate carrying-cost: moderate wildfire risk; extreme-heat days projected 7→15/yr by 2055 (HVAC capex compounding) — expect insurance premiums to compound above CPI over the hold.
Questions for the listing agent
- Built in 1971 — when were the roof, HVAC, electrical panel, plumbing, and water heater last replaced?
- What does the HOA fee cover, when was the last increase, and are there any pending special assessments or reserve-fund shortfalls?
- Is there a deadline driving the sale (1031 exchange, divorce, estate, relocation)? That informs how much negotiation room exists.
- Crime grade is D in this area — have there been break-ins, vandalism, or insurance claims at this property in the last 3 years? What carrier currently insures it and at what premium?
- What's the average days-on-market for RENTAL listings here right now (not sales)? A rising rental-DOM trend means longer vacancies and softer asking-rent achievability than the comps imply.
- What's the recent tenant-quality profile in this submarket — average credit score on applications, eviction rate, late-payment / NSF rate, and stable-employment percentage? A property-management company in the area should have these aggregated.
- How much new for-sale + rental construction is in the pipeline within 1–3 miles? Heavy new supply typically softens prices + rents 12–24 months out; constrained supply supports both.
Investment metrics
- 1% rule
- 2.26% ✓
- Cap rate
- 10.93%
- Cash-on-cash
- 16.56%
- DSCR
- 1.74
- GRM
- 3.7
CMA / ARV
No comps found within radius.
Projected returns pro-forma
-3.0% appreciation · 2.87% rent growth · sell at horizon
- IRR
- 7.8%
- Equity multiple
- 1.31×
- Total profit
- $8,497
- Equity at exit
- $14,761
- IRR
- 17.2%
- Equity multiple
- 2.42×
- Total profit
- $39,466
- Equity at exit
- $8,560
Cash invested: $27,720 (down + closing). Projections, not guarantees.
Landlord ↔ Tenant lean methodology
- Overall (STATE)
- 18 Strongly Tenant-Friendly
- State California
- 18 Strongly Tenant-Friendly · D+13
- County
- — inherits STATE
- City
- — inherits STATE
ZIP-level market 93230
- Rents YoY
- 2.9%
- Active inventory
- 434
- Price-to-rent
- 3.7×
Monthly cashflow live
- Estimated rent
- $2,238 high interval (Pro) →
- Mortgage (P&I)
- −$519
- Tax est. 1.5%
- −$124 /mo · $1,485/yr
- Insurance
- −$41
- HOA
- −$701
- Vacancy / Maint / Mgmt
- −$470
- Net cashflow
- $383
Break-even live
Sensitivity live
| Price | -10% $451 | -5% $417 | +0% $383 | +5% $348 | +10% $314 |
|---|---|---|---|---|---|
| Rent | -10% $206 | -5% $294 | +0% $383 | +5% $471 | +10% $559 |
| Rate | -1.0pp $432 | -0.5pp $408 | base $383 | +0.5pp $357 | +1.0pp $331 |
UW: 25.0% down · 7.5% · 30yr · 1.5% tax · 5.0% vac · 8.0% maint · 8.0% mgmt
Financing live
Cash to close
- Down payment
- $24,750
- Closing costs
- $2,970
- Reserves months
- —
- Total cash needed
- —
Loan-product check · same deal, 3 products live
Conventional
25% down · 7.5% · 30yr
- Down + closing
- —
- Monthly P&I
- —
- Monthly cashflow
- —
- DSCR
- —
- Eligible?
- —
Personal DTI + credit; lowest rate.
DSCR
20% down · 8.5% · 30yr
- Down + closing
- —
- Monthly P&I
- —
- Monthly cashflow
- —
- DSCR
- —
- Eligible?
- —
No personal income docs; deal must DSCR.
Hard money
10% down · 12.0% · 12mo
- Down + closing
- —
- Monthly P&I
- —
- Monthly cashflow
- —
- DSCR
- —
- Eligible?
- —
Short-term bridge; refi at stabilization.
Rent comps 11 comps
| Address | Beds | Baths | Sqft | Rent | $/sqft | DOM | Units | Dist |
|---|---|---|---|---|---|---|---|---|
| 630 Neville St Hanford, CA | 2.0 | 1.0 | 1399 | $1,550 | $1.11 | 22d | 1 | 0.56mi |
| 1920 N 11th Ave Hanford, CA | 3.0 | 2.0 | 1500 | $1,650 | $1.10 | 22d | 1 | 0.66mi |
| 1603 Middleton St Hanford, CA | 3.0 | 3.0 | 2118 | $3,500 | $1.65 | 15d | 1 | 0.74mi |
| 2068 W Merritt St Hanford, CA | 3.0 | 2.0 | 1332 | $2,200 | $1.65 | 22d | 1 | 0.93mi |
| 140 W Terrace Dr Hanford, CA | 2.0 | 2.0 | 1664 | $1,995 | $1.20 | 22d | 1 | 1.07mi |
| 1975 W Escher Dr Hanford, CA | 3.0 | 2.0 | 1450 | $2,750 | $1.90 | 15d | 1 | 1.24mi |
| 2430 W Mallard Ln Hanford, CA | 3.0 | 2.0 | 1898 | $2,500 | $1.32 | 3d | 1 | 1.34mi |
| 2445 W Mallard Ln Hanford, CA | 3.0 | 2.0 | 1780 | $2,395 | $1.35 | 4d | 1 | 1.34mi |
| 2331 Vineyard Ct Hanford, CA | 3.0 | 2.0 | 1642 | $3,000 | $1.83 | 3d | 1 | 1.38mi |
| 345 Hanford, CA | 3.0 | 2.0 | 1509 | $2,400 | $1.59 | 15d | 1 | 1.43mi |
| 2563 Chianti Way Hanford, CA | 3.0 | 2.0 | 1486 | $2,700 | $1.82 | 3d | 1 | 1.46mi |
HOA detail
- Monthly dues
- $701 · $8,412/yr
Listing history 50 events
-
2026-06-21days on market $99,000 Active 8 DOM
-
2026-06-19days on market $99,000 Active 6 DOM
-
2026-06-18days on market $99,000 Active 5 DOM
-
2026-06-17days on market $99,000 Active 4 DOM
-
2026-06-16days on market $99,000 Active 3 DOM
-
2026-06-15days on market $99,000 Active 2 DOM
-
2026-06-14pricedays on market $99,000 Active 1 DOM
-
2026-06-13days on market $100,000 Active 24 DOM
-
2026-06-10days on market $100,000 Active 22 DOM
-
2026-06-09days on market $100,000 Active 21 DOM
-
2026-06-08days on market $100,000 Active 20 DOM
-
2026-06-07days on market $100,000 Active 19 DOM
-
2026-06-05days on market $100,000 Active 16 DOM
-
2026-06-03days on market $100,000 Active 15 DOM
-
2026-06-02days on market $100,000 Active 14 DOM
-
2026-06-01days on market $100,000 Active 13 DOM
-
2026-05-31days on market $100,000 Active 12 DOM
-
2026-05-30days on market $100,000 Active 11 DOM
-
2021-08-10soldstatus $52,000 346-char remark
Show marketing remark (346 chars)
Charming 2/2 mobile in Tara Mobile Estates, 55+ community! Well maintained double wide that features spacious rooms, a cozy fireplace in the living room, formal dining area and breakfast nook. Outdoor garden area including a shed in the backyard for all your storage needs, entertaining area great for enjoying the day, and relaxing with friends.
-
2021-06-25soldstatus $72,500 470-char remark
Show marketing remark (470 chars)
This 2 bedroom 2 bathroom home is located in Tara Estates where included amenities include a community clubhouse, pool/spa, pond, and a quiet neighborhood to enjoy. The mobile on space 41 is spacious, meticulously maintained, and includes brand new carpet in both bedrooms, and spacious updated bathrooms. Enjoy the sound and view of the fountain in the pond from your cozy front porch area. A small outdoor space in the back includes retractable awning and fruit trees.
-
2021-05-26$49,900 346-char remark
Show marketing remark (346 chars)
Charming 2/2 mobile in Tara Mobile Estates, 55+ community! Well maintained double wide that features spacious rooms, a cozy fireplace in the living room, formal dining area and breakfast nook. Outdoor garden area including a shed in the backyard for all your storage needs, entertaining area great for enjoying the day, and relaxing with friends.
-
2021-04-29soldstatus $45,000
-
2021-04-29soldstatus $45,000
-
2021-04-29soldstatus $45,000
-
2021-04-05$64,000 470-char remark
Show marketing remark (470 chars)
This 2 bedroom 2 bathroom home is located in Tara Estates where included amenities include a community clubhouse, pool/spa, pond, and a quiet neighborhood to enjoy. The mobile on space 41 is spacious, meticulously maintained, and includes brand new carpet in both bedrooms, and spacious updated bathrooms. Enjoy the sound and view of the fountain in the pond from your cozy front porch area. A small outdoor space in the back includes retractable awning and fruit trees.
-
2021-02-11$52,500
-
2021-02-10$52,500
-
2021-01-29soldstatus $60,000
-
2021-01-21soldstatus $35,000
-
2021-01-15$70,000
-
2020-12-04$62,500
-
2020-11-13soldstatus $62,500
-
2020-11-13soldstatus $35,000
-
2020-10-09$65,000
-
2020-09-08$35,000
-
2020-08-10soldstatus $35,000
-
2020-06-16soldstatus $72,000
-
2020-05-15$73,000
-
2020-05-11$73,000
-
2020-03-19$35,000
-
2020-03-11$39,900
-
2019-05-06soldstatus $64,500
-
2019-03-05$69,900
-
2018-12-10soldstatus $39,000
-
2018-12-10soldstatus $39,000
-
2018-09-10soldstatus $15,000
-
2018-09-07soldstatus $15,000
-
2018-07-30soldstatus $64,000
-
2018-07-30soldstatus $64,000
-
2018-07-27soldstatus $42,000
ⓘ Source: listings_history table (triggers on properties + properties_extension) + one-shot
backfill from property_details.listing_events for pre-trigger history.
Climate risk First Street
- Flood 1/10 Low FEMA zone X (unshaded) · 0% chance over 30 yrs
- Wildfire 5/10 Major
- Heat 8/10 Severe 7 d/yr ≥105°F today · 15 d/yr by 30 yrs out
- Wind 1/10 Low
- Air quality 10/10 Extreme 31 unhealthy d/yr today · 35 by 30 yrs out
Nearby sold comps map
Loading sold comps map…
Walkable amenities ~0.75 mi
Loading nearby amenities…
Taxation est. · year 1
- Rental income
- $26,852
- − Mortgage interest
- −$5,546
- − Property taxes
- −$1,485
- − Insurance
- −$495
- − Repairs & maintenance
- −$2,148
- − Management
- −$2,148
- − HOA
- −$8,412
- − Depreciation
- −$2,880
- Taxable income
- $3,738
- Est. tax owed @ 24.0%
- −$897
- After-tax cash flow
- $3,694/yr
For passive investors: Depreciation is non-cash, so a rental often shows a tax loss while cash-flowing — sheltering income. Rental losses are passive: they offset passive income freely, and up to $25,000/yr can offset ordinary (W-2) income if you actively participate and your MAGI is under $100k (phasing out to $0 by $150k); unused losses carry forward. On sale, claimed depreciation is recaptured at up to 25%, and gains may owe capital-gains tax (a 1031 exchange can defer both). Figures are a year-1 estimate at your 24.0% rate — not tax advice; consult a CPA.
Schools (NCES district)
- District
- Hanford Joint Union High
- NCES district ID
- 0616500
- Math proficiency
- 20% ▲ 1.00%
- Reading proficiency
- 58% ▬ 0.00%
- Median HH income
- $47,265
- Composite
- 35.8/100
- National rank
- #9626
- State rank
- #765 of 1400 in CA
Livability — Hanford
- Score
- 75/100
- State rank
- #121
- US rank
- #4255
Category grades
Schools grade is shown separately in the Schools card above.
Census & demographics
- Census place
- Hanford, CA
- County
- Kings County · 107,655 people
- City population
- 69,684
- Metro
- Hanford-Corcoran, CA
- Population (ZIP)
- 69,684
- Household income
- $76,023
- Rent vs Own
- Severe rent burden
- 2081.0
Population outlook (Kings County) Hauer SSP2
- Today (2025)
- 147,136 people
- By 2030
- 145,623 · -1.0%
- By 2040
- 146,017 · -0.8%
- By 2050
- 145,239 · -1.3%
- By 2075
- 131,479 · -10.6%
- By 2100
- 103,967 · -29.3%
Race, ethnicity, and origin ACS 2023
- Neighborhood character
- Diverse neighborhood (Simpson 0.60)
- Race & ethnicity
- Hispanic / Latino 52% White 35% Two or more races 19% Black 5% Asian 3% Native American 2%
- Hispanic origin (detail)
- Mexican 49%
- Common ancestry
- Russian 6% Italian 2% Lithuanian 1%
- Foreign-born
- 17% · Canada
- Languages at home
- 65% English-only · Spanish 31% Other Indo-European 2% Tagalog/Filipino 2%
Political lean MEDSL · Kings
- 2024 margin
- Strong R (+23.0) · D 37.4% · R 60.4% · Other 2.2%
- 2008→2024 swing
- -8.9pp toward R · 2008: -14.1pp · 2024: -23.0pp
- All cycles
- 2024: R+23.0 2020: R+12.2 2016: R+14.1 2012: R+16.3 2008: R+14.1
Not yet ingested
- Civics
- —
Market trends
- HPI YoY
- ▼ -267.79%
- Current HPI
- 321.3409
- Rent YoY
- ▲ 2.87%
- Metro
- Hanford-Corcoran, CA
- State GDP YoY
- ▲ 3.21%
- F500 in state
- 116
Industry mix (Fortune 500 HQ in CA)
| Industry | F500 HQs | Revenue |
|---|---|---|
| Technology | 27 | $1,492B |
|
||
| Financial Services | 3 | $174B |
|
||
| Retail | 3 | $44B |
|
||
| Insurance | 3 | $26B |
|
||
| Media / Entertainment | 2 | $115B |
|
||
| Pharmaceuticals / Biotech | 2 | $62B |
|
||
Price history
-93.6% since first listed91 events — show timeline
- 2021-08-10 Sold (MLS) $52,000 KCBOR
- 2021-06-25 Sold (MLS) $72,500 KCBOR
- 2021-05-26 Listed $49,900 KCBOR
- 2021-04-29 Sold (MLS) $45,000 TCMLS
- 2021-04-29 Sold (MLS) $45,000 KCBOR
- 2021-04-29 Sold (MLS) $45,000 FRESNOMLS
- 2021-04-05 Listed $64,000 KCBOR
- 2021-02-11 Listed $52,500 FRESNOMLS
- 2021-02-10 Listed $52,500 KCBOR
- 2021-01-29 Sold (MLS) $60,000 KCBOR
- 2021-01-21 Sold (MLS) $35,000 KCBOR
- 2021-01-15 Listed $70,000 KCBOR
- 2020-12-04 Listed $62,500 KCBOR
- 2020-11-13 Sold (MLS) $35,000 KCBOR
- 2020-11-13 Sold (MLS) $62,500 KCBOR
- 2020-10-09 Listed $65,000 KCBOR
- 2020-09-08 Listed $35,000 KCBOR
- 2020-08-10 Sold (MLS) $35,000 KCBOR
- 2020-06-16 Sold (MLS) $72,000 KCBOR
- 2020-05-15 Listed $73,000 KCBOR
- 2020-05-11 Listed $73,000 KCBOR
- 2020-03-19 Listed $35,000 KCBOR
- 2020-03-11 Listed $39,900 KCBOR
- 2019-05-06 Sold (MLS) $64,500 KCBOR
- 2019-03-05 Listed $69,900 KCBOR
- 2018-12-10 Sold (MLS) $39,000 KCBOR
- 2018-12-10 Sold (MLS) $39,000 TCMLS
- 2018-09-10 Sold (MLS) $15,000 KCBOR
- 2018-09-07 Sold (MLS) $15,000 KCBOR
- 2018-07-30 Sold (MLS) $64,000 KCBOR
- 2018-07-30 Sold (MLS) $64,000 FRESNOMLS
- 2018-07-27 Sold (MLS) $42,000 KCBOR
- 2018-07-24 Listed $17,000 KCBOR
- 2018-06-22 Sold (MLS) $22,500 TCMLS
- 2018-06-22 Sold (MLS) $22,500 KCBOR
- 2018-06-13 Sold (MLS) $15,500 TCMLS
- 2018-06-12 Sold (MLS) $15,500 KCBOR
- 2018-06-07 Listed $64,900 FRESNOMLS
- 2018-06-02 Listed $39,000 KCBOR
- 2018-06-02 Listed $39,000 TCMLS
- 2018-05-30 Listed $64,900 KCBOR
- 2018-05-22 Listed $15,000 KCBOR
- 2018-05-17 Listed $25,000 TCMLS
- 2018-05-14 Listed $25,000 KCBOR
- 2018-05-11 Sold (MLS) $35,000 KCBOR
- 2018-04-11 Sold (MLS) $42,000 KCBOR
- 2018-04-11 Sold (MLS) $42,000 FRESNOMLS
- 2018-04-02 Listed $42,000 KCBOR
- 2018-03-30 Sold (MLS) $21,000 KCBOR
- 2018-03-11 Listed $17,500 TCMLS
- 2018-03-08 Listed $17,500 KCBOR
- 2018-02-24 Listed $25,000 KCBOR
- 2018-02-15 Listed $35,000 KCBOR
- 2018-01-20 Listed $24,950 KCBOR
- 2018-01-10 Listed $17,000 KCBOR
- 2017-11-13 Listed $45,000 KCBOR
- 2017-11-13 Listed $45,000 FRESNOMLS
- 2017-11-10 Sold (MLS) $14,000 KCBOR
- 2017-11-01 Sold (MLS) $35,000 KCBOR
- 2017-10-19 Sold (MLS) $40,000 KCBOR
- 2017-09-02 Listed $21,000 KCBOR
- 2017-08-24 Listed $49,950 KCBOR
- 2017-08-04 Listed $48,000 KCBOR
- 2017-07-06 Sold (MLS) $35,000 KCBOR
- 2017-06-12 Sold (MLS) $38,000 KCBOR
- 2017-05-12 Sold (MLS) $37,000 KCBOR
- 2017-04-10 Listed $40,000 KCBOR
- 2017-04-06 Listed $44,000 KCBOR
- 2017-03-27 Listed $39,000 KCBOR
- 2017-01-24 Listed $42,500 KCBOR
- 2016-09-26 Sold (MLS) $17,000 KCBOR
- 2016-08-11 Listed $17,000 KCBOR
- 2016-03-10 Sold (MLS) $17,500 KCBOR
- 2015-12-07 Listed $17,500 KCBOR
- 2015-11-12 Sold (MLS) $35,000 KCBOR
- 2015-11-06 Sold (MLS) $17,500 KCBOR
- 2015-10-01 Listed $17,500 KCBOR
- 2015-10-01 Listed $39,000 KCBOR
- 2015-08-05 Listed $29,950 KCBOR
- 2015-06-01 Listed $42,950 KCBOR
- 2015-05-28 Sold (MLS) $65,000 KCBOR
- 2015-05-26 Sold (MLS) $25,000 KCBOR
- 2015-05-15 Sold (MLS) $23,500 KCBOR
- 2015-03-19 Sold (MLS) $15,000 KCBOR
- 2015-03-06 Listed $40,000 KCBOR
- 2015-01-29 Listed $69,500 KCBOR
- 2014-06-11 Sold (MLS) $30,000 KCBOR
- 2014-04-25 Listed $25,000 KCBOR
- 2013-12-04 Listed $35,000 KCBOR
- 2013-11-14 Sold (MLS) $20,000 KCBOR
- 1992-02-14 Sold (Public Records) $818,000 Public Records
Property tax history
+1.9%/yrLatest (2025): $32,482 · +3.7% YoY. Source: county tax records.
Cash-flow waterfall
monthlySold comps — $/sqft
last 12 mo · ≤1 miLoading sold comps…