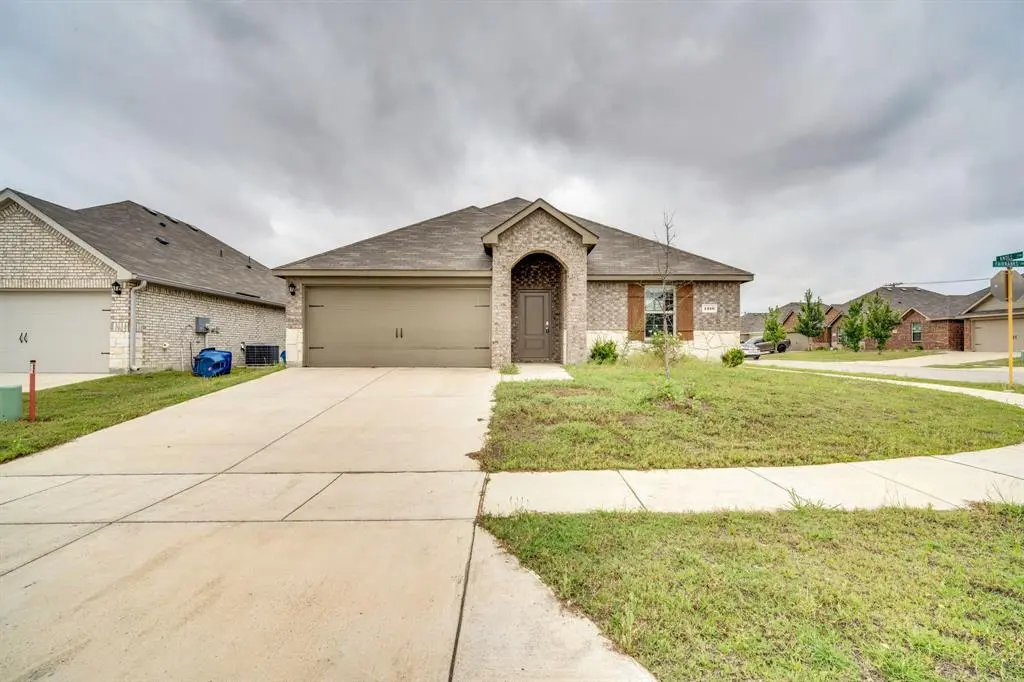
1219 Fairbanks Dr · Ennis, TX
Flood risk 1/10 · Minimal
- FEMA flood zone
- X (unshaded)
- Chance of flooding over 30 yrs
- 0.0%
- Est. flood insurance / yr
- $507 – $1,088
Fire risk 5/10 · Moderate
- Est. fire insurance / yr
- $1,222 – $2,270
Heat risk 7/10 · Major
- Hot days now (above 110°F)
- 7 days/yr
- Hot days in 30 yrs
- 26 days/yr
Wind risk 6/10 · Moderate
- Chance of severe wind over 30 yrs
- 70.0%
Air-quality risk 2/10 · Minimal
- Unhealthy air days now
- 0 days/yr
- Unhealthy air days in 30 yrs
- 1 days/yr
Risk factors via First Street. Map © Google.
Why this score? — see what drove the D+ grade
The composite is a weighted blend of 9 inputs, each scored 0–100. Each bar is that input's sub-score; the figure is the points it added to the 100-point composite (weight × sub-score).
- ARV discount +14.9/15.0
- Cash flow +10.9/30.0
- 1% rule +4.3/10.0
- Condition / age +4.0/5.0
- Livability +3.6/5.0
- Schools +3.4/10.0
- DSCR +3.2/10.0
- Rent growth +3.2/5.0
- Appreciation +0.0/10.0
$240,000
🖨 Deal sheet 📄 Offer letter ✓ Due diligence
Listing remarks
Built in 2021, this 4 bedroom, 2 bathroom corner lot home offers an open layout, abundant natural light, and a spacious kitchen with granite countertops, island, and pantry. The large backyard and covered patio provide great space for entertaining or relaxing. The property does need some TLC, including flooring, paint, and general rehab, but presents a great opportunity for buyers looking to add value and purchase at an attractive price point. Located in a subdivision designed with community in mind, the neighborhood features sidewalks throughout and convenient access to I-45, Highway 287, Bluebonnet Park, and both the junior high and high school within walking distance. House is being sold
Key facts
- Sidewalks throughout
- Spacious kitchen
- Large backyard
Tags
Property features AI
Finance
- Other: Property is HUD owned; Deed restrictions apply
- HOA & community: Mandatory HOA; HOA fee $275 annually; HOA covers grounds maintenance; HOA managed by First Service Residential
Exterior
- Parking: Attached garage with 2 covered spaces; Driveway parking
- Utilities: City water with individual water meter; City sewer; Electricity available; Curbs
- Home design: Single-family residence; One story; Built in 2021; Residential property
- Construction: Brick construction; Composition roof; Slab foundation
- Exterior features: Covered patio/porch; Backyard wood fencing; Corner lot in a subdivision
Interior
- Kitchen: Dishwasher; Electric cooktop; Electric oven
- Bedrooms: 4 bedrooms, all on the main level; Primary bedroom with walk-in closet
- Flooring: Carpet; Laminate
- Bathrooms: 2 full bathrooms
- Heating & cooling: Central heating (electric); Central air conditioning (electric)
- Interior features: Open floorplan; Eat-in kitchen; Granite counters; Pantry; One living area; One dining area; 5 total rooms
- Laundry & utility: Full-size washer/dryer area; Electric dryer hookup
Neighborhood map
What this means for you Summary
Snapshot
- This is a 4-bed/2.0-bath single-family listed at $240k. Condition is rated good.
Deal economics
- At list price, monthly cash flow is $-106 ($-1k/yr) — negative.
- To cash-flow at today's rent, offer at most $221k (7.8% below list).
- To meet the 1% rule (rent ≥ 1% of price), the offer needs to be $224k (6.9% below list).
- Recommended offer: $221k (7.8% below list) — sets the bar for cash-flow.
- Cap rate 5.8% vs local median 4.5% in Ennis — meaningfully above typical; check what's discounted (condition, days-on-market, listing class) to confirm the premium yield is real.
Location & tenants
- Location reads 71/100 on livability (#304 in TX) — a middle-class / working-renter tenant base. Strengths: cost of living A+, housing A+, crime B+; Watch: amenities F, commute F, health & safety F.
- Ennis ISD (rural): math 41% / reading 39% proficiency, ranked #411 of 826 in TX (top 50%) — families likely to look elsewhere, expect single-tenant / working-renter base with shorter leases; 60% free/reduced lunch — lower-income household profile, screen leases tightly.
- Zoned schools: Bowie El (math 42% / reading 42%, grade F, #1,335 of 4,322 statewide, top 33%, 434 students, 68% FRL).
- Market conditions: Rents rising (+3.0%/yr); 363 active listings in the ZIP; 9 comparable units currently listed for rent nearby; rentals leasing fast (median 7d on market — plan ~1-2 weeks tenant-placement turnaround); solid renter incomes; 3,016 units permitted in Ellis County in 2024 (20 in 5+ unit buildings).
- This rent runs 35% of the median local income ($77k/yr) — at the standard rent-burdened threshold; future hikes will face affordability resistance.
Forward outlook
- Local home prices are declining (-3.0%/yr); year-one equity from $2k of loan paydown is wiped out by about $7k of value loss. Plan a longer hold.
- Ellis County population projected at +36% by 2050 — long-run rental-demand tailwind backs the buy-and-hold thesis.
Negotiation context
- It's been on market 28 days — a 2% lower offer ($236k) is reasonable based on typical stale-listing flexibility.
Risks & watch-outs
- Climate carrying-cost: major wind risk, 70% chance of damaging wind over 30y; moderate wildfire risk; extreme-heat days projected 7→26/yr by 2055 (HVAC capex compounding) — expect insurance premiums to compound above CPI over the hold.
Questions for the listing agent
- What do current leases actually rent for vs. the listed asking? Can we see a recent rent roll and the last 12 months of T-12 income?
- What does the HOA fee cover, when was the last increase, and are there any pending special assessments or reserve-fund shortfalls?
- Is there a deadline driving the sale (1031 exchange, divorce, estate, relocation)? That informs how much negotiation room exists.
- Schools are D-rated, which usually means shorter tenancies and higher turnover. Who's the typical renter profile here, and what's been the actual vacancy rate?
- The area grade is low — what's the realistic commute time and amenity access for the typical tenant pool here? Any planned neighborhood developments (good or bad) we should know about?
- What's the average days-on-market for RENTAL listings here right now (not sales)? A rising rental-DOM trend means longer vacancies and softer asking-rent achievability than the comps imply.
- What's the recent tenant-quality profile in this submarket — average credit score on applications, eviction rate, late-payment / NSF rate, and stable-employment percentage? A property-management company in the area should have these aggregated.
- How much new for-sale + rental construction is in the pipeline within 1–3 miles? Heavy new supply typically softens prices + rents 12–24 months out; constrained supply supports both.
Investment metrics
- 1% rule
- 0.93% ✗
- Cap rate
- 5.76%
- Cash-on-cash
- -1.89%
- DSCR
- 0.92
- GRM
- 8.9
CMA / ARV
- ARV (on-the-fly)
- $287,116
- Comps found
- 12
Show comp detail 12 sales within ~0.75 mi
| Address | Dist | Beds/Ba | Sqft | Sold | Price | $/sf | Match |
|---|---|---|---|---|---|---|---|
| 908 Barton Dr | 0.26mi | 4/2.0 | 1,565 (-2%) | 0mo | $273,490 | $175 | 84 |
| 901 Barton Dr | 0.27mi | 4/2.0 | 1,565 (-2%) | 2mo | $279,490 | $179 | 82 |
| 909 Barton Dr | 0.26mi | 3/2.0 (-1) | 1,613 (+1%) | 1mo | $278,990 | $173 | 81 |
| 808 Barton Dr | 0.27mi | 3/2.0 (-1) | 1,613 (+1%) | 2mo | $278,990 | $173 | 80 |
| 803 Barton Dr | 0.32mi | 4/2.0 | 1,565 (-2%) | 2mo | $281,490 | $180 | 79 |
| 906 Barton Dr | 0.27mi | 3/2.0 (-1) | 1,532 (-4%) | 2mo | $278,990 | $182 | 74 |
| 802 Barton Dr | 0.27mi | 3/2.0 (-1) | 1,532 (-4%) | 2mo | $274,990 | $179 | 73 |
| 910 Barton Dr | 0.26mi | 3/2.0 (-1) | 1,473 (-8%) | 2mo | $258,990 | $176 | 68 |
| 1000 Barton Dr | 0.26mi | 4/2.0 | 1,790 (+12%) | 2mo | $285,990 | $160 | 67 |
| 800 Barton Dr | 0.27mi | 3/2.0 (-1) | 1,447 (-10%) | 1mo | $264,990 | $183 | 65 |
| 810 Fairbanks Dr | 0.29mi | 3/2.0 (-1) | 1,447 (-10%) | 1mo | $264,990 | $183 | 64 |
| 904 Fairbanks Dr | 0.29mi | 3/2.0 (-1) | 1,450 (-10%) | 2mo | $260,990 | $180 | 64 |
Match score weights: distance 35% · size 25% · config 20% · recency 20%. Top-matched comps best support the ARV.
Projected returns pro-forma
-3.0% appreciation · 2.95% rent growth · sell at horizon
- IRR
- -19.4%
- Equity multiple
- 0.32×
- Total profit
- $-45,593
- Equity at exit
- $35,785
- IRR
- -12.1%
- Equity multiple
- 0.28×
- Total profit
- $-48,191
- Equity at exit
- $20,751
Cash invested: $67,200 (down + closing). Projections, not guarantees.
Landlord ↔ Tenant lean methodology
- Overall (STATE)
- 87 Strongly Landlord-Friendly
- State Texas
- 87 Strongly Landlord-Friendly · R+5
- County
- — inherits STATE
- City
- — inherits STATE
ZIP-level market 75119
- Rents YoY
- 3.0%
- Active inventory
- 363
- Price-to-rent
- 8.9×
Monthly cashflow live
- Estimated rent
- $2,235 high interval (Pro) →
- Mortgage (P&I)
- −$1,259
- Tax from tax record
- −$490 /mo · $5,883/yr
- Insurance
- −$100
- HOA
- −$23
- Vacancy / Maint / Mgmt
- −$469
- Net cashflow
- $-106
Break-even live
UW: 25.0% down · 7.5% · 30yr · 1.5% tax · 5.0% vac · 8.0% maint · 8.0% mgmt
Financing live
Cash to close
- Down payment
- $60,000
- Closing costs
- $7,200
- Reserves months
- —
- Total cash needed
- —
Loan-product check · same deal, 3 products live
Conventional
25% down · 7.5% · 30yr
- Down + closing
- —
- Monthly P&I
- —
- Monthly cashflow
- —
- DSCR
- —
- Eligible?
- —
Personal DTI + credit; lowest rate.
DSCR
20% down · 8.5% · 30yr
- Down + closing
- —
- Monthly P&I
- —
- Monthly cashflow
- —
- DSCR
- —
- Eligible?
- —
No personal income docs; deal must DSCR.
Hard money
10% down · 12.0% · 12mo
- Down + closing
- —
- Monthly P&I
- —
- Monthly cashflow
- —
- DSCR
- —
- Eligible?
- —
Short-term bridge; refi at stabilization.
Rent comps 9 comps
| Address | Beds | Baths | Sqft | Rent | $/sqft | DOM | Units | Dist |
|---|---|---|---|---|---|---|---|---|
| 1215 Knoll Dr Ennis, TX | 4.0 | 2.0 | 1609 | $2,050 | $1.27 | 3d | 1 | 0.09mi |
| 1200 Canterbury Ln Ennis, TX | 3.0 | 2.0 | 1508 | $2,250 | $1.49 | 10d | 1 | 0.09mi |
| 1213 Wildflower St Ennis, TX | 4.0 | 2.0 | 1696 | $2,100 | $1.24 | 2d | 1 | 0.19mi |
| 907 Wildflower St Ennis, TX | 4.0 | 2.0 | 1720 | $2,199 | $1.28 | 6d | 1 | 0.31mi |
| 904 Wildflower St Ennis, TX | 3.0 | 2.0 | 1302 | $2,099 | $1.61 | 24d | 1 | 0.33mi |
| 1209 Vicksburg Dr Ennis, TX | 4.0 | 2.0 | 1759 | $1,970 | $1.12 | 15d | 1 | 0.36mi |
| 1001 Odlozil Ln Ennis, TX | 4.0 | 2.0 | 1720 | $1,899 | $1.10 | 24d | 1 | 0.36mi |
| 1101 Biloxi Dr Ennis, TX | 1.0–3.0 | 1.0–2.0 | 909 | $1,575 | $1.73 | 1d | 4 | 0.63mi |
| 1212 Grace Cir Ennis, TX | 1.0–3.0 | 1.0–2.0 | 905 | $1,500 | $1.66 | 1d | 2 | 0.94mi |
HOA detail
- Monthly dues
- $23 · $276/yr
Listing history 14 events
-
2026-06-18days on market $240,000 Active 28 DOM
-
2026-06-17days on market $240,000 Active 27 DOM
-
2026-06-16days on market $240,000 Active 26 DOM
-
2026-06-15days on market $240,000 Active 25 DOM
-
2026-06-13days on market $240,000 Active 23 DOM
-
2026-06-09days on market $240,000 Active 19 DOM
-
2026-06-08days on market $240,000 Active 18 DOM
-
2026-06-07days on market $240,000 Active 17 DOM
-
2026-06-04days on market $240,000 Active 14 DOM
-
2026-06-03days on market $240,000 Active 13 DOM
-
2026-06-02days on market $240,000 Active 12 DOM
-
2026-06-01days on market $240,000 Active 11 DOM
-
2026-05-31days on market $240,000 Active 10 DOM
-
2026-05-21$240,000 Active
ⓘ Source: listings_history table (triggers on properties + properties_extension) + one-shot
backfill from property_details.listing_events for pre-trigger history.
Tax reassessment forecast TX · Resets to sale price
- Current annual tax
- $5,883 · $490/mo
- Projected year-2 tax
- $5,883 · $490/mo
- Expected delta
- $0/yr ($0/mo · 0.0%)
ⓘ Screening estimate from a state-policy table — verify with the county assessor before closing.
Climate risk First Street
- Flood 1/10 Low FEMA zone X (unshaded) · 0% chance over 30 yrs
- Wildfire 5/10 Major
- Heat 7/10 Severe 7 d/yr ≥110°F today · 26 d/yr by 30 yrs out
- Wind 6/10 Major 70% chance of damaging wind over 30 yrs
- Air quality 2/10 Low 0 unhealthy d/yr today · 1 by 30 yrs out
Nearby sold comps map
Loading sold comps map…
Walkable amenities ~0.75 mi
Loading nearby amenities…
Taxation est. · year 1
- Rental income
- $26,821
- − Mortgage interest
- −$13,444
- − Property taxes
- −$5,883
- − Insurance
- −$1,200
- − Repairs & maintenance
- −$2,146
- − Management
- −$2,146
- − HOA
- −$276
- − Depreciation
- −$6,982
- Taxable loss
- −$5,254
- Est. tax savings @ 24.0%
- +$1,261
- After-tax cash flow
- $-12/yr
For passive investors: Depreciation is non-cash, so a rental often shows a tax loss while cash-flowing — sheltering income. Rental losses are passive: they offset passive income freely, and up to $25,000/yr can offset ordinary (W-2) income if you actively participate and your MAGI is under $100k (phasing out to $0 by $150k); unused losses carry forward. On sale, claimed depreciation is recaptured at up to 25%, and gains may owe capital-gains tax (a 1031 exchange can defer both). Figures are a year-1 estimate at your 24.0% rate — not tax advice; consult a CPA.
Condition & rehab AI · 12 photos
This 2021-built home in a well-maintained neighborhood offers a good condition with minimal repairs needed. It presents a great opportunity for buyers looking to add value and purchase at an attractive price point.
Value-add opportunities
- Both Paint interior walls — Fresh paint enhances curb appeal and interior aesthetics
- Both Replace flooring — Dark wood flooring is outdated and could be replaced with more modern options
- Both Add landscaping — Landscaping can improve curb appeal and add value
- Both Install new windows — New windows can improve energy efficiency and increase home value
Renovation cost estimate screening
Value-add ROI direction
- Both Paint interior walls — Fresh paint enhances curb appeal and interior aesthetics ↑
- Both Replace flooring — Dark wood flooring is outdated and could be replaced with more modern options ↑
- Both Add landscaping — Landscaping can improve curb appeal and add value ↑
- Both Install new windows — New windows can improve energy efficiency and increase home value ↑
ⓘ Cost ranges are severity-bucket heuristics (US national rule-of-thumb). Get contractor quotes + a written scope before underwriting a rehab budget.
Schools (NCES district)
- District
- Ennis ISD
- NCES district ID
- 4818540
- Math proficiency
- 41% ▼ -6.00%
- Reading proficiency
- 39% ▼ -3.00%
- Median HH income
- $46,105
- Composite
- 34.14/100
- National rank
- #5283
- State rank
- #411 of 826 in TX
Livability — Ennis
- Score
- 71/100
- State rank
- #304
- US rank
- #6893
Category grades
Schools grade is shown separately in the Schools card above.
Census & demographics
- Census place
- Ennis, TX
- County
- Ellis County · 199,237 people
- City population
- 31,866
- Metro
- Dallas-Fort Worth-Arlington, TX
- Population (ZIP)
- 31,866
- Household income
- $77,053
- Rent vs Own
- Severe rent burden
- 784.0
Population outlook (Ellis County) Hauer SSP2
- Today (2025)
- 194,556 people
- By 2030
- 209,679 · +7.8%
- By 2040
- 238,837 · +22.8%
- By 2050
- 265,451 · +36.4%
- By 2075
- 326,571 · +67.9%
- By 2100
- 362,156 · +86.1%
Race, ethnicity, and origin ACS 2023
- Neighborhood character
- Diverse neighborhood (Simpson 0.60)
- Race & ethnicity
- White 47% Hispanic / Latino 41% Two or more races 13% Black 9%
- Hispanic origin (detail)
- Mexican 37%
- Common ancestry
- Slovak 1% Serbian 1% Italian 1%
- Foreign-born
- 15% · Canada
- Languages at home
- 69% English-only · Spanish 29% Other Indo-European 1%
Political lean MEDSL · Ellis
- 2024 margin
- Solid R (+31.1) · D 34.0% · R 65.1%
- 2008→2024 swing
- +11.2pp toward D · 2008: -42.2pp · 2024: -31.1pp
- All cycles
- 2024: R+31.1 2020: R+34.1 2016: R+45.4 2012: R+47.5 2008: R+42.2
Not yet ingested
- Civics
- —
Market trends
- HPI YoY
- ▼ -207.30%
- Current HPI
- 253.0134
- Rent YoY
- ▲ 2.95%
- Metro
- Dallas-Fort Worth-Arlington, TX
- State GDP YoY
- ▲ 3.95%
- F500 in state
- 110
Industry mix (Fortune 500 HQ in TX)
| Industry | F500 HQs | Revenue |
|---|---|---|
| Energy | 16 | $1,198B |
|
||
| Technology | 5 | $198B |
|
||
| Engineering / Construction | 4 | $72B |
|
||
| Energy Services | 3 | $60B |
|
||
| Utilities | 3 | $41B |
|
||
| Healthcare | 2 | $330B |
|
||
Price history
1 event — show timeline
- 2026-05-21 Listed $240,000 NTREIS
Property tax history
-8.0%/yrLatest (2025): $5,883 · -11.5% YoY. Source: county tax records.
Cash-flow waterfall
monthlySold comps — $/sqft
last 12 mo · ≤1 miLoading sold comps…