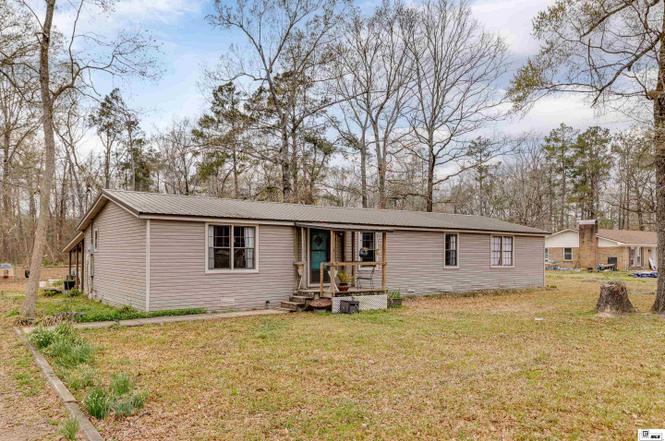
429 Barnes Rd · Swartz, LA
Flood risk 1/10 · Minimal
- FEMA flood zone
- X (unshaded)
- Chance of flooding over 30 yrs
- 0.0%
- Est. flood insurance / yr
- $507 – $1,088
Fire risk 4/10 · Minor
- Est. fire insurance / yr
- $1,269 – $2,357
Heat risk 7/10 · Major
- Hot days now (above 111°F)
- 7 days/yr
- Hot days in 30 yrs
- 20 days/yr
Wind risk 6/10 · Moderate
- Chance of severe wind over 30 yrs
- 69.0%
Air-quality risk 2/10 · Minimal
- Unhealthy air days now
- 0 days/yr
- Unhealthy air days in 30 yrs
- 1 days/yr
Risk factors via First Street. Map © Google.
Why this score? — see what drove the B- grade
The composite is a weighted blend of 9 inputs, each scored 0–100. Each bar is that input's sub-score; the figure is the points it added to the 100-point composite (weight × sub-score).
- Cash flow +29.5/30.0
- DSCR +10.0/10.0
- ARV discount +7.5/15.0
- 1% rule +7.2/10.0
- Schools +3.2/10.0
- Livability +3.2/5.0
- Rent growth +2.5/5.0
- Condition / age +2.5/5.0
- Appreciation +0.0/10.0
$130,000
🖨 Deal sheet 📄 Offer letter ✓ Due diligence
Listing remarks
Nestled on 2.4 acres, this beautiful 3 bedroom, 2.5 bath double wide mobile home offers space and comfort both inside and out! Step inside to find tall ceilings, neutral colors, crown molding, and vinyl and laminate flooring throughout, all complemented by a bright open floor plan that creates a welcoming atmosphere. The spacious kitchen is filled with natural light and offers abundant cabinet space, making it perfect for everyday living and entertaining. Just off the kitchen, you'll find a convenient dining area ideal for family meals or hosting guests. The primary suite is generously sized, and the en suite bathroom is designed for relaxation with double vanities, a walk-in shower, and a
Key facts
- Laminate flooring
- Vinyl flooring
- Tall ceilings
Tags
Neighborhood map
What this means for you Summary
Snapshot
- This is a 3-bed/2.0-bath manufactured listed at $130k.
Deal economics
- At list price, monthly cash flow is $465 ($6k/yr) — positive.
- The deal already cash-flows at list — no discount required.
- Meets the 1% rule at list price ($2k rent vs $130k).
- Recommended offer: $126k (3.0% below list) — sets the bar for market timing.
- Cap rate 10.6% vs local median 6.2% in Swartz — top-decile yield for the area; either an underpriced asset or a hidden risk that comps aren't pricing in. Stress-test before assuming the spread holds.
Location & tenants
- Location reads 64/100 on livability (#184 in LA) — a middle-class / working-renter tenant base. Strengths: cost of living A+, housing A+; Watch: schools C-, crime C-, health & safety D.
- Ouachita Parish (suburban): math 31% / reading 45% proficiency, ranked #26 of 98 in LA (top 26%) — families likely to look elsewhere, expect single-tenant / working-renter base with shorter leases.
- Market conditions: 437 active listings in the ZIP; 345 units permitted in Ouachita Parish in 2024 (0 in 5+ unit buildings).
- This rent runs 36% of the median local income ($52k/yr) — at the standard rent-burdened threshold; future hikes will face affordability resistance.
Forward outlook
- Local home prices are declining (-3.0%/yr); year-one equity from $899 of loan paydown is wiped out by about $4k of value loss. Plan a longer hold.
- At projected returns (-3.0% appreciation + 3.0% rent growth), your $36k cash investment doubles in ~8 years — after that, you're playing with house money.
Negotiation context
- It's been on market 35 days — a 3% lower offer ($126k) is reasonable based on typical stale-listing flexibility.
- 6 sale attempts since 13y ago with the ask held roughly flat each time — persistent listings suggest the price (not the market) is what's stuck; bring a comps-based counter.
- Current owner paid $88k; 47% above their basis — modest negotiation headroom, anchor on the comps not their cost.
Risks & watch-outs
- Climate carrying-cost: major wind risk, 69% chance of damaging wind over 30y; extreme-heat days projected 7→20/yr by 2055 (HVAC capex compounding) — expect insurance premiums to compound above CPI over the hold.
Questions for the listing agent
- It's been on market 35 days. Have you received any prior offers? Is the seller open to a 3% concession, seller financing, or rate buy-down credit?
- Is there a deadline driving the sale (1031 exchange, divorce, estate, relocation)? That informs how much negotiation room exists.
- What's the average days-on-market for RENTAL listings here right now (not sales)? A rising rental-DOM trend means longer vacancies and softer asking-rent achievability than the comps imply.
- What's the recent tenant-quality profile in this submarket — average credit score on applications, eviction rate, late-payment / NSF rate, and stable-employment percentage? A property-management company in the area should have these aggregated.
- How much new for-sale + rental construction is in the pipeline within 1–3 miles? Heavy new supply typically softens prices + rents 12–24 months out; constrained supply supports both.
Investment metrics
- 1% rule
- 1.22% ✓
- Cap rate
- 10.58%
- Cash-on-cash
- 15.32%
- DSCR
- 1.68
- GRM
- 6.8
CMA / ARV
No comps found within radius.
Projected returns pro-forma
-3.0% appreciation · 3.0% rent growth · sell at horizon
- IRR
- 6.0%
- Equity multiple
- 1.23×
- Total profit
- $8,485
- Equity at exit
- $19,383
- IRR
- 15.4%
- Equity multiple
- 2.25×
- Total profit
- $45,326
- Equity at exit
- $11,240
Cash invested: $36,400 (down + closing). Projections, not guarantees.
Landlord ↔ Tenant lean methodology
- Overall (STATE)
- 90 Strongly Landlord-Friendly
- State Louisiana
- 90 Strongly Landlord-Friendly · R+12
- County
- — inherits STATE
- City
- — inherits STATE
ZIP-level market 71203
- Home prices YoY
- -32.4%
- Active inventory
- 437
- Price-to-rent
- 6.8×
Monthly cashflow live
- Estimated rent
- $1,591 medium interval (Pro) →
- Mortgage (P&I)
- −$682
- Tax from tax record
- −$57 /mo · $680/yr
- Insurance
- −$54
- HOA
- −$0
- Vacancy / Maint / Mgmt
- −$334
- Net cashflow
- $465
Break-even live
UW: 25.0% down · 7.5% · 30yr · 1.5% tax · 5.0% vac · 8.0% maint · 8.0% mgmt
Financing live
Cash to close
- Down payment
- $32,500
- Closing costs
- $3,900
- Reserves months
- —
- Total cash needed
- —
Loan-product check · same deal, 3 products live
Conventional
25% down · 7.5% · 30yr
- Down + closing
- —
- Monthly P&I
- —
- Monthly cashflow
- —
- DSCR
- —
- Eligible?
- —
Personal DTI + credit; lowest rate.
DSCR
20% down · 8.5% · 30yr
- Down + closing
- —
- Monthly P&I
- —
- Monthly cashflow
- —
- DSCR
- —
- Eligible?
- —
No personal income docs; deal must DSCR.
Hard money
10% down · 12.0% · 12mo
- Down + closing
- —
- Monthly P&I
- —
- Monthly cashflow
- —
- DSCR
- —
- Eligible?
- —
Short-term bridge; refi at stabilization.
Listing history 27 events
-
2026-04-16status Pending
-
2026-04-13status Active
-
2026-04-06status Pending
-
2026-03-04$130,000 Active
-
2025-08-06price $150,000
-
2025-07-25price $150,500
-
2025-07-18price $151,000
-
2025-06-30price $151,500
-
2025-06-18price $152,000
-
2025-06-11price $152,500
-
2025-05-05price $153,000
-
2025-05-04$151,000 Active
-
2025-04-16price $153,000
-
2025-02-11price $155,000
-
2025-01-23price $157,000
-
2024-12-03price $160,000
-
2024-11-26price $155,000
-
2024-11-22price $156,000
-
2024-11-19price $158,000
-
2024-11-09price $160,000
-
2024-10-30price $165,000
-
2024-10-19price $168,000
-
2024-10-01$175,000 Active
-
2014-10-17soldstatus $88,500
-
2014-01-24$86,500
-
2013-09-03$86,500
-
2004-11-01soldstatus
ⓘ Source: listings_history table (triggers on properties + properties_extension) + one-shot
backfill from property_details.listing_events for pre-trigger history.
Tax reassessment forecast LA · Resets to sale price
- Current annual tax
- $680 · $57/mo
- Projected year-2 tax
- $715 · $60/mo
- Expected delta
- +$35/yr (+$3/mo · 5.2%)
ⓘ Screening estimate from a state-policy table — verify with the county assessor before closing.
Climate risk First Street
- Flood 1/10 Low FEMA zone X (unshaded) · 0% chance over 30 yrs
- Wildfire 4/10 Moderate
- Heat 7/10 Severe 7 d/yr ≥111°F today · 20 d/yr by 30 yrs out
- Wind 6/10 Major 69% chance of damaging wind over 30 yrs
- Air quality 2/10 Low 0 unhealthy d/yr today · 1 by 30 yrs out
Nearby sold comps map
Loading sold comps map…
Walkable amenities ~0.75 mi
Loading nearby amenities…
Taxation est. · year 1
- Rental income
- $19,096
- − Mortgage interest
- −$7,282
- − Property taxes
- −$680
- − Insurance
- −$650
- − Repairs & maintenance
- −$1,528
- − Management
- −$1,528
- − Depreciation
- −$3,782
- Taxable income
- $3,647
- Est. tax owed @ 24.0%
- −$875
- After-tax cash flow
- $4,700/yr
For passive investors: Depreciation is non-cash, so a rental often shows a tax loss while cash-flowing — sheltering income. Rental losses are passive: they offset passive income freely, and up to $25,000/yr can offset ordinary (W-2) income if you actively participate and your MAGI is under $100k (phasing out to $0 by $150k); unused losses carry forward. On sale, claimed depreciation is recaptured at up to 25%, and gains may owe capital-gains tax (a 1031 exchange can defer both). Figures are a year-1 estimate at your 24.0% rate — not tax advice; consult a CPA.
Schools (NCES district)
- District
- Ouachita Parish
- NCES district ID
- 2201200
- Math proficiency
- 31% ▼ -38.00%
- Reading proficiency
- 45% ▼ -31.00%
- Median HH income
- $43,316
- Composite
- 32.14/100
- National rank
- #5791
- State rank
- #26 of 98 in LA
Livability — Swartz
- Score
- 64/100
- State rank
- #184
- US rank
- #14862
Category grades
Schools grade is shown separately in the Schools card above.
Census & demographics
- Census place
- Swartz, LA
- County
- Ouachita Parish · 118,340 people
- Metro
- Monroe, LA
- Population (ZIP)
- 38,354
- Household income
- $52,326
- Rent vs Own
- Severe rent burden
- 2085.0
Population outlook (Ouachita County) Hauer SSP2
- Today (2025)
- 163,370 people
- By 2030
- 165,520 · +1.3%
- By 2040
- 167,652 · +2.6%
- By 2050
- 166,699 · +2.0%
- By 2075
- 156,348 · -4.3%
- By 2100
- 134,102 · -17.9%
Race, ethnicity, and origin ACS 2023
- Neighborhood character
- Diverse neighborhood (Simpson 0.57)
- Race & ethnicity
- Black 48% White 45% Two or more races 4% Hispanic / Latino 3% Asian 1%
- Common ancestry
- Lithuanian 3% Slovak 1% Serbian 1%
- Foreign-born
- 3% · Canada
- Languages at home
- 96% English-only · Spanish 2% Other Indo-European 1%
Political lean MEDSL · Ouachita
- 2024 margin
- Strong R (+27.9) · D 35.5% · R 63.3% · Other 1.2%
- 2008→2024 swing
- -2.7pp toward R · 2008: -25.2pp · 2024: -27.9pp
- All cycles
- 2024: R+27.9 2020: R+23.6 2016: R+25.4 2012: R+20.9 2008: R+25.2
Not yet ingested
- Civics
- —
Market trends
- HPI YoY
- ▼ -99.01%
- Current HPI
- 206.1948
- Rent YoY
- —
- Metro
- Monroe, LA
- State GDP YoY
- ▲ 3.29%
- F500 in state
- 10
Industry mix (Fortune 500 HQ in LA)
| Industry | F500 HQs | Revenue |
|---|---|---|
| Telecommunications | 2 | $23B |
|
||
| Utilities | 1 | $12B |
|
||
| Wholesale / Distribution | 1 | $5B |
|
||
| Advertising | 1 | $2B |
|
||
Price history
+50.3% since first listed27 events — show timeline
- 2026-04-16 Pending — NELABOR
- 2026-04-13 Relisted — NELABOR
- 2026-04-06 Pending — NELABOR
- 2026-03-04 Listed $130,000 NELABOR
- 2025-08-06 Price Changed $150,000 NELABOR
- 2025-07-25 Price Changed $150,500 NELABOR
- 2025-07-18 Price Changed $151,000 NELABOR
- 2025-06-30 Price Changed $151,500 NELABOR
- 2025-06-18 Price Changed $152,000 NELABOR
- 2025-06-11 Price Changed $152,500 NELABOR
- 2025-05-05 Price Changed $153,000 NELABOR
- 2025-05-04 Listed $151,000 NELABOR
- 2025-04-16 Price Changed $153,000 NELABOR
- 2025-02-11 Price Changed $155,000 NELABOR
- 2025-01-23 Price Changed $157,000 NELABOR
- 2024-12-03 Price Changed $160,000 NELABOR
- 2024-11-26 Price Changed $155,000 NELABOR
- 2024-11-22 Price Changed $156,000 NELABOR
- 2024-11-19 Price Changed $158,000 NELABOR
- 2024-11-09 Price Changed $160,000 NELABOR
- 2024-10-30 Price Changed $165,000 NELABOR
- 2024-10-19 Price Changed $168,000 NELABOR
- 2024-10-01 Listed $175,000 NELABOR
- 2014-10-17 Sold (Public Records) $88,500 Public Records
- 2014-01-24 Listed $86,500 NELABOR
- 2013-09-03 Listed $86,500 NELABOR
- 2004-11-01 Sold (Public Records) — Public Records
Property tax history
+4.4%/yrLatest (2025): $680 · -0.7% YoY. Source: county tax records.
Cash-flow waterfall
monthlySold comps — $/sqft
last 12 mo · ≤1 miLoading sold comps…