24 N Garo Ave · Colorado Springs, CO
Flood risk 1/10 · Minimal
- FEMA flood zone
- X (unshaded)
- Chance of flooding over 30 yrs
- 0.0%
- Est. flood insurance / yr
- $473 – $860
Fire risk 1/10 · Minimal
- Est. fire insurance / yr
- $939 – $1,743
Heat risk 2/10 · Minimal
- Hot days now (above 89°F)
- 7 days/yr
- Hot days in 30 yrs
- 17 days/yr
Wind risk 2/10 · Minimal
- Chance of severe wind over 30 yrs
- —
Air-quality risk 1/10 · Minimal
- Unhealthy air days now
- 0 days/yr
- Unhealthy air days in 30 yrs
- 0 days/yr
Risk factors via First Street. Map © Google.
Why this score? — see what drove the B- grade
The composite is a weighted blend of 9 inputs, each scored 0–100. Each bar is that input's sub-score; the figure is the points it added to the 100-point composite (weight × sub-score).
- Cash flow +30.0/30.0
- DSCR +10.0/10.0
- 1% rule +8.3/10.0
- ARV discount +7.5/15.0
- Livability +3.9/5.0
- Rent growth +3.0/5.0
- Schools +2.5/10.0
- Condition / age +2.5/5.0
- Appreciation +0.0/10.0
$152,900
🖨 Deal sheet 📄 Offer letter ✓ Due diligence
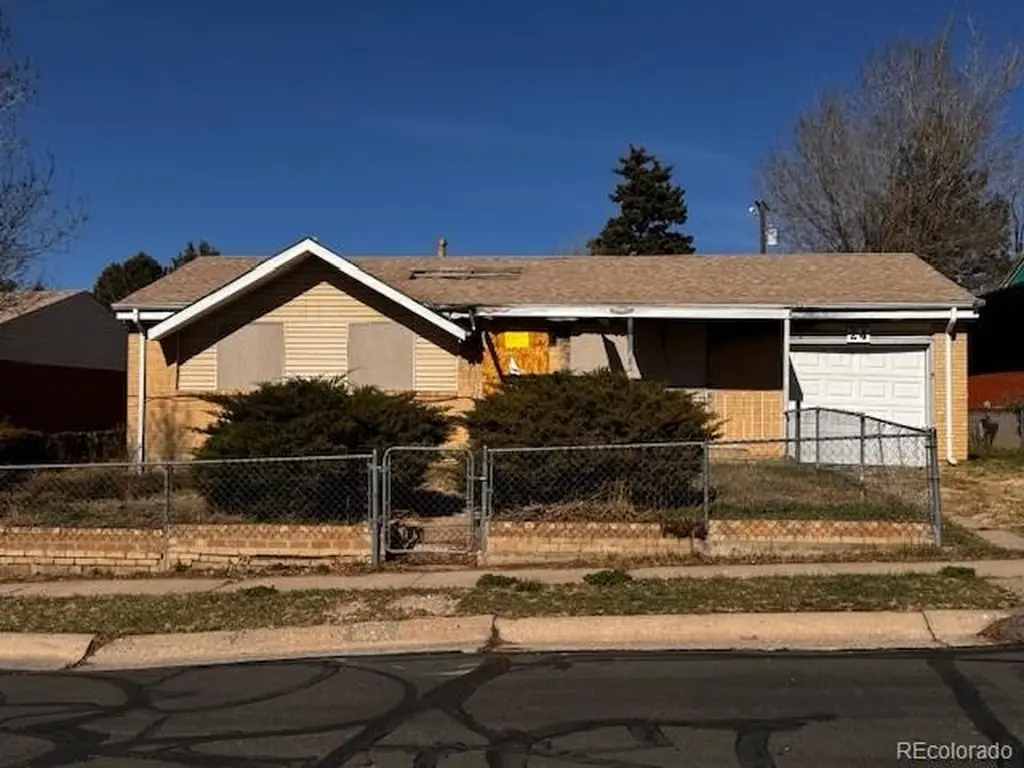
Listing remarks MLS
Formerly a 3 bed, 1.5 bath home with finished basement, large lot and separate our building/shop/garage. This is a Bank Approved Short sale. This home has been in a fire. Call Listing agent for more information.
Key facts
- 8,352 sq ft lot
- Garage
- Built 1959
Property features AI
Exterior
- Parking: Attached 1-car garage; One parking space total
- Utilities: Electricity available; Natural gas available
- Home design: Single-family residence; One story; Property is unattached; Owned by Bank/GSE
- Construction: Brick and wood siding exterior; Composition roof; House structure
- Exterior features: Public water; Public sewer; Lot is approximately 0.19 acres; Zoned R-1 6
Interior
- Kitchen: Kitchen on the main level
- Bedrooms: Three bedrooms total — two on the main level and one in the basement
- Bathrooms: Two bathrooms total — one full bath on the main level and one half bath in the basement
- Heating & cooling: Forced air heating
- Interior features: Full basement
Neighborhood map
What this means for you Summary
Snapshot
- This is a 3-bed/2.0-bath single-family listed at $153k.
Deal economics
- At list price, monthly cash flow is $596 ($7k/yr) — positive.
- The deal already cash-flows at list — no discount required.
- Meets the 1% rule at list price ($2k rent vs $153k).
- Recommended offer: $148k (3.0% below list) — sets the bar for market timing.
- Cap rate 11.0% vs local median 3.3% in Colorado Springs — top-decile yield for the area; either an underpriced asset or a hidden risk that comps aren't pricing in. Stress-test before assuming the spread holds.
Location & tenants
- Location reads 78/100 on livability (#23 in CO, #2,639 nationally) — a middle-class / working-renter tenant base. Strengths: amenities A+, housing A+, health & safety A+; Watch: cost of living C-, crime F.
- Colorado Springs School District No. 11 In The County Of E (urban): math 20% / reading 37% proficiency, ranked #56 of 86 in CO (top 65%) — low school quality limits family demand, transient renter base, plan for 1-2y turnover.
- Zoned schools: Rogers Elementary School (math 5% / reading 12%, grade F, #922 of 966 statewide, top 97%, 295 students, 79% FRL); Galileo School of Math And Science (math 2% / reading 12%, grade F, #260 of 270 statewide, top 99%, 382 students, 84% FRL); Palmer High School (math 26% / reading 58%, grade F, #155 of 381 statewide, top 42%, 1,384 students, 55% FRL) — zoned schools average 73% FRL vs 49% district-wide (24 pts higher); higher-poverty schools than district average — tighter screening recommended.
- Market conditions: Rents rising (+1.9%/yr); 180 active listings in the ZIP; 19 comparable units currently listed for rent nearby; rentals at typical pace (median 14d on market — plan ~3-4 weeks tenant-placement turnaround); 3,906 units permitted in El Paso County in 2024 (872 in 5+ unit buildings).
- This rent runs 38% of the median local income ($64k/yr) — at the standard rent-burdened threshold; future hikes will face affordability resistance.
Forward outlook
- Local home prices are declining (-3.0%/yr); year-one equity from $1k of loan paydown is wiped out by about $5k of value loss. Plan a longer hold.
- El Paso County population projected at +28% by 2050 — long-run rental-demand tailwind backs the buy-and-hold thesis.
- At projected returns (-3.0% appreciation + 1.9% rent growth), your $43k cash investment doubles in ~8 years — after that, you're playing with house money.
Negotiation context
- It's been on market 57 days — a 3% lower offer ($148k) is reasonable based on typical stale-listing flexibility.
- 6 sale attempts; this cycle's ask has dropped $27k (15%) from the opening price — seller is motivated, your offer sets the floor, not the list.
- Current owner paid $18k; list at $153k implies a 749% gain — meaningful room to come down on a strong offer.
Risks & watch-outs
- Watch-outs: built in 1959 — expect roof / HVAC / electrical / plumbing capex.
Questions for the listing agent
- It's been on market 57 days. Have you received any prior offers? Is the seller open to a 3% concession, seller financing, or rate buy-down credit?
- Built in 1959 — when were the roof, HVAC, electrical panel, plumbing, and water heater last replaced?
- Is there a deadline driving the sale (1031 exchange, divorce, estate, relocation)? That informs how much negotiation room exists.
- Schools are B-rated — typically a magnet for longer-tenancy family renters. What's the average tenant stay here, and is there a school-zone premium baked into asking?
- Crime grade is F in this area — have there been break-ins, vandalism, or insurance claims at this property in the last 3 years? What carrier currently insures it and at what premium?
- What's the average days-on-market for RENTAL listings here right now (not sales)? A rising rental-DOM trend means longer vacancies and softer asking-rent achievability than the comps imply.
- What's the recent tenant-quality profile in this submarket — average credit score on applications, eviction rate, late-payment / NSF rate, and stable-employment percentage? A property-management company in the area should have these aggregated.
- How much new for-sale + rental construction is in the pipeline within 1–3 miles? Heavy new supply typically softens prices + rents 12–24 months out; constrained supply supports both.
Investment metrics
- 1% rule
- 1.33% ✓
- Cap rate
- 10.97%
- Cash-on-cash
- 16.70%
- DSCR
- 1.74
- GRM
- 6.3
CMA / ARV
- ARV (on-the-fly)
- $359,568
- Comps found
- 12
Show comp detail 12 sales within ~0.75 mi
| Address | Dist | Beds/Ba | Sqft | Sold | Price | $/sf | Match |
|---|---|---|---|---|---|---|---|
| 2531 Gunnison St | 0.22mi | 3/1.0 | 1,844 (+2%) | 2mo | $360,000 | $195 | 81 |
| 120 N Hayman Ave | 0.12mi | 3/2.0 | 1,694 (-7%) | 7mo | $370,000 | $218 | 77 |
| 10 N Garo Ave | 0.06mi | 4/2.0 (+1) | 2,050 (+13%) | 0mo | $337,000 | $164 | 71 |
| 26 Arrawanna St | 0.43mi | 3/2.0 | 1,689 (-7%) | 2mo | $335,000 | $198 | 67 |
| 10 S Roosevelt St | 0.61mi | 4/2.0 (+1) | 1,834 (+1%) | 3mo | $360,000 | $196 | 63 |
| 3231 Michigan Ave | 0.72mi | 4/2.0 (+1) | 1,821 (+0%) | 2mo | $360,000 | $198 | 59 |
| 17 N Claremont St | 0.67mi | 4/2.0 (+1) | 1,800 (-1%) | 5mo | $385,000 | $214 | 58 |
| 815 East Hills Rd | 0.73mi | 3/2.0 | 1,720 (-5%) | 5mo | $367,000 | $213 | 53 |
| 2415 E Willamette Ave | 0.54mi | 4/2.5 (+1) | 1,956 (+8%) | 4mo | $365,000 | $187 | 51 |
| 2459 E Willamette Ave | 0.49mi | 3/1.0 | 1,598 (-12%) | 5mo | $325,000 | $203 | 49 |
| 123 S Brentwood Dr | 0.61mi | 4/2.0 (+1) | 2,080 (+14%) | 1mo | $203,000 | $98 | 42 |
| 604 Bryce Dr | 0.74mi | 4/3.0 (+1) | 1,599 (-12%) | 4mo | $310,000 | $194 | 33 |
Match score weights: distance 35% · size 25% · config 20% · recency 20%. Top-matched comps best support the ARV.
Projected returns pro-forma
-3.0% appreciation · 1.87% rent growth · sell at horizon
- IRR
- 6.6%
- Equity multiple
- 1.25×
- Total profit
- $10,882
- Equity at exit
- $22,798
- IRR
- 15.0%
- Equity multiple
- 2.15×
- Total profit
- $49,175
- Equity at exit
- $13,220
Cash invested: $42,812 (down + closing). Projections, not guarantees.
Landlord ↔ Tenant lean methodology
- Overall (STATE)
- 38 Tenant-Leaning
- State Colorado
- 38 Tenant-Leaning · D+4
- County
- — inherits STATE
- City
- — inherits STATE
ZIP-level market 80909
- Rents YoY
- 1.9%
- Active inventory
- 180
- Price-to-rent
- 6.3×
Monthly cashflow live
- Estimated rent
- $2,031 high interval (Pro) →
- Mortgage (P&I)
- −$802
- Tax from tax record
- −$144 /mo · $1,724/yr
- Insurance
- −$64
- HOA
- −$0
- Vacancy / Maint / Mgmt
- −$427
- Net cashflow
- $596
Break-even live
UW: 25.0% down · 7.5% · 30yr · 1.5% tax · 5.0% vac · 8.0% maint · 8.0% mgmt
Financing live
Cash to close
- Down payment
- $38,225
- Closing costs
- $4,587
- Reserves months
- —
- Total cash needed
- —
Loan-product check · same deal, 3 products live
Conventional
25% down · 7.5% · 30yr
- Down + closing
- —
- Monthly P&I
- —
- Monthly cashflow
- —
- DSCR
- —
- Eligible?
- —
Personal DTI + credit; lowest rate.
DSCR
20% down · 8.5% · 30yr
- Down + closing
- —
- Monthly P&I
- —
- Monthly cashflow
- —
- DSCR
- —
- Eligible?
- —
No personal income docs; deal must DSCR.
Hard money
10% down · 12.0% · 12mo
- Down + closing
- —
- Monthly P&I
- —
- Monthly cashflow
- —
- DSCR
- —
- Eligible?
- —
Short-term bridge; refi at stabilization.
Rent comps 19 comps
| Address | Beds | Baths | Sqft | Rent | $/sqft | DOM | Units | Dist |
|---|---|---|---|---|---|---|---|---|
| 106 Balfour Ave Colorado Springs, CO | 3.0 | 1.0 | 1391 | $2,000 | $1.44 | 23d | 1 | 0.06mi |
| 2205 Willow Tree Grv Colorado Springs, CO | 1.0–3.0 | 1.0–2.0 | 962 | $2,170 | $2.25 | 3d | 21 | 0.48mi |
| 2310 E Saint Vrain St Unit 102 Colorado Springs, CO | 2.0 | 1.0 | 1245 | $1,600 | $1.29 | 23d | 1 | 0.55mi |
| 2902 Airport Rd Colorado Springs, CO | 2.0–3.0 | 1.0–2.0 | 1202 | $1,900 | $1.58 | 3d | 2 | 0.59mi |
| 827 Sequoia Dr Colorado Springs, CO | 4.0 | 2.0 | 1694 | $2,700 | $1.59 | 3d | 1 | 1.01mi |
| 3591 Indigo Ridge Pt Colorado Springs, CO | 4.0 | 2.0 | 2040 | $2,195 | $1.08 | 3d | 1 | 1.07mi |
| 213 Audubon Dr Colorado Springs, CO | 3.0 | 3.0 | 2157 | $2,325 | $1.08 | 23d | 1 | 1.10mi |
| 1123 Iowa Ave Colorado Springs, CO | 4.0 | 1.5 | 1900 | $2,400 | $1.26 | 14d | 1 | 1.13mi |
| 913 N Chelton Rd Colorado Springs, CO | 1.0–3.0 | 1.0–2.5 | 1062 | $1,775 | $1.67 | 3d | 5 | 1.15mi |
| 1210 Iowa Ave Colorado Springs, CO | 2.0 | 1.5 | 1300 | $2,126 | $1.64 | 23d | 1 | 1.20mi |
| 1011 N Meade Ave Colorado Springs, CO | 2.0 | 1.0 | 1400 | $3,500 | $2.50 | 14d | 1 | 1.24mi |
| 1114 Wynkoop Dr Colorado Springs, CO | 4.0 | 2.0 | 1600 | $2,000 | $1.25 | 3d | 1 | 1.25mi |
| 3005 E Fountain Blvd Colorado Springs, CO | 3.0 | 1.5 | 1950 | $2,000 | $1.03 | 14d | 1 | 1.29mi |
| 1117 E Platte Ave Colorado Springs, CO | 4.0 | 2.0 | 1988 | $2,600 | $1.31 | 23d | 1 | 1.37mi |
| 1305 Wynkoop Dr Colorado Springs, CO | 4.0 | 3.0 | 1810 | $2,480 | $1.37 | 21d | 1 | 1.39mi |
| 1428 Bellaire Dr Colorado Springs, CO | 3.0 | 2.0 | 2100 | $2,650 | $1.26 | 14d | 1 | 1.44mi |
| 3125 E Fountain Blvd Colorado Springs, CO | 2.0–3.0 | 1.5 | 1650 | $1,875 | $1.14 | 2d | 7 | 1.46mi |
| 922 E High St Colorado Springs, CO | 3.0 | 2.0 | 1352 | $2,150 | $1.59 | 3d | 1 | 1.47mi |
| 3798 Venice Grv Colorado Springs, CO | 3.0 | 2.5 | 2431 | $2,100 | $0.86 | 23d | 1 | 1.49mi |
Listing history 23 events
-
2026-06-14status $152,900 Pending 57 DOM
-
2026-06-10days on market $152,900 Active 57 DOM
-
2026-06-09days on market $152,900 Active 56 DOM
-
2026-06-08days on market $152,900 Active 55 DOM
-
2026-06-07days on market $152,900 Active 54 DOM
-
2026-06-05days on market $152,900 Active 51 DOM
-
2026-06-03pricedays on market $152,900 Active 50 DOM
-
2026-06-03days on market $164,900 Active 49 DOM
-
2026-06-01days on market $164,900 Active 48 DOM
-
2026-05-31days on market $164,900 Active 47 DOM
-
2026-05-21price $164,900 211-char remark
Show marketing remark (211 chars)
Formerly a 3 bed, 1.5 bath home with finished basement, large lot and separate our building/shop/garage. This is a Bank Approved Short sale. This home has been in a fire. Call Listing agent for more information.
-
2026-05-21price $164,900 211-char remark
Show marketing remark (211 chars)
Formerly a 3 bed, 1.5 bath home with finished basement, large lot and separate our building/shop/garage. This is a Bank Approved Short sale. This home has been in a fire. Call Listing agent for more information.
-
2026-05-21price $164,900 211-char remark
Show marketing remark (211 chars)
Formerly a 3 bed, 1.5 bath home with finished basement, large lot and separate our building/shop/garage. This is a Bank Approved Short sale. This home has been in a fire. Call Listing agent for more information.
-
2026-04-30status Active 211-char remark
Show marketing remark (211 chars)
Formerly a 3 bed, 1.5 bath home with finished basement, large lot and separate our building/shop/garage. This is a Bank Approved Short sale. This home has been in a fire. Call Listing agent for more information.
-
2026-04-30status Active 211-char remark
Show marketing remark (211 chars)
Formerly a 3 bed, 1.5 bath home with finished basement, large lot and separate our building/shop/garage. This is a Bank Approved Short sale. This home has been in a fire. Call Listing agent for more information.
-
2026-04-30status Active 211-char remark
Show marketing remark (211 chars)
Formerly a 3 bed, 1.5 bath home with finished basement, large lot and separate our building/shop/garage. This is a Bank Approved Short sale. This home has been in a fire. Call Listing agent for more information.
-
2026-04-16status Pending 211-char remark
Show marketing remark (211 chars)
Formerly a 3 bed, 1.5 bath home with finished basement, large lot and separate our building/shop/garage. This is a Bank Approved Short sale. This home has been in a fire. Call Listing agent for more information.
-
2026-04-16status Pending 211-char remark
Show marketing remark (211 chars)
Formerly a 3 bed, 1.5 bath home with finished basement, large lot and separate our building/shop/garage. This is a Bank Approved Short sale. This home has been in a fire. Call Listing agent for more information.
-
2026-04-16historical Under Contract - Showing 211-char remark
Show marketing remark (211 chars)
Formerly a 3 bed, 1.5 bath home with finished basement, large lot and separate our building/shop/garage. This is a Bank Approved Short sale. This home has been in a fire. Call Listing agent for more information.
-
2026-03-31$179,900 Active 211-char remark
Show marketing remark (211 chars)
Formerly a 3 bed, 1.5 bath home with finished basement, large lot and separate our building/shop/garage. This is a Bank Approved Short sale. This home has been in a fire. Call Listing agent for more information.
-
2026-03-31$179,900 Active 211-char remark
Show marketing remark (211 chars)
Formerly a 3 bed, 1.5 bath home with finished basement, large lot and separate our building/shop/garage. This is a Bank Approved Short sale. This home has been in a fire. Call Listing agent for more information.
-
2026-03-29$179,900 Active 211-char remark
Show marketing remark (211 chars)
Formerly a 3 bed, 1.5 bath home with finished basement, large lot and separate our building/shop/garage. This is a Bank Approved Short sale. This home has been in a fire. Call Listing agent for more information.
-
1968-04-01soldstatus $18,000
ⓘ Source: listings_history table (triggers on properties + properties_extension) + one-shot
backfill from property_details.listing_events for pre-trigger history.
Tax reassessment forecast CO · Resets to sale price
- Current annual tax
- $1,724 · $144/mo
- Projected year-2 tax
- $1,724 · $144/mo
- Expected delta
- $0/yr ($0/mo · 0.0%)
ⓘ Screening estimate from a state-policy table — verify with the county assessor before closing.
Climate risk First Street
- Flood 1/10 Low FEMA zone X (unshaded) · 0% chance over 30 yrs
- Wildfire 1/10 Low
- Heat 2/10 Low 7 d/yr ≥89°F today · 17 d/yr by 30 yrs out
- Wind 2/10 Low
- Air quality 1/10 Low 0 unhealthy d/yr today · 0 by 30 yrs out
Nearby sold comps map
Loading sold comps map…
Walkable amenities ~0.75 mi
Loading nearby amenities…
Taxation est. · year 1
- Rental income
- $24,378
- − Mortgage interest
- −$8,565
- − Property taxes
- −$1,724
- − Insurance
- −$764
- − Repairs & maintenance
- −$1,950
- − Management
- −$1,950
- − Depreciation
- −$4,448
- Taxable income
- $4,976
- Est. tax owed @ 24.0%
- −$1,194
- After-tax cash flow
- $5,954/yr
For passive investors: Depreciation is non-cash, so a rental often shows a tax loss while cash-flowing — sheltering income. Rental losses are passive: they offset passive income freely, and up to $25,000/yr can offset ordinary (W-2) income if you actively participate and your MAGI is under $100k (phasing out to $0 by $150k); unused losses carry forward. On sale, claimed depreciation is recaptured at up to 25%, and gains may owe capital-gains tax (a 1031 exchange can defer both). Figures are a year-1 estimate at your 24.0% rate — not tax advice; consult a CPA.
Schools (NCES district)
- District
- Colorado Springs School District No. 11 In The County Of E
- NCES district ID
- 0803060
- Math proficiency
- 20% ▼ -8.00%
- Reading proficiency
- 37% ▼ -4.00%
- Median HH income
- $47,884
- Composite
- 24.69/100
- National rank
- #7613
- State rank
- #56 of 86 in CO
Livability — Colorado Springs
- Score
- 78/100
- State rank
- #23
- US rank
- #2639
Category grades
Schools grade is shown separately in the Schools card above.
Census & demographics
- Census place
- Colorado Springs, CO
- County
- El Paso County · 689,348 people
- City population
- 555,783
- Metro
- Colorado Springs, CO
- Population (ZIP)
- 35,486
- Household income
- $64,035
- Rent vs Own
- Severe rent burden
- 2565.0
Population outlook (El Paso County) Hauer SSP2
- Today (2025)
- 768,926 people
- By 2030
- 815,739 · +6.1%
- By 2040
- 903,489 · +17.5%
- By 2050
- 981,204 · +27.6%
- By 2075
- 1,155,542 · +50.3%
- By 2100
- 1,202,070 · +56.3%
Race, ethnicity, and origin ACS 2023
- Neighborhood character
- Majority White (65%)
- Race & ethnicity
- White 65% Hispanic / Latino 21% Two or more races 13% Black 5% Asian 1%
- Hispanic origin (detail)
- Mexican 13% Puerto Rican 1%
- Common ancestry
- Romanian 2% Slovak 2% Lithuanian 2%
- Foreign-born
- 5% · Canada
- Languages at home
- 90% English-only · Spanish 8% German/W. Germanic 1%
Political lean MEDSL · El Paso
- 2024 margin
- Lean R (+9.8) · D 43.8% · R 53.5% · Other 2.7%
- 2008→2024 swing
- +9.0pp toward D · 2008: -18.8pp · 2024: -9.8pp
- All cycles
- 2024: R+9.8 2020: R+10.8 2016: R+22.6 2012: R+21.4 2008: R+18.8
Not yet ingested
- Civics
- —
Market trends
- HPI YoY
- ▼ -363.33%
- Current HPI
- 276.1246
- Rent YoY
- ▲ 1.87%
- Metro
- Colorado Springs, CO
- State GDP YoY
- ▲ 1.95%
- F500 in state
- 14
Industry mix (Fortune 500 HQ in CO)
| Industry | F500 HQs | Revenue |
|---|---|---|
| Technology Distribution | 1 | $31B |
|
||
| Food / Agriculture | 1 | $18B |
|
||
| Packaging | 1 | $14B |
|
||
| Healthcare | 1 | $13B |
|
||
| Energy | 1 | $10B |
|
||
| Technology | 1 | $4B |
|
||
Price history
+816.1% since first listed13 events — show timeline
- 2026-05-21 Price Changed $164,900 elevateMLS
- 2026-05-21 Price Changed $164,900 IRES
- 2026-05-21 Price Changed $164,900 REColorado as Distributed by MLS Grid
- 2026-04-30 Relisted — IRES
- 2026-04-30 Relisted — REColorado as Distributed by MLS Grid
- 2026-04-30 Relisted — elevateMLS
- 2026-04-16 Pending — IRES
- 2026-04-16 Pending — REColorado as Distributed by MLS Grid
- 2026-04-16 Contingent — elevateMLS
- 2026-03-31 Listed $179,900 REColorado as Distributed by MLS Grid
- 2026-03-31 Listed $179,900 IRES
- 2026-03-29 Listed $179,900 elevateMLS
- 1968-04-01 Sold (Public Records) $18,000 Public Records
Property tax history
+6.4%/yrLatest (2024): $1,724 · -54.4% YoY. Source: county tax records.
Cash-flow waterfall
monthlySold comps — $/sqft
last 12 mo · ≤1 miLoading sold comps…