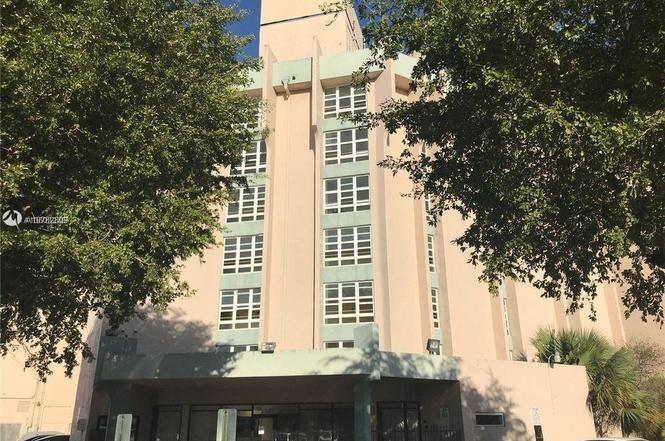
9682 Fontainebleau Blvd #401 · Fountainebleau, FL
Flood risk 1/10 · Minimal
- FEMA flood zone
- X (unshaded)
- Chance of flooding over 30 yrs
- 0.0%
- Est. flood insurance / yr
- $507 – $1,088
Fire risk 1/10 · Minimal
- Est. fire insurance / yr
- $947 – $1,759
Heat risk 10/10 · Severe
- Hot days now (above 105°F)
- 7 days/yr
- Hot days in 30 yrs
- 28 days/yr
Wind risk 10/10 · Severe
- Chance of severe wind over 30 yrs
- 99.0%
Air-quality risk 2/10 · Minimal
- Unhealthy air days now
- 1 days/yr
- Unhealthy air days in 30 yrs
- 1 days/yr
Risk factors via First Street. Map © Google.
Why this score? — see what drove the D grade
The composite is a weighted blend of 9 inputs, each scored 0–100. Each bar is that input's sub-score; the figure is the points it added to the 100-point composite (weight × sub-score).
- Cash flow +10.3/30.0
- ARV discount +7.5/15.0
- 1% rule +4.8/10.0
- Schools +4.2/10.0
- Livability +4.0/5.0
- Appreciation +3.1/10.0
- DSCR +2.9/10.0
- Condition / age +2.5/5.0
- Rent growth +2.1/5.0
$215,000
🖨 Deal sheet (PDF) 📄 Offer letter ✓ Due diligence
Listing remarks MLS
Excellent Bright & Spacious 1/1 apartment. Panoramic views of the lake from your living room bedroom, with balcony. Prestigious location. Peaceful building close to all main highways, Minutes from the Palmetto and 836, excellent schools, gym, shopping, close to the Airport, FIU Building Association voted to have no reserves. Lender will require 20 to 25% Dow Payment. Great Location. ! Investment opportunity, Investor opportunity
Key facts
- Close to airport
- Balcony
- Panoramic views
Tags
Property features AI
Finance
- Financial info: Pets not allowed
- HOA & community: Monthly association fee; Association amenities include pool; Association fee applies
Exterior
- Parking: 1 covered garage space
- Security: Phone entry
- Utilities: Electric cooling
- Home design: Attached property; 7-story building; Entry on level 4; Resale unit
- Construction: Block construction
- Exterior features: Balcony (open); Lagoon waterfront
Interior
- Kitchen: Dishwasher; Electric range; Microwave; Refrigerator
- Flooring: Ceramic tile
- Bathrooms: 1 full bathroom
- Heating & cooling: Electric cooling
- Interior features: First-floor entry; Ceramic tile flooring
Neighborhood map
What this means for you Summary
Snapshot
- This is a 1-bed/1.0-bath condo listed at $215k.
Deal economics
- At list price, monthly cash flow is $-119 ($-1k/yr) — negative.
- To cash-flow at today's rent, offer at most $194k (9.7% below list).
- To meet the 1% rule (rent ≥ 1% of price), the offer needs to be $211k (1.7% below list).
- Recommended offer: $189k (12.0% below list) — sets the bar for market timing.
- Cap rate 5.6% vs local median 3.8% in Fountainebleau — top-decile yield for the area; either an underpriced asset or a hidden risk that comps aren't pricing in. Stress-test before assuming the spread holds.
Location & tenants
- Location reads 81/100 on livability (#87 in FL, #1,407 nationally) — a professional / high-income tenant draw. Strengths: commute A+, housing A+, health & safety A+; Watch: amenities F.
- Miami-Dade (suburban): math 45% / reading 54% proficiency, ranked #40 of 73 in FL (top 55%) — families likely to look elsewhere, expect single-tenant / working-renter base with shorter leases; 64% free/reduced lunch — lower-income household profile, screen leases tightly.
- Zoned schools: E.W.F. Stirrup Elementary School (math 63% / reading 64%, grade B, #564 of 2,144 statewide, top 27%, 645 students, 57% FRL); Ruben Dario Middle School (math 32% / reading 45%, grade F, #384 of 571 statewide, top 68%, 549 students, 62% FRL); Miami Coral Park Senior High (math 25% / reading 44%, grade F, #386 of 667 statewide, top 59%, 2,190 students, 59% FRL) — zoned schools at 59% FRL track the district average.
- Market conditions: Rents soft (-1.5%/yr); 156 active listings in the ZIP; 40 comparable units currently listed for rent nearby; rentals at typical pace (median 17d on market — plan ~3-4 weeks tenant-placement turnaround); 10,051 units permitted in Miami-Dade County in 2024 (7,758 in 5+ unit buildings).
- This rent runs 40% of the median local income ($63k/yr) — at the standard rent-burdened threshold; future hikes will face affordability resistance.
Forward outlook
- Local home prices are declining (-3.0%/yr); year-one equity from $1k of loan paydown is wiped out by about $6k of value loss. Plan a longer hold.
- Miami-Dade County population projected at +28% by 2050 — long-run rental-demand tailwind backs the buy-and-hold thesis.
Negotiation context
- It's been on market 299 days — a 12% lower offer ($189k) is reasonable based on typical stale-listing flexibility.
- 2 sale attempts since 7y ago; this cycle's ask has dropped $45k (17%) from the opening price — seller is motivated, your offer sets the floor, not the list.
- Current owner paid $155k; 39% above their basis — modest negotiation headroom, anchor on the comps not their cost.
Risks & watch-outs
- Watch-outs: HOA is 21% of rent.
- Climate carrying-cost: severe wind risk, 99% chance of damaging wind over 30y; extreme-heat days projected 7→28/yr by 2055 (HVAC capex compounding) — expect insurance premiums to compound above CPI over the hold.
Questions for the listing agent
- What do current leases actually rent for vs. the listed asking? Can we see a recent rent roll and the last 12 months of T-12 income?
- It's been on market 299 days. Have you received any prior offers? Is the seller open to a 12% concession, seller financing, or rate buy-down credit?
- Built in 1974 — when were the roof, HVAC, electrical panel, plumbing, and water heater last replaced?
- What does the HOA fee cover, when was the last increase, and are there any pending special assessments or reserve-fund shortfalls?
- Any open or pending special assessments — roof, HVAC, plumbing, elevator, façade? What's the per-unit balance and payoff schedule, and is the seller paying it off at close or rolling it to the buyer?
- Why hasn't it sold? Are there any deal-killer items the seller is aware of (foundation, flood, title, zoning, code violations)?
- Is there a deadline driving the sale (1031 exchange, divorce, estate, relocation)? That informs how much negotiation room exists.
- The area grade is low — what's the realistic commute time and amenity access for the typical tenant pool here? Any planned neighborhood developments (good or bad) we should know about?
- What's the average days-on-market for RENTAL listings here right now (not sales)? A rising rental-DOM trend means longer vacancies and softer asking-rent achievability than the comps imply.
- What's the recent tenant-quality profile in this submarket — average credit score on applications, eviction rate, late-payment / NSF rate, and stable-employment percentage? A property-management company in the area should have these aggregated.
- How much new apartment / multifamily construction is in the pipeline within 1–3 miles? Heavy new supply (>2% of stock underway) typically softens rents 12–24 months out; light construction supports rent growth.
Investment metrics
- 1% rule
- 0.98% ✗
- Cap rate
- 5.63%
- Cash-on-cash
- -2.36%
- DSCR
- 0.89
- GRM
- 8.5
CMA / ARV
No comps found within radius.
Projected returns pro-forma
-3.0% appreciation · 0.0% rent growth · sell at horizon
- IRR
- -24.3%
- Equity multiple
- 0.20×
- Total profit
- $-48,371
- Equity at exit
- $32,057
- IRR
- -35.6%
- Equity multiple
- -0.24×
- Total profit
- $-74,901
- Equity at exit
- $18,589
Cash invested: $60,200 (down + closing). Projections, not guarantees.
Landlord ↔ Tenant lean methodology
- Overall (STATE)
- 87 Strongly Landlord-Friendly
- State Florida
- 87 Strongly Landlord-Friendly · R+3
- County
- — inherits STATE
- City
- — inherits STATE
ZIP-level market 33172
- Home prices YoY
- -1.1%
- Rents YoY
- -1.5%
- Active inventory
- 156
- Price-to-rent
- 8.5×
Monthly cashflow live
- Estimated rent
- $2,113 high interval (Pro) →
- Mortgage (P&I)
- −$1,127
- Tax from tax record
- −$119 /mo · $1,429/yr
- Insurance
- −$90
- HOA
- −$452
- Vacancy / Maint / Mgmt
- −$444
- Net cashflow
- $-119
Break-even live
Sensitivity live
| Price | -10% $3 | -5% $-58 | +0% $-119 | +5% $-179 | +10% $-240 |
|---|---|---|---|---|---|
| Rent | -10% $-286 | -5% $-202 | +0% $-119 | +5% $-35 | +10% $48 |
| Rate | -1.0pp $-10 | -0.5pp $-64 | base $-119 | +0.5pp $-174 | +1.0pp $-231 |
UW: 25.0% down · 7.5% · 30yr · 1.5% tax · 5.0% vac · 8.0% maint · 8.0% mgmt
Financing live
Cash to close
- Down payment
- $53,750
- Closing costs
- $6,450
- Reserves months
- —
- Total cash needed
- —
Loan-product check · same deal, 3 products live
Conventional
25% down · 7.5% · 30yr
- Down + closing
- —
- Monthly P&I
- —
- Monthly cashflow
- —
- DSCR
- —
- Eligible?
- —
Personal DTI + credit; lowest rate.
DSCR
20% down · 8.5% · 30yr
- Down + closing
- —
- Monthly P&I
- —
- Monthly cashflow
- —
- DSCR
- —
- Eligible?
- —
No personal income docs; deal must DSCR.
Hard money
10% down · 12.0% · 12mo
- Down + closing
- —
- Monthly P&I
- —
- Monthly cashflow
- —
- DSCR
- —
- Eligible?
- —
Short-term bridge; refi at stabilization.
Rent comps 40 comps
| Address | Beds | Baths | Sqft | Rent | $/sqft | DOM | Units | Dist |
|---|---|---|---|---|---|---|---|---|
| 9682 Fontainebleau Blvd #603 Miami, FL | 2.0 | 2.0 | 914 | $2,295 | $2.51 | 15d | 1 | 0.03mi |
| 9686 Fontainebleau Blvd #301 Miami, FL | 2.0 | 2.0 | 914 | $2,150 | $2.35 | 19d | 1 | 0.09mi |
| 9686 Fontainebleau Blvd #301 Miami, FL | 2.0 | 2.0 | 914 | $2,000 | $2.19 | 9d | 1 | 0.09mi |
| 9688 Fontainebleau Blvd Miami, FL | 1.0 | 1.0 | 813 | $1,862 | $2.29 | 24d | 2 | 0.11mi |
| 9688 Fontainebleau Blvd #706 Miami, FL | 1.0 | 1.0 | 813 | $1,925 | $2.37 | 26d | 1 | 0.12mi |
| 9440 Fontainebleau Blvd #406 Miami, FL | 1.0 | 1.0 | 676 | $1,750 | $2.59 | 5d | 1 | 0.14mi |
| 9440 Fontainebleau Blvd #406 Miami, FL | 1.0 | 1.0 | 676 | $1,750 | $2.59 | 4d | 1 | 0.14mi |
| 9360 Fontainebleau Blvd #309 Miami, FL | 2.0 | 1.0 | 690 | $1,950 | $2.83 | 5d | 1 | 0.19mi |
| 9701 Fontainebleau Blvd Unit C203 Miami, FL | 2.0 | 2.0 | 1067 | $2,400 | $2.25 | 9d | 1 | 0.21mi |
| 9701 Fontainebleau Blvd Unit C203 Miami, FL | 2.0 | 2.0 | 1067 | $2,500 | $2.34 | 26d | 1 | 0.21mi |
| 9517 Fontainebleau Blvd Miami, FL | 3.0 | 1.0–2.0 | 875 | $2,169 | $2.48 | 0d | 36 | 0.22mi |
| 9443 Fontainebleau Blvd Unit 2 Miami, FL | 2.0 | 2.0 | 1000 | $2,400 | $2.40 | 7d | 1 | 0.22mi |
| 9443 Fontainebleau Blvd #209 Miami, FL | 2.0 | 2.0 | 1000 | $2,400 | $2.40 | 26d | 1 | 0.22mi |
| 9350 Fontainebleau Blvd #513 Miami, FL | 2.0 | 1.0 | 690 | $1,700 | $2.46 | 26d | 1 | 0.22mi |
| 9350 Fontainebleau Blvd #204 Miami, FL | 1.0 | 1.0 | 690 | $2,100 | $3.04 | 0d | 1 | 0.22mi |
| 9445 Fontainebleau Blvd #201 Miami, FL | 2.0 | 2.0 | 1000 | $2,300 | $2.30 | 12d | 1 | 0.24mi |
| 9445 Fontainebleau Blvd #201 Miami, FL | 2.0 | 2.0 | 1000 | $2,300 | $2.30 | 21d | 1 | 0.24mi |
| 9711 Fontainebleau Blvd Unit 105D Miami, FL | 2.0 | 1.0 | 999 | $2,350 | $2.35 | 7d | 1 | 0.24mi |
| 9711 Fontainebleau Blvd Unit 105D Miami, FL | 2.0 | 1.0 | 999 | $2,350 | $2.35 | 16d | 1 | 0.24mi |
| 9711 Fontainebleau Blvd Unit D101 Miami, FL | 2.0 | 1.0 | 999 | $2,400 | $2.40 | 26d | 1 | 0.24mi |
| 9711 Fontainebleau Blvd Unit D203 Miami, FL | 2.0 | 2.0 | 1067 | $2,400 | $2.25 | 16d | 1 | 0.24mi |
| 9705 Fontainebleau Blvd Unit B108 Miami, FL | 1.0 | 1.0 | 964 | $2,000 | $2.07 | 13d | 1 | 0.24mi |
| 9715 Fontainebleau Blvd Unit E209 Miami, FL | 2.0 | 2.0 | 1067 | $2,350 | $2.20 | 0d | 1 | 0.27mi |
| 9405 Fontainebleau Blvd #205 Miami, FL | 2.0 | 2.0 | 1000 | $2,350 | $2.35 | 9d | 1 | 0.28mi |
| 9725 Fontainebleau Blvd Unit A212 Miami, FL | 2.0 | 2.0 | 1067 | $2,600 | $2.44 | 26d | 1 | 0.29mi |
| 9407 Fontainebleau Blvd #106 Miami, FL | 2.0 | 2.0 | 1000 | $2,500 | $2.50 | 26d | 1 | 0.31mi |
| 9369 Fontainebleau Blvd Unit J225 Miami, FL | 1.0 | 1.5 | 1125 | $2,150 | $1.91 | 0d | 1 | 0.32mi |
| 9320 Fontainebleau Blvd #301 Miami, FL | 2.0 | 2.0 | 870 | $2,300 | $2.64 | 26d | 1 | 0.32mi |
| 9741 Fontainebleau Blvd Unit H208 Miami, FL | 2.0 | 1.0 | 933 | $2,250 | $2.41 | 26d | 1 | 0.32mi |
| 9320 Fontainebleau Blvd Miami, FL | 2.0 | 2.0 | 870 | $2,225 | $2.56 | 0d | 2 | 0.32mi |
| 9320 Fontainebleau Blvd Miami, FL | 2.0 | 2.0 | 940 | $2,275 | $2.42 | 22d | 2 | 0.32mi |
| 9411 Fontainebleau Blvd #108 Miami, FL | 2.0 | 2.0 | 1000 | $2,450 | $2.45 | 4d | 1 | 0.35mi |
| 9411 Fontainebleau Blvd #108 Miami, FL | 2.0 | 2.0 | 1000 | $2,450 | $2.45 | 24d | 1 | 0.35mi |
| 901 NW 97th Ave Miami, FL | 1.0–3.0 | 1.0–2.0 | 981 | $2,309 | $2.35 | 0d | 35 | 0.35mi |
| 9310 Fontainebleau Blvd Miami, FL | 1.0–2.0 | 1.0 | 690 | $1,800 | $2.61 | 0d | 2 | 0.35mi |
| 9310 Fontainebleau Blvd Miami, FL | 1.0 | 1.0 | 690 | $2,200 | $3.19 | 26d | 1 | 0.35mi |
| 9310 Fontainebleau Blvd Miami, FL | 1.0–2.0 | 1.0 | 690 | $1,800 | $2.61 | 16d | 2 | 0.35mi |
| 9351 Fontainebleau Blvd Miami, FL | 1.0–2.0 | 1.5–2.5 | 1270 | $2,300 | $1.81 | 0d | 2 | 0.37mi |
| 9150 Fontainebleau Blvd Unit 203-2 Miami, FL | 1.0 | 1.0 | 776 | $1,875 | $2.42 | 26d | 1 | 0.38mi |
| 9429 Fontainebleau Blvd Unit 201-33 Miami, FL | 2.0 | 2.0 | 1000 | $2,500 | $2.50 | 16d | 1 | 0.40mi |
HOA detail condo
- Monthly dues
- $452 · $5,424/yr
- Likely covers
- gym
- Assessments
- None detected in remarks — confirm with the listing agent.
Listing history 13 events
-
2026-03-17price $215,000
-
2026-02-20price $230,000
-
2026-01-26price $240,000
-
2026-01-21price $250,000
-
2026-01-20price $230,000
-
2025-12-03price $250,000
-
2025-07-31$260,000 Active
-
2020-04-17soldstatus $155,000
-
2020-04-13soldstatus $155,000 Closed 440-char remark
Show marketing remark (440 chars)
Excellent Bright & Spacious 1/1 apartment. Panoramic views of the lake from your living room bedroom, with balcony. Prestigious location. Peaceful building close to all main highways, Minutes from the Palmetto and 836, excellent schools, gym, shopping, close to the Airport, FIU Building Association voted to have no reserves. Lender will require 20 to 25% Dow Payment. Great Location. ! Investment opportunity, Investor opportunity
-
2019-12-10$155,000 Active 440-char remark
Show marketing remark (440 chars)
Excellent Bright & Spacious 1/1 apartment. Panoramic views of the lake from your living room bedroom, with balcony. Prestigious location. Peaceful building close to all main highways, Minutes from the Palmetto and 836, excellent schools, gym, shopping, close to the Airport, FIU Building Association voted to have no reserves. Lender will require 20 to 25% Dow Payment. Great Location. ! Investment opportunity, Investor opportunity
-
2001-03-29soldstatus $57,000
-
1989-06-09soldstatus $34,000
-
1974-10-01soldstatus $27,300
ⓘ Source: listings_history table (triggers on properties + properties_extension) + one-shot
backfill from property_details.listing_events for pre-trigger history.
Tax reassessment forecast FL · Resets to sale price
- Current annual tax
- $1,429 · $119/mo
- Projected year-2 tax
- $1,784 · $149/mo
- Expected delta
- +$355/yr (+$30/mo · 24.8%)
ⓘ Screening estimate from a state-policy table — verify with the county assessor before closing.
Climate risk First Street
- Flood 1/10 Low FEMA zone X (unshaded) · 0% chance over 30 yrs
- Wildfire 1/10 Low
- Heat 10/10 Extreme 7 d/yr ≥105°F today · 28 d/yr by 30 yrs out
- Wind 10/10 Extreme 99% chance of damaging wind over 30 yrs
- Air quality 2/10 Low 1 unhealthy d/yr today · 1 by 30 yrs out
Nearby sold comps map
Loading sold comps map…
Walkable amenities ~0.75 mi
Loading nearby amenities…
Taxation est. · year 1
- Rental income
- $25,360
- − Mortgage interest
- −$12,043
- − Property taxes
- −$1,429
- − Insurance
- −$1,075
- − Repairs & maintenance
- −$2,029
- − Management
- −$2,029
- − HOA
- −$5,424
- − Depreciation
- −$6,255
- Taxable loss
- −$4,924
- Est. tax savings @ 24.0%
- +$1,182
- After-tax cash flow
- $-242/yr
For passive investors: Depreciation is non-cash, so a rental often shows a tax loss while cash-flowing — sheltering income. Rental losses are passive: they offset passive income freely, and up to $25,000/yr can offset ordinary (W-2) income if you actively participate and your MAGI is under $100k (phasing out to $0 by $150k); unused losses carry forward. On sale, claimed depreciation is recaptured at up to 25%, and gains may owe capital-gains tax (a 1031 exchange can defer both). Figures are a year-1 estimate at your 24.0% rate — not tax advice; consult a CPA.
Schools (NCES district)
- District
- Miami-Dade
- NCES district ID
- 1200390
- Math proficiency
- 45% ▼ -16.00%
- Reading proficiency
- 54% ▼ -5.00%
- Median HH income
- $43,928
- Composite
- 41.76/100
- National rank
- #3397
- State rank
- #40 of 73 in FL
Livability — Fountainebleau
- Score
- 81/100
- State rank
- #87
- US rank
- #1407
Category grades
Schools grade is shown separately in the Schools card above.
Census & demographics
- Census place
- Fountainebleau, FL
- County
- Miami-Dade County · 2,697,751 people
- City population
- 35,056
- Metro
- Miami-Fort Lauderdale-Pompano Beach, FL
- Population (ZIP)
- 39,101
- Household income
- $63,023
- Rent vs Own
- Severe rent burden
- 2678.0
Population outlook (Miami-Dade County) Hauer SSP2
- Today (2025)
- 3,126,439 people
- By 2030
- 3,325,765 · +6.4%
- By 2040
- 3,697,561 · +18.3%
- By 2050
- 4,012,134 · +28.3%
- By 2075
- 4,605,612 · +47.3%
- By 2100
- 4,866,598 · +55.7%
Race, ethnicity, and origin ACS 2023
- Neighborhood character
- Predominantly Hispanic (91%)
- Race & ethnicity
- Hispanic / Latino 91% Two or more races 41% White 4% Asian 3%
- Hispanic origin (detail)
- Mexican 1% Puerto Rican 3% Cuban 41% Dominican 3% Salvadoran 1%
- Foreign-born
- 72% · Canada, Jamaica, Dominican Republic
- Languages at home
- 11% English-only · Spanish 85% Other Indo-European 2% Other Asian/Pacific 1%
Political lean MEDSL · Miami-Dade
- 2024 margin
- R (+11.4) · D 43.9% · R 55.4%
- 2008→2024 swing
- -27.6pp toward R · 2008: 16.1pp · 2024: -11.4pp
- All cycles
- 2024: R+11.4 2020: D+7.3 2016: D+29.6 2012: D+23.7 2008: D+16.1
Not yet ingested
- Civics
- —
Market trends
- HPI YoY
- ▼ -3.72%
- Current HPI
- 324.8183
- Rent YoY
- ▼ -1.51%
- Metro
- Miami-Fort Lauderdale-Pompano Beach, FL
- State GDP YoY
- ▲ 3.28%
- F500 in state
- 36
Industry mix (Fortune 500 HQ in FL)
| Industry | F500 HQs | Revenue |
|---|---|---|
| Industrial Technology | 2 | $29B |
|
||
| Insurance | 2 | $17B |
|
||
| Retail | 1 | $60B |
|
||
| Technology Distribution | 1 | $58B |
|
||
| Homebuilding | 1 | $35B |
|
||
| Technology Manufacturing | 1 | $35B |
|
||
Price history
+687.5% since first listed13 events — show timeline
- 2026-03-17 Price Changed $215,000 MARMLS
- 2026-02-20 Price Changed $230,000 MARMLS
- 2026-01-26 Price Changed $240,000 MARMLS
- 2026-01-21 Price Changed $250,000 MARMLS
- 2026-01-20 Price Changed $230,000 MARMLS
- 2025-12-03 Price Changed $250,000 MARMLS
- 2025-07-31 Listed $260,000 MARMLS
- 2020-04-17 Sold (Public Records) $155,000 Public Records
- 2020-04-13 Sold (MLS) $155,000 MARMLS
- 2019-12-10 Listed $155,000 MARMLS
- 2001-03-29 Sold (Public Records) $57,000 Public Records
- 1989-06-09 Sold (Public Records) $34,000 Public Records
- 1974-10-01 Sold (Public Records) $27,300 Public Records
Property tax history
+3.5%/yrLatest (2025): $1,429 · +3.8% YoY. Source: county tax records.
Cash-flow waterfall
monthlySold comps — $/sqft
last 12 mo · ≤1 miLoading sold comps…