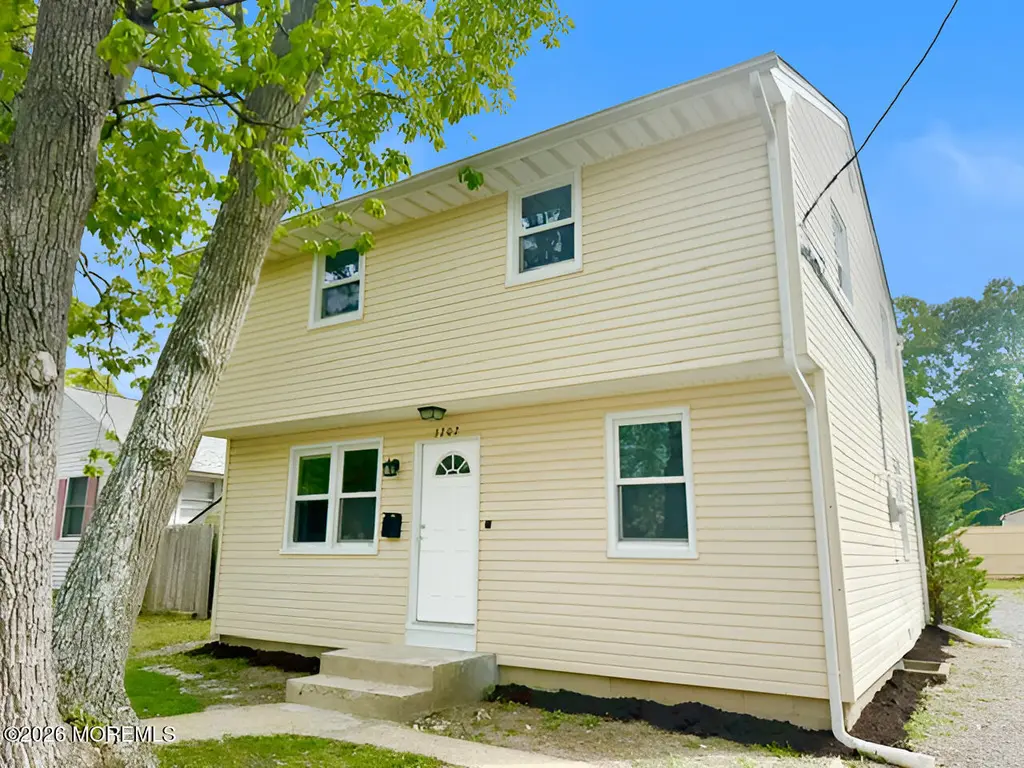
3202 Herbertsville Rd · Point Pleasant, NJ
Flood risk 1/10 · Minimal
- FEMA flood zone
- X (unshaded)
- Chance of flooding over 30 yrs
- 0.0%
- Est. flood insurance / yr
- $507 – $1,088
Fire risk 1/10 · Minimal
- Est. fire insurance / yr
- $526 – $976
Heat risk 8/10 · Major
- Hot days now (above 97°F)
- 7 days/yr
- Hot days in 30 yrs
- 15 days/yr
Wind risk 8/10 · Major
- Chance of severe wind over 30 yrs
- 80.0%
Air-quality risk 3/10 · Minor
- Unhealthy air days now
- 3 days/yr
- Unhealthy air days in 30 yrs
- 5 days/yr
Risk factors via First Street. Map © Google.
Why this score? — see what drove the B grade
The composite is a weighted blend of 9 inputs, each scored 0–100. Each bar is that input's sub-score; the figure is the points it added to the 100-point composite (weight × sub-score).
- Cash flow +26.7/30.0
- ARV discount +15.0/15.0
- DSCR +9.2/10.0
- 1% rule +6.8/10.0
- Rent growth +5.0/5.0
- Schools +4.5/10.0
- Livability +3.8/5.0
- Condition / age +2.5/5.0
- Appreciation +0.0/10.0
$554,900
🖨 Deal sheet (PDF) 📄 Offer letter ✓ Due diligence
Key facts
- Eat-in kitchen
- Convenient location
- Colonial-style home
Tags
Property features AI
Exterior
- Parking: No garage
- Utilities: Public sewer
- Home design: Fee simple ownership
- Exterior features: Shingle roof; Level lot
Interior
- Kitchen: Stove; Stove hood
- Bedrooms: 4 bedrooms
- Flooring: Wood floors
- Bathrooms: 2 full bathrooms; 1 half bathroom
- Heating & cooling: Forced air heating; Central air conditioning
- Interior features: Partial basement; Wood flooring; Stove; Stove hood
Neighborhood map
What this means for you Summary
Snapshot
- This is a 4-bed/2.0-bath single-family listed at $555k.
Deal economics
- At list price, monthly cash flow is $2k ($18k/yr) — positive.
- The deal already cash-flows at list — no discount required.
- Meets the 1% rule at list price ($7k rent vs $555k).
- Recommended offer: $547k (1.5% below list) — sets the bar for market timing.
- Cap rate 9.6% vs local median 2.8% in Point Pleasant — top-decile yield for the area; either an underpriced asset or a hidden risk that comps aren't pricing in. Stress-test before assuming the spread holds.
Location & tenants
- Location reads 76/100 on livability (#136 in NJ, #3,574 nationally) — a middle-class / working-renter tenant base. Strengths: crime A+, employment A+, housing A+; Watch: amenities F, commute F, cost of living F.
- Point Pleasant Borough School District (suburban): math 44% / reading 55% proficiency, ranked #132 of 472 in NJ (top 28%) — families likely to look elsewhere, expect single-tenant / working-renter base with shorter leases; only 10% free/reduced lunch — higher-income household profile.
- Market conditions: Rents rising fast (+11.7%/yr); 163 active listings in the ZIP; 2 comparable units currently listed for rent nearby; high-income renter base; 4,434 units permitted in Ocean County in 2024 (868 in 5+ unit buildings).
- At $6,564/mo this rent would consume 64% of the median local household income ($123k/yr) (locally 388% of renters already pay >50% of income on rent) — very limited rent-growth headroom before tenants either downsize or default.
Forward outlook
- Local home prices are declining (-3.0%/yr); year-one equity from $4k of loan paydown is wiped out by about $17k of value loss. Plan a longer hold.
- Ocean County population projected to shrink 8% by 2050 — rents likely to lag national; underwrite the cash flow, not the appreciation.
- At projected returns (-3.0% appreciation + 8.0% rent growth), your $155k cash investment doubles in ~7 years — after that, you're playing with house money.
Negotiation context
- It's been on market 30 days — a 2% lower offer ($547k) is reasonable based on typical stale-listing flexibility.
- 2 sale attempts since 9y ago with the ask held roughly flat each time — persistent listings suggest the price (not the market) is what's stuck; bring a comps-based counter.
- Current owner paid $275k; list at $555k implies a 102% gain — meaningful room to come down on a strong offer.
Risks & watch-outs
- Watch-outs: built in 1946 — expect roof / HVAC / electrical / plumbing capex.
- Climate carrying-cost: severe wind risk, 80% chance of damaging wind over 30y; extreme-heat days projected 7→15/yr by 2055 (HVAC capex compounding) — expect insurance premiums to compound above CPI over the hold.
Questions for the listing agent
- Built in 1946 — when were the roof, HVAC, electrical panel, plumbing, and water heater last replaced?
- Is there a deadline driving the sale (1031 exchange, divorce, estate, relocation)? That informs how much negotiation room exists.
- Schools are A-rated — typically a magnet for longer-tenancy family renters. What's the average tenant stay here, and is there a school-zone premium baked into asking?
- What's the average days-on-market for RENTAL listings here right now (not sales)? A rising rental-DOM trend means longer vacancies and softer asking-rent achievability than the comps imply.
- What's the recent tenant-quality profile in this submarket — average credit score on applications, eviction rate, late-payment / NSF rate, and stable-employment percentage? A property-management company in the area should have these aggregated.
- How much new for-sale + rental construction is in the pipeline within 1–3 miles? Heavy new supply typically softens prices + rents 12–24 months out; constrained supply supports both.
Investment metrics
- 1% rule
- 1.18% ✓
- Cap rate
- 9.55%
- Cash-on-cash
- 11.64%
- DSCR
- 1.52
- GRM
- 7.0
CMA / ARV
- ARV (on-the-fly)
- $678,496
- Comps found
- 12
Show comp detail 12 sales within ~0.75 mi
| Address | Dist | Beds/Ba | Sqft | Sold | Price | $/sf | Match |
|---|---|---|---|---|---|---|---|
| 3105 Cambridge Dr | 0.21mi | 4/2.0 | 1,450 (-0%) | 4mo | $675,000 | $466 | 87 |
| 539 Summit Dr | 0.27mi | 3/2.0 (-1) | 1,512 (+4%) | 4mo | $765,000 | $506 | 73 |
| 3118 Pocahontas Ave | 0.53mi | 3/2.0 (-1) | 1,448 (-0%) | 8mo | $735,000 | $508 | 63 |
| 601 Marshall Dr | 0.23mi | 3/2.0 (-1) | 1,274 (-12%) | 5mo | $625,000 | $491 | 60 |
| 529 Smith Dr | 0.34mi | 3/2.0 (-1) | 1,568 (+8%) | 8mo | $650,000 | $415 | 59 |
| 303 River Ave | 0.43mi | 4/1.0 | 1,584 (+9%) | 9mo | $699,000 | $441 | 54 |
| 3122 Hiawatha Ave | 0.47mi | 3/1.5 (-1) | 1,566 (+8%) | 10mo | $650,000 | $415 | 50 |
| 326 Oxford Ln | 0.61mi | 3/2.0 (-1) | 1,536 (+6%) | 10mo | $635,000 | $413 | 49 |
| 32 Bay Bridge Dr | 0.68mi | 3/1.5 (-1) | 1,488 (+2%) | 13mo | $605,000 | $407 | 47 |
| 208 Chatham Ln | 0.54mi | 3/2.0 (-1) | 1,591 (+9%) | 9mo | $780,000 | $490 | 47 |
| 1204 Treeneedle Rd | 0.70mi | 3/2.0 (-1) | 1,600 (+10%) | 6mo | $600,000 | $375 | 41 |
| 1203 River Ave | 0.74mi | 3/2.0 (-1) | 1,332 (-8%) | 12mo | $650,000 | $488 | 36 |
Match score weights: distance 35% · size 25% · config 20% · recency 20%. Top-matched comps best support the ARV.
Projected returns pro-forma
-3.0% appreciation · 8.0% rent growth · sell at horizon
- IRR
- 6.4%
- Equity multiple
- 1.26×
- Total profit
- $40,747
- Equity at exit
- $82,737
- IRR
- 19.7%
- Equity multiple
- 3.04×
- Total profit
- $316,950
- Equity at exit
- $47,978
Cash invested: $155,372 (down + closing). Projections, not guarantees.
Landlord ↔ Tenant lean methodology
- Overall (STATE)
- 21 Tenant-Leaning
- State New Jersey
- 21 Tenant-Leaning · D+6
- County
- — inherits STATE
- City
- — inherits STATE
ZIP-level market 08742
- Rents YoY
- 11.7%
- Active inventory
- 163
- Price-to-rent
- 7.0×
Monthly cashflow live
- Estimated rent
- $6,564 medium interval (Pro) →
- Mortgage (P&I)
- −$2,910
- Tax from tax record
- −$537 /mo · $6,445/yr
- Insurance
- −$231
- HOA
- −$0
- Vacancy / Maint / Mgmt
- −$1,378
- Net cashflow
- $1,507
Break-even live
Sensitivity live
| Price | -10% $1,821 | -5% $1,664 | +0% $1,507 | +5% $1,350 | +10% $1,193 |
|---|---|---|---|---|---|
| Rent | -10% $988 | -5% $1,248 | +0% $1,507 | +5% $1,766 | +10% $2,025 |
| Rate | -1.0pp $1,786 | -0.5pp $1,648 | base $1,507 | +0.5pp $1,363 | +1.0pp $1,217 |
UW: 25.0% down · 7.5% · 30yr · 1.5% tax · 5.0% vac · 8.0% maint · 8.0% mgmt
Financing live
Cash to close
- Down payment
- $138,725
- Closing costs
- $16,647
- Reserves months
- —
- Total cash needed
- —
Loan-product check · same deal, 3 products live
Conventional
25% down · 7.5% · 30yr
- Down + closing
- —
- Monthly P&I
- —
- Monthly cashflow
- —
- DSCR
- —
- Eligible?
- —
Personal DTI + credit; lowest rate.
DSCR
20% down · 8.5% · 30yr
- Down + closing
- —
- Monthly P&I
- —
- Monthly cashflow
- —
- DSCR
- —
- Eligible?
- —
No personal income docs; deal must DSCR.
Hard money
10% down · 12.0% · 12mo
- Down + closing
- —
- Monthly P&I
- —
- Monthly cashflow
- —
- DSCR
- —
- Eligible?
- —
Short-term bridge; refi at stabilization.
Rent comps 2 comps
| Address | Beds | Baths | Sqft | Rent | $/sqft | DOM | Units | Dist |
|---|---|---|---|---|---|---|---|---|
| 1414 Treeneedle Rd Point Pleasant Boro, NJ | 3.0 | 2.0 | 1640 | $3,000 | $1.83 | 25d | 1 | 0.90mi |
| 900 Ocean Ave Point Pleasant Beach, NJ | 3.0 | 3.5 | 1716 | $14,250 | $8.30 | 19d | 2 | 1.29mi |
Listing history 19 events
-
2026-06-18days on market $554,900 Active 30 DOM
-
2026-06-17days on market $554,900 Active 29 DOM
-
2026-06-16days on market $554,900 Active 28 DOM
-
2026-06-16price $554,900 Active 27 DOM
-
2026-06-15days on market $569,900 Active 27 DOM
-
2026-06-13days on market $569,900 Active 25 DOM
-
2026-06-09days on market $569,900 Active 21 DOM
-
2026-06-08days on market $569,900 Active 20 DOM
-
2026-06-07days on market $569,900 Active 19 DOM
-
2026-06-04days on market $569,900 Active 16 DOM
-
2026-06-03days on market $569,900 Active 15 DOM
-
2026-06-02days on market $569,900 Active 14 DOM
-
2026-06-01days on market $569,900 Active 13 DOM
-
2026-05-31days on market $569,900 Active 12 DOM
-
2026-05-19$569,900 Active 769-char remark
-
2017-03-13historical
-
2017-03-06price $279,900
-
2017-01-10$299,900 Active
-
2007-11-08soldstatus $275,000
ⓘ Source: listings_history table (triggers on properties + properties_extension) + one-shot
backfill from property_details.listing_events for pre-trigger history.
Tax reassessment forecast NJ · Partial reset (capped growth)
- Current annual tax
- $6,445 · $537/mo
- Projected year-2 tax
- $10,131 · $844/mo
- Expected delta
- +$3,686/yr (+$307/mo · 57.2%)
ⓘ Screening estimate from a state-policy table — verify with the county assessor before closing.
Climate risk First Street
- Flood 1/10 Low FEMA zone X (unshaded) · 0% chance over 30 yrs
- Wildfire 1/10 Low
- Heat 8/10 Severe 7 d/yr ≥97°F today · 15 d/yr by 30 yrs out
- Wind 8/10 Severe 80% chance of damaging wind over 30 yrs
- Air quality 3/10 Moderate 3 unhealthy d/yr today · 5 by 30 yrs out
Nearby sold comps map
Loading sold comps map…
Walkable amenities ~0.75 mi
Loading nearby amenities…
Taxation est. · year 1
- Rental income
- $78,762
- − Mortgage interest
- −$31,083
- − Property taxes
- −$6,445
- − Insurance
- −$2,774
- − Repairs & maintenance
- −$6,301
- − Management
- −$6,301
- − Depreciation
- −$16,143
- Taxable income
- $9,715
- Est. tax owed @ 24.0%
- −$2,332
- After-tax cash flow
- $15,751/yr
For passive investors: Depreciation is non-cash, so a rental often shows a tax loss while cash-flowing — sheltering income. Rental losses are passive: they offset passive income freely, and up to $25,000/yr can offset ordinary (W-2) income if you actively participate and your MAGI is under $100k (phasing out to $0 by $150k); unused losses carry forward. On sale, claimed depreciation is recaptured at up to 25%, and gains may owe capital-gains tax (a 1031 exchange can defer both). Figures are a year-1 estimate at your 24.0% rate — not tax advice; consult a CPA.
Schools (NCES district)
- District
- Point Pleasant Borough School District
- NCES district ID
- 3413290
- Math proficiency
- 44% ▼ -15.00%
- Reading proficiency
- 55% ▼ -11.00%
- Median HH income
- $82,536
- Composite
- 45.44/100
- National rank
- #2619
- State rank
- #132 of 472 in NJ
Livability — Point Pleasant
- Score
- 76/100
- State rank
- #136
- US rank
- #3574
Category grades
Schools grade is shown separately in the Schools card above.
Census & demographics
- Census place
- Point Pleasant, NJ
- County
- Ocean County · 439,426 people
- City population
- 25,732
- Metro
- New York-Newark-Jersey City, NY-NJ-PA
- Population (ZIP)
- 25,732
- Household income
- $123,152
- Rent vs Own
- Severe rent burden
- 388.0
Population outlook (Ocean County) Hauer SSP2
- Today (2025)
- 586,991 people
- By 2030
- 581,403 · -1.0%
- By 2040
- 564,913 · -3.8%
- By 2050
- 538,149 · -8.3%
- By 2075
- 468,845 · -20.1%
- By 2100
- 350,297 · -40.3%
Race, ethnicity, and origin ACS 2023
- Neighborhood character
- Predominantly White (86%)
- Race & ethnicity
- White 86% Hispanic / Latino 10% Two or more races 5% Native American 1%
- Hispanic origin (detail)
- Mexican 4% Puerto Rican 2%
- Common ancestry
- Romanian 6% Slovak 2% Iranian 1%
- Foreign-born
- 8% · Canada, Jamaica
- Languages at home
- 89% English-only · Spanish 8% Russian/Polish/Slavic 1% Other Indo-European 1%
Political lean MEDSL · Ocean
- 2024 margin
- Solid R (+36.0) · D 31.4% · R 67.4% · Other 1.2%
- 2008→2024 swing
- -17.6pp toward R · 2008: -18.4pp · 2024: -36.0pp
- All cycles
- 2024: R+36.0 2020: R+28.7 2016: R+34.0 2012: R+17.7 2008: R+18.4
Not yet ingested
- Civics
- —
Market trends
- HPI YoY
- ▼ -467.19%
- Current HPI
- 389.4401
- Rent YoY
- ▲ 11.65%
- Metro
- New York-Newark-Jersey City, NY-NJ-PA
- State GDP YoY
- ▲ 2.05%
- F500 in state
- 34
Industry mix (Fortune 500 HQ in NJ)
| Industry | F500 HQs | Revenue |
|---|---|---|
| Consumer Goods | 3 | $31B |
|
||
| Pharmaceuticals | 2 | $153B |
|
||
| Technology | 2 | $21B |
|
||
| Insurance | 2 | $20B |
|
||
| Healthcare | 2 | $19B |
|
||
| Financial Services | 1 | $70B |
|
||
Price history
+101.8% since first listed6 events — show timeline
- 2026-06-15 Price Changed $554,900 MOMLS
- 2026-05-19 Listed $569,900 MOMLS
- 2017-03-13 Delisted — MOMLS
- 2017-03-06 Price Changed $279,900 MOMLS
- 2017-01-10 Listed $299,900 MOMLS
- 2007-11-08 Sold (Public Records) $275,000 Public Records
Property tax history
+3.5%/yrLatest (2025): $6,445 · +6.0% YoY. Source: county tax records.
Cash-flow waterfall
monthlySold comps — $/sqft
last 12 mo · ≤1 miLoading sold comps…