338 Summerville Ct · Virginia Beach, VA
Flood risk 1/10 · Minimal
- FEMA flood zone
- X (unshaded)
- Chance of flooding over 30 yrs
- 0.0%
- Est. flood insurance / yr
- $507 – $1,088
Fire risk 3/10 · Minor
- Est. fire insurance / yr
- $666 – $1,236
Heat risk 9/10 · Severe
- Hot days now (above 102°F)
- 6 days/yr
- Hot days in 30 yrs
- 15 days/yr
Wind risk 8/10 · Major
- Chance of severe wind over 30 yrs
- 99.0%
Air-quality risk 2/10 · Minimal
- Unhealthy air days now
- 1 days/yr
- Unhealthy air days in 30 yrs
- 2 days/yr
Risk factors via First Street. Map © Google.
Why this score? — see what drove the D- grade
The composite is a weighted blend of 9 inputs, each scored 0–100. Each bar is that input's sub-score; the figure is the points it added to the 100-point composite (weight × sub-score).
- Cash flow +10.1/30.0
- ARV discount +7.5/15.0
- Schools +6.4/10.0
- Livability +4.2/5.0
- Rent growth +3.9/5.0
- DSCR +2.9/10.0
- Condition / age +2.5/5.0
- 1% rule +2.3/10.0
- Appreciation +0.0/10.0
$382,900
🖨 Deal sheet (PDF) 📄 Offer letter ✓ Due diligence
Listing remarks
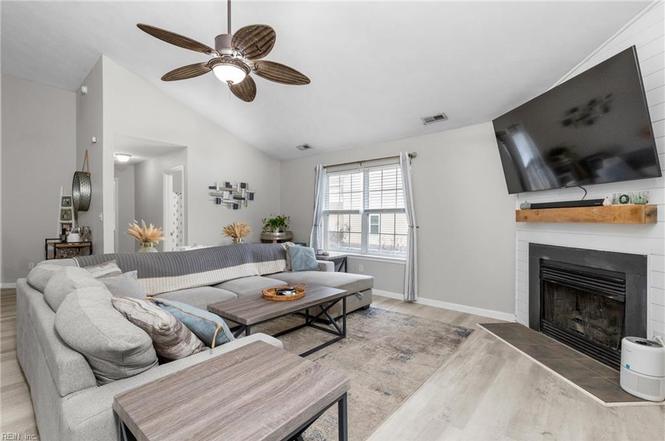
Live minutes from the Virginia Beach Oceanfront in this beautifully updated 3 bed 2 bath NO FEE 2-unit condo with a garage, new fence and driveway parking! Located on the 2nd floor, upgraded with new flooring, refinished kitchen cabinets, vaulted ceilings, and an open layout, this home feels light, bright, and spacious the moment you walk in. The kitchen offers newer stainless appliances, plenty of cabinets, and a breakfast bar that flows into the dining and living areas, complete with a cozy gas fireplace. The oversized primary suite is your retreat, featuring a private balcony, spa-like bath, and massive walk-in closet. Smart features include a Nest thermostat, and solar panels to keep ut
Key facts
- Spa-like bath
- Private balcony
- New flooring
Tags
Property features AI
Finance
- Other: City view
- HOA & community: Condo ownership; Condo fees listed as 0
Exterior
- Parking: Attached 1-car garage (approx. 200 sq ft); 2 total parking spaces; Off-street parking; Driveway parking spaces
- Utilities: City/County water; City/County sewer; Electric water heater; Electric power (supports heat pump and central air)
- Home design: Attached condo; 2-unit condo, low-rise; Two stories; Unit on level 2; One living level described for the unit; Solar electric system; Slab foundation
- Construction: Vinyl exterior siding; Asphalt shingle roof; Slab foundation
- Exterior features: Located on a cul-de-sac; Full privacy wood fence; Vinyl siding; Asphalt shingle roof
Interior
- Kitchen: Dishwasher; Disposal; Electric range; Refrigerator
- Bedrooms: One bedroom with ensuite; Master bedroom with bath; Balcony off a bedroom; Porch accessed from living area or bedroom
- Flooring: Ceramic flooring; Laminate flooring
- Bathrooms: 2 full bathrooms
- Heating & cooling: Heat pump heating; Central air conditioning
- Interior features: Cathedral ceiling; Gas fireplace; Ceiling fan; Garage door opener; Walk-in closet
- Laundry & utility: Dryer
Neighborhood map
What this means for you Summary
Snapshot
- This is a 3-bed/2.0-bath condo listed at $383k.
Deal economics
- At list price, monthly cash flow is $-226 ($-3k/yr) — negative.
- To cash-flow at today's rent, offer at most $343k (10.4% below list).
- To meet the 1% rule (rent ≥ 1% of price), the offer needs to be $280k (26.8% below list).
- Recommended offer: $280k (26.8% below list) — sets the bar for 1% rule.
- Cap rate 5.6% vs local median 3.5% in Virginia Beach — top-decile yield for the area; either an underpriced asset or a hidden risk that comps aren't pricing in. Stress-test before assuming the spread holds.
Location & tenants
- Location reads 83/100 on livability (#38 in VA, #880 nationally) — a professional / high-income tenant draw. Strengths: amenities A+, employment A+, housing A+; Watch: cost of living C-, commute F.
- Va Beach City Public School District (urban): math 69% / reading 78% proficiency, ranked #10 of 131 in VA (top 8%) — strong family-tenant draw, lease renewals of 3-5y typical.
- Zoned schools: Seatack Elementary An Achievable Dream Academy (math 47% / reading 57%, grade C-, #696 of 1,108 statewide, top 66%, 379 students, 93% FRL); First Colonial High (math 76% / reading 81%, grade A-, #75 of 319 statewide, top 25%, 1,797 students, 34% FRL) — zoned schools average 64% FRL vs 28% district-wide (36 pts higher); higher-poverty schools than district average — tighter screening recommended.
- Market conditions: Rents rising fast (+5.4%/yr); 397 active listings in the ZIP; 35 comparable units currently listed for rent nearby; rentals at typical pace (median 16d on market — plan ~3-4 weeks tenant-placement turnaround); solid renter incomes; 666 units permitted in Virginia Beach city in 2024 (347 in 5+ unit buildings).
- This rent runs 33% of the median local income ($101k/yr) — at the standard rent-burdened threshold; future hikes will face affordability resistance.
Forward outlook
- Local home prices are declining (-3.0%/yr); year-one equity from $3k of loan paydown is wiped out by about $11k of value loss. Plan a longer hold.
- Virginia Beach County population projected at +6% by 2050 — modest demand growth; plan on rents tracking national, not racing it.
Negotiation context
- It's been on market 137 days — a 12% lower offer ($337k) is reasonable based on typical stale-listing flexibility.
- 4 sale attempts since 4y ago with the ask held roughly flat each time — persistent listings suggest the price (not the market) is what's stuck; bring a comps-based counter.
- Current owner paid $310k; 24% above their basis — modest negotiation headroom, anchor on the comps not their cost.
Risks & watch-outs
- Climate carrying-cost: severe wind risk, 99% chance of damaging wind over 30y; extreme-heat days projected 6→15/yr by 2055 (HVAC capex compounding) — expect insurance premiums to compound above CPI over the hold.
Questions for the listing agent
- What do current leases actually rent for vs. the listed asking? Can we see a recent rent roll and the last 12 months of T-12 income?
- It's been on market 137 days. Have you received any prior offers? Is the seller open to a 27% concession, seller financing, or rate buy-down credit?
- Any open or pending special assessments — roof, HVAC, plumbing, elevator, façade? What's the per-unit balance and payoff schedule, and is the seller paying it off at close or rolling it to the buyer?
- Why hasn't it sold? Are there any deal-killer items the seller is aware of (foundation, flood, title, zoning, code violations)?
- Is there a deadline driving the sale (1031 exchange, divorce, estate, relocation)? That informs how much negotiation room exists.
- Schools are A-rated — typically a magnet for longer-tenancy family renters. What's the average tenant stay here, and is there a school-zone premium baked into asking?
- The area grade is low — what's the realistic commute time and amenity access for the typical tenant pool here? Any planned neighborhood developments (good or bad) we should know about?
- What's the average days-on-market for RENTAL listings here right now (not sales)? A rising rental-DOM trend means longer vacancies and softer asking-rent achievability than the comps imply.
- What's the recent tenant-quality profile in this submarket — average credit score on applications, eviction rate, late-payment / NSF rate, and stable-employment percentage? A property-management company in the area should have these aggregated.
- How much new apartment / multifamily construction is in the pipeline within 1–3 miles? Heavy new supply (>2% of stock underway) typically softens rents 12–24 months out; light construction supports rent growth.
Investment metrics
- 1% rule
- 0.73% ✗
- Cap rate
- 5.58%
- Cash-on-cash
- -2.53%
- DSCR
- 0.89
- GRM
- 11.4
CMA / ARV
No comps found within radius.
Projected returns pro-forma
-3.0% appreciation · 5.42% rent growth · sell at horizon
- IRR
- -18.1%
- Equity multiple
- 0.35×
- Total profit
- $-69,538
- Equity at exit
- $57,092
- IRR
- -6.6%
- Equity multiple
- 0.54×
- Total profit
- $-49,286
- Equity at exit
- $33,106
Cash invested: $107,212 (down + closing). Projections, not guarantees.
Landlord ↔ Tenant lean methodology
- Overall (STATE)
- 55 Moderately Landlord-Leaning
- State Virginia
- 55 Moderately Landlord-Leaning · D+2
- County
- — inherits STATE
- City
- — inherits STATE
ZIP-level market 23451
- Rents YoY
- 5.4%
- Active inventory
- 397
- Price-to-rent
- 11.4×
Monthly cashflow live
- Estimated rent
- $2,804 high interval (Pro) →
- Mortgage (P&I)
- −$2,008
- Tax from tax record
- −$274 /mo · $3,283/yr
- Insurance
- −$160
- HOA
- −$0
- Vacancy / Maint / Mgmt
- −$589
- Net cashflow
- $-226
Break-even live
Sensitivity live
| Price | -10% $-9 | -5% $-118 | +0% $-226 | +5% $-334 | +10% $-443 |
|---|---|---|---|---|---|
| Rent | -10% $-448 | -5% $-337 | +0% $-226 | +5% $-115 | +10% $-5 |
| Rate | -1.0pp $-33 | -0.5pp $-129 | base $-226 | +0.5pp $-325 | +1.0pp $-426 |
UW: 25.0% down · 7.5% · 30yr · 1.5% tax · 5.0% vac · 8.0% maint · 8.0% mgmt
Financing live
Cash to close
- Down payment
- $95,725
- Closing costs
- $11,487
- Reserves months
- —
- Total cash needed
- —
Loan-product check · same deal, 3 products live
Conventional
25% down · 7.5% · 30yr
- Down + closing
- —
- Monthly P&I
- —
- Monthly cashflow
- —
- DSCR
- —
- Eligible?
- —
Personal DTI + credit; lowest rate.
DSCR
20% down · 8.5% · 30yr
- Down + closing
- —
- Monthly P&I
- —
- Monthly cashflow
- —
- DSCR
- —
- Eligible?
- —
No personal income docs; deal must DSCR.
Hard money
10% down · 12.0% · 12mo
- Down + closing
- —
- Monthly P&I
- —
- Monthly cashflow
- —
- DSCR
- —
- Eligible?
- —
Short-term bridge; refi at stabilization.
Rent comps 35 comps
| Address | Beds | Baths | Sqft | Rent | $/sqft | DOM | Units | Dist |
|---|---|---|---|---|---|---|---|---|
| 1136 Arlynn Ln Virginia Beach, VA | 3.0 | 3.5 | 2252 | $3,000 | $1.33 | 18d | 1 | 0.04mi |
| 400 Eden Roc Cir Virginia Beach, VA | 1.0–3.0 | 1.0–2.0 | 1114 | $3,192 | $2.87 | 2d | 18 | 0.16mi |
| 400 Coastal Walk Pl Virginia Beach, VA | 3.0 | 2.0 | 1422 | $2,600 | $1.83 | 24d | 1 | 0.23mi |
| 400 Coastal Walk Pl #105 Virginia Beach, VA | 3.0 | 2.0 | 1422 | $2,500 | $1.76 | 18d | 1 | 0.23mi |
| 408 Coastal Walk Pl #103 Virginia Beach, VA | 2.0 | 2.5 | 1409 | $2,200 | $1.56 | 13d | 1 | 0.25mi |
| 940 Old Virginia Beach Rd Virginia Beach, VA | 3.0 | 2.5 | 1400 | $2,500 | $1.79 | 24d | 1 | 0.42mi |
| 912 C Ave Unit C Virginia Beach, VA | 3.0 | 2.5 | 1367 | $3,500 | $2.56 | 15d | 1 | 0.58mi |
| 912 C Ave Virginia Beach, VA | 3.0 | 2.5 | 1367 | $2,500 | $1.83 | 11d | 1 | 0.58mi |
| 918 13th St Virginia Beach, VA | 3.0 | 3.5 | 1651 | $3,000 | $1.82 | 24d | 1 | 0.67mi |
| 901 13th St Virginia Beach, VA | 3.0 | 3.5 | 1800 | $3,095 | $1.72 | 3d | 1 | 0.68mi |
| 233 Sykes Ave Unit A Virginia Beach, VA | 3.0 | 2.5 | 1484 | $2,450 | $1.65 | 12d | 1 | 0.72mi |
| 722 16th St Virginia Beach, VA | 3.0 | 1.5 | 1260 | $2,500 | $1.98 | 22d | 1 | 0.74mi |
| 1334 Linkhorn Cir Virginia Beach, VA | 3.0 | 2.5 | 1532 | $3,400 | $2.22 | 24d | 1 | 0.76mi |
| 945 Indian Cir Virginia Beach, VA | 3.0 | 2.5 | 1400 | $2,300 | $1.64 | 24d | 1 | 0.80mi |
| 1441 Reynard Dr Virginia Beach, VA | 1.0–4.0 | 1.0–2.5 | 1080 | $2,495 | $2.31 | 2d | 19 | 0.83mi |
| 904 Rudee Ave Virginia Beach, VA | 3.0 | 2.5 | 1250 | $2,800 | $2.24 | 5d | 1 | 0.84mi |
| 1441 Laskin Rd Virginia Beach, VA | 1.0–3.0 | 1.0–3.0 | 1226 | $3,400 | $2.77 | 5d | 9 | 0.85mi |
| 1208 Cypress Ave Unit A Virginia Beach, VA | 4.0 | 3.0 | 2000 | $2,200 | $1.10 | 18d | 1 | 0.88mi |
| 757 Saltmeadow Bay Dr Virginia Beach, VA | 1.0–3.0 | 1.0–2.5 | 1199 | $3,178 | $2.65 | 2d | 18 | 0.96mi |
| 2734 Manoomin Pl Virginia Beach, VA | 2.0 | 2.0 | 1428 | $1,995 | $1.40 | 12d | 1 | 0.97mi |
| 320 23rd St Virginia Beach, VA | 4.0 | 2.0 | 1700 | $3,595 | $2.11 | 24d | 1 | 1.11mi |
| 908 Terrace Ave Virginia Beach, VA | 3.0 | 2.5 | 1656 | $2,750 | $1.66 | 15d | 1 | 1.13mi |
| 300 25th St Virginia Beach, VA | 1.0–3.0 | 1.0–2.5 | 1253 | $3,990 | $3.18 | 2d | 2 | 1.19mi |
| 100 Pinewood Rd #128 Virginia Beach, VA | 2.0 | 2.5 | 1358 | $3,250 | $2.39 | 24d | 1 | 1.24mi |
| 521 Laskin Rd Apt 702 Virginia Beach, VA | 3.0 | 2.5 | 1581 | $4,990 | $3.16 | 5d | 1 | 1.26mi |
| 521 Laskin Rd Unit 00 323 Virginia Beach, VA | 3.0 | 2.5 | 1365 | $3,850 | $2.82 | 24d | 1 | 1.26mi |
| 521 Laskin Rd Virginia Beach, VA | 3.0 | 2.5 | 1365 | $3,850 | $2.82 | 11d | 1 | 1.26mi |
| 521 Laskin Rd Apt 718 Virginia Beach, VA | 2.0 | 2.5 | 1376 | $3,990 | $2.90 | 24d | 1 | 1.26mi |
| 521 Laskin Rd Virginia Beach, VA | 2.0 | 2.5 | 1381 | $4,040 | $2.93 | 24d | 1 | 1.26mi |
| 304 26 1/2 St Unit A Virginia Beach, VA | 3.0 | 2.5 | 1592 | $3,500 | $2.20 | 5d | 1 | 1.26mi |
| 510 Virginia Ave Virginia Beach, VA | 3.0 | 2.0 | 1880 | $2,350 | $1.25 | 5d | 1 | 1.27mi |
| 488 S Birdneck Rd Virginia Beach, VA | 3.0 | 2.0 | 1664 | $3,000 | $1.80 | 24d | 1 | 1.28mi |
| 315 29th St Virginia Beach, VA | 2.0 | 2.0 | 1300 | $1,900 | $1.46 | 11d | 1 | 1.30mi |
| 2613 Atlantic Ave Virginia Beach, VA | 1.0–2.0 | 1.0–2.0 | 1117 | $5,999 | $5.37 | 24d | 1 | 1.36mi |
| 3200 Holly Rd #102 Virginia Beach, VA | 2.0 | 2.0 | 1300 | $3,000 | $2.31 | 8d | 1 | 1.37mi |
HOA detail condo
- Monthly dues
- $0 · $0/yr
- Likely covers
- gas
- Assessments
- None detected in remarks — confirm with the listing agent.
Listing history 44 events
-
2026-06-13statusdays on market $382,900 Under Contract 137 DOM
-
2026-06-09days on market $382,900 Active Under Contract 134 DOM
-
2026-06-08days on market $382,900 Active Under Contract 133 DOM
-
2026-06-07statusdays on market $382,900 Active Under Contract 132 DOM
-
2026-06-03days on market $382,900 Active 128 DOM
-
2026-06-02days on market $382,900 Active 127 DOM
-
2026-06-01days on market $382,900 Active 126 DOM
-
2026-05-31days on market $382,900 Active 125 DOM
-
2026-05-21price $383,399
-
2026-05-19price $383,499
-
2026-05-15price $383,699
-
2026-05-13price $383,799
-
2026-04-29price $383,899
-
2026-04-29status Active
-
2026-04-15historical Active Under Contract
-
2026-04-06price $383,900
-
2026-04-03price $384,100
-
2026-03-31price $384,200
-
2026-03-26price $384,300
-
2026-03-11price $384,400
-
2026-03-06price $384,500
-
2026-03-03price $384,600
-
2026-02-27price $384,700
-
2026-02-23price $384,800
-
2026-01-26$384,900 Active
-
2026-01-11historical
-
2025-12-04price $384,100
-
2025-11-28price $384,200
-
2025-11-26price $384,300
-
2025-11-22price $384,400
-
2025-11-10price $384,500
-
2025-11-07price $384,650
-
2025-11-04price $384,700
-
2025-11-01price $384,750
-
2025-10-24price $384,900
-
2025-10-01$385,000 Active
-
2022-11-22soldstatus $310,000
-
2022-07-20historical
-
2022-07-19soldstatus $310,000
-
2022-07-05status Under Contract
-
2022-06-20historical Active Under Contract
-
2022-06-15$300,000 Active
-
2013-09-17price $124,900 Active
-
2013-07-31price $138,510 Active
ⓘ Source: listings_history table (triggers on properties + properties_extension) + one-shot
backfill from property_details.listing_events for pre-trigger history.
Tax reassessment forecast VA · Resets to sale price
- Current annual tax
- $3,283 · $274/mo
- Projected year-2 tax
- $3,283 · $274/mo
- Expected delta
- $0/yr ($0/mo · 0.0%)
ⓘ Screening estimate from a state-policy table — verify with the county assessor before closing.
Climate risk First Street
- Flood 1/10 Low FEMA zone X (unshaded) · 0% chance over 30 yrs
- Wildfire 3/10 Moderate
- Heat 9/10 Extreme 6 d/yr ≥102°F today · 15 d/yr by 30 yrs out
- Wind 8/10 Severe 99% chance of damaging wind over 30 yrs
- Air quality 2/10 Low 1 unhealthy d/yr today · 2 by 30 yrs out
Nearby sold comps map
Loading sold comps map…
Walkable amenities ~0.75 mi
Loading nearby amenities…
Taxation est. · year 1
- Rental income
- $33,646
- − Mortgage interest
- −$21,448
- − Property taxes
- −$3,283
- − Insurance
- −$1,914
- − Repairs & maintenance
- −$2,692
- − Management
- −$2,692
- − Depreciation
- −$11,139
- Taxable loss
- −$9,523
- Est. tax savings @ 24.0%
- +$2,285
- After-tax cash flow
- $-428/yr
For passive investors: Depreciation is non-cash, so a rental often shows a tax loss while cash-flowing — sheltering income. Rental losses are passive: they offset passive income freely, and up to $25,000/yr can offset ordinary (W-2) income if you actively participate and your MAGI is under $100k (phasing out to $0 by $150k); unused losses carry forward. On sale, claimed depreciation is recaptured at up to 25%, and gains may owe capital-gains tax (a 1031 exchange can defer both). Figures are a year-1 estimate at your 24.0% rate — not tax advice; consult a CPA.
Schools (NCES district)
- District
- Va Beach City Public School District
- NCES district ID
- 5103840
- Math proficiency
- 69% ▼ -19.00%
- Reading proficiency
- 78% ▼ -7.00%
- Median HH income
- $66,452
- Composite
- 63.81/100
- National rank
- #594
- State rank
- #10 of 131 in VA
Livability — Virginia Beach
- Score
- 83/100
- State rank
- #38
- US rank
- #880
Category grades
Schools grade is shown separately in the Schools card above.
Census & demographics
- Census place
- Virginia Beach, VA
- County
- Virginia Beach City · 448,227 people
- City population
- 448,227
- Metro
- Virginia Beach-Norfolk-Newport News, VA-NC
- Population (ZIP)
- 44,012
- Household income
- $100,697
- Rent vs Own
- Severe rent burden
- 2588.0
Population outlook (Virginia Beach County) Hauer SSP2
- Today (2025)
- 480,401 people
- By 2030
- 491,221 · +2.3%
- By 2040
- 504,882 · +5.1%
- By 2050
- 508,847 · +5.9%
- By 2075
- 504,831 · +5.1%
- By 2100
- 465,867 · -3.0%
Race, ethnicity, and origin ACS 2023
- Neighborhood character
- Predominantly White (78%)
- Race & ethnicity
- White 78% Black 7% Hispanic / Latino 7% Two or more races 7% Asian 3%
- Hispanic origin (detail)
- Mexican 3% Puerto Rican 1%
- Common ancestry
- Slovak 3% Romanian 3% Lithuanian 3%
- Foreign-born
- 6% · Canada, Vietnam
- Languages at home
- 92% English-only · Spanish 3% Other Indo-European 2% Russian/Polish/Slavic 1%
Political lean MEDSL · Virginia Beach
- 2024 margin
- Toss-up / Even · D 50.7% · R 48.0% · Other 1.3%
- 2008→2024 swing
- +3.4pp toward D · 2008: -0.7pp · 2024: 2.6pp
- All cycles
- 2024: D+2.6 2020: D+5.4 2016: R+4.5 2012: R+2.5 2008: R+0.7
Not yet ingested
- Civics
- —
Market trends
- HPI YoY
- ▼ -530.26%
- Current HPI
- 315.521
- Rent YoY
- ▲ 5.42%
- Metro
- Virginia Beach-Norfolk-Newport News, VA-NC
- State GDP YoY
- ▲ 2.40%
- F500 in state
- 50
Industry mix (Fortune 500 HQ in VA)
| Industry | F500 HQs | Revenue |
|---|---|---|
| Aerospace / Defense | 4 | $236B |
|
||
| Technology / Defense | 3 | $32B |
|
||
| Financial Services | 2 | $176B |
|
||
| Utilities | 2 | $27B |
|
||
| Insurance | 2 | $25B |
|
||
| Technology | 2 | $15B |
|
||
Price history
+176.8% since first listed36 events — show timeline
- 2026-05-21 Price Changed $383,399 REINMLS
- 2026-05-19 Price Changed $383,499 REINMLS
- 2026-05-15 Price Changed $383,699 REINMLS
- 2026-05-13 Price Changed $383,799 REINMLS
- 2026-04-29 Price Changed $383,899 REINMLS
- 2026-04-29 Relisted — REINMLS
- 2026-04-15 Contingent — REINMLS
- 2026-04-06 Price Changed $383,900 REINMLS
- 2026-04-03 Price Changed $384,100 REINMLS
- 2026-03-31 Price Changed $384,200 REINMLS
- 2026-03-26 Price Changed $384,300 REINMLS
- 2026-03-11 Price Changed $384,400 REINMLS
- 2026-03-06 Price Changed $384,500 REINMLS
- 2026-03-03 Price Changed $384,600 REINMLS
- 2026-02-27 Price Changed $384,700 REINMLS
- 2026-02-23 Price Changed $384,800 REINMLS
- 2026-01-26 Listed $384,900 REINMLS
- 2026-01-11 Listing Removed — REINMLS
- 2025-12-04 Price Changed $384,100 REINMLS
- 2025-11-28 Price Changed $384,200 REINMLS
- 2025-11-26 Price Changed $384,300 REINMLS
- 2025-11-22 Price Changed $384,400 REINMLS
- 2025-11-10 Price Changed $384,500 REINMLS
- 2025-11-07 Price Changed $384,650 REINMLS
- 2025-11-04 Price Changed $384,700 REINMLS
- 2025-11-01 Price Changed $384,750 REINMLS
- 2025-10-24 Price Changed $384,900 REINMLS
- 2025-10-01 Listed $385,000 REINMLS
- 2022-11-22 Sold (Public Records) $310,000 Public Records
- 2022-07-20 Listing Removed — REINMLS
- 2022-07-19 Sold (Public Records) $310,000 Public Records
- 2022-07-05 Pending — REINMLS
- 2022-06-20 Contingent — REINMLS
- 2022-06-15 Listed $300,000 REINMLS
- 2013-09-17 Price Changed $124,900 REINMLS
- 2013-07-31 Price Changed $138,510 REINMLS
Property tax history
+5.3%/yrLatest (2025): $3,283 · +5.0% YoY. Source: county tax records.
Cash-flow waterfall
monthlySold comps — $/sqft
last 12 mo · ≤1 miLoading sold comps…