1601 Drew Rd #45 · Seeley, CA
Flood risk 1/10 · Minimal
- FEMA flood zone
- X (unshaded)
- Chance of flooding over 30 yrs
- 0.0%
- Est. flood insurance / yr
- $507 – $1,088
Fire risk 3/10 · Minor
- Est. fire insurance / yr
- $659 – $1,223
Heat risk 9/10 · Severe
- Hot days now (above 113°F)
- 7 days/yr
- Hot days in 30 yrs
- 19 days/yr
Wind risk 1/10 · Minimal
- Chance of severe wind over 30 yrs
- —
Air-quality risk 3/10 · Minor
- Unhealthy air days now
- 2 days/yr
- Unhealthy air days in 30 yrs
- 3 days/yr
Risk factors via First Street. Map © Google.
Why this score? — see what drove the B- grade
The composite is a weighted blend of 9 inputs, each scored 0–100. Each bar is that input's sub-score; the figure is the points it added to the 100-point composite (weight × sub-score).
- Cash flow +30.0/30.0
- 1% rule +10.0/10.0
- DSCR +10.0/10.0
- ARV discount +7.5/15.0
- Rent growth +2.5/5.0
- Livability +2.5/5.0
- Condition / age +2.5/5.0
- Schools +1.3/10.0
- Appreciation +0.0/10.0
$105,000
🖨 Deal sheet (PDF) 📄 Offer letter ✓ Due diligence
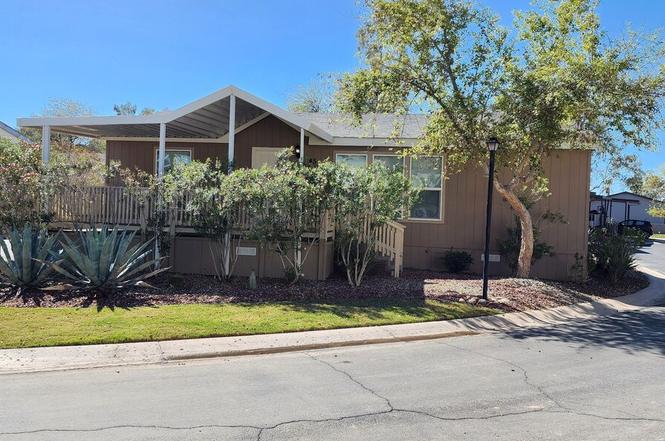
Listing remarks
Looking for affordable living with all the amenities? Look no further! With new LVP flooring throughout, this little jewel is Move in ready! This charming double wide mobile home has 3 bedrooms, 2 full baths , with an open floorplan with spacious living room . Enjoy the community amenities including the pool, spa, clubhouse, restaurant, basketball and tennis courts. Spend your mornings on the nine hole golf course or just take a quiet stroll by the lake.
Key facts
- Community amenities
- Expanded living room
- New lvp flooring
Tags
Property features AI
Finance
- HOA & community: Gated community; Clubhouse; Community pool; Tennis courts; Golf
Exterior
- Parking: 2 parking spaces total; Attached carport; 2 carport spaces
- Utilities: Private water source
- Home design: Mobile home; Single-story
- Construction: Composition/shingle roof
- Exterior features: Tennis court(s); Covered patio/porch; Shed(s)
Interior
- Kitchen: Dishwasher; Gas oven; Refrigerator
- Flooring: Vinyl
- Bathrooms: 2 full bathrooms
- Heating & cooling: Central heating; Ceiling fan(s)
- Interior features: Walk-in closet(s)
- Laundry & utility: Gas water heater
Neighborhood map
What this means for you Summary
Snapshot
- This is a 3-bed/2.0-bath other listed at $105k.
Deal economics
- At list price, monthly cash flow is $790 ($9k/yr) — positive.
- The deal already cash-flows at list — no discount required.
- Meets the 1% rule at list price ($2k rent vs $105k).
- Recommended offer: $96k (9.0% below list) — sets the bar for market timing.
Location & tenants
- Location reads 49/100 on livability (#1,180 in CA) — a working-class tenant base; expect higher turnover. Strengths: housing A, crime B; Watch: schools F, amenities F, commute F.
- Seeley Union Elementary (rural): math 11% / reading 20% proficiency, ranked #489 of 517 in CA (top 95%) — low school quality limits family demand, transient renter base, plan for 1-2y turnover; 81% free/reduced lunch — lower-income household profile, screen leases tightly.
- Market conditions: 122 active listings in the ZIP; 271 units permitted in Imperial County in 2024 (112 in 5+ unit buildings).
- This rent runs 40% of the median local income ($55k/yr) — at the standard rent-burdened threshold; future hikes will face affordability resistance.
Forward outlook
- Local home prices are declining (-3.0%/yr); year-one equity from $726 of loan paydown is wiped out by about $3k of value loss. Plan a longer hold.
- Imperial County population projected at +7% by 2050 — modest demand growth; plan on rents tracking national, not racing it.
- At projected returns (-3.0% appreciation + 3.0% rent growth), your $29k cash investment doubles in ~4 years — after that, you're playing with house money.
Negotiation context
- It's been on market 110 days — a 9% lower offer ($96k) is reasonable based on typical stale-listing flexibility.
- 5 sale attempts since 2y ago; this cycle's ask has dropped $30k (22%) from the opening price — seller is motivated, your offer sets the floor, not the list.
Risks & watch-outs
- Climate carrying-cost: extreme-heat days projected 7→19/yr by 2055 (HVAC capex compounding) — expect insurance premiums to compound above CPI over the hold.
Questions for the listing agent
- It's been on market 110 days. Have you received any prior offers? Is the seller open to a 9% concession, seller financing, or rate buy-down credit?
- Why hasn't it sold? Are there any deal-killer items the seller is aware of (foundation, flood, title, zoning, code violations)?
- Is there a deadline driving the sale (1031 exchange, divorce, estate, relocation)? That informs how much negotiation room exists.
- Schools are F-rated, which usually means shorter tenancies and higher turnover. Who's the typical renter profile here, and what's been the actual vacancy rate?
- What's the average days-on-market for RENTAL listings here right now (not sales)? A rising rental-DOM trend means longer vacancies and softer asking-rent achievability than the comps imply.
- What's the recent tenant-quality profile in this submarket — average credit score on applications, eviction rate, late-payment / NSF rate, and stable-employment percentage? A property-management company in the area should have these aggregated.
- How much new for-sale + rental construction is in the pipeline within 1–3 miles? Heavy new supply typically softens prices + rents 12–24 months out; constrained supply supports both.
Investment metrics
- 1% rule
- 1.73% ✓
- Cap rate
- 15.32%
- Cash-on-cash
- 32.24%
- DSCR
- 2.43
- GRM
- 4.8
CMA / ARV
No comps found within radius.
Projected returns pro-forma
-3.0% appreciation · 3.0% rent growth · sell at horizon
- IRR
- 27.3%
- Equity multiple
- 2.13×
- Total profit
- $33,276
- Equity at exit
- $15,656
- IRR
- 34.8%
- Equity multiple
- 4.19×
- Total profit
- $93,675
- Equity at exit
- $9,078
Cash invested: $29,400 (down + closing). Projections, not guarantees.
Landlord ↔ Tenant lean methodology
- Overall (STATE)
- 18 Strongly Tenant-Friendly
- State California
- 18 Strongly Tenant-Friendly · D+13
- County
- — inherits STATE
- City
- — inherits STATE
ZIP-level market 92243
- Home prices YoY
- -30.1%
- Active inventory
- 122
- Price-to-rent
- 4.8×
Monthly cashflow live
- Estimated rent
- $1,819 medium interval (Pro) →
- Mortgage (P&I)
- −$551
- Tax from tax record
- −$53 /mo · $635/yr
- Insurance
- −$44
- HOA
- −$0
- Vacancy / Maint / Mgmt
- −$382
- Net cashflow
- $790
Break-even live
Sensitivity live
| Price | -10% $849 | -5% $820 | +0% $790 | +5% $760 | +10% $730 |
|---|---|---|---|---|---|
| Rent | -10% $646 | -5% $718 | +0% $790 | +5% $862 | +10% $934 |
| Rate | -1.0pp $843 | -0.5pp $817 | base $790 | +0.5pp $763 | +1.0pp $735 |
UW: 25.0% down · 7.5% · 30yr · 1.5% tax · 5.0% vac · 8.0% maint · 8.0% mgmt
Financing live
Cash to close
- Down payment
- $26,250
- Closing costs
- $3,150
- Reserves months
- —
- Total cash needed
- —
Loan-product check · same deal, 3 products live
Conventional
25% down · 7.5% · 30yr
- Down + closing
- —
- Monthly P&I
- —
- Monthly cashflow
- —
- DSCR
- —
- Eligible?
- —
Personal DTI + credit; lowest rate.
DSCR
20% down · 8.5% · 30yr
- Down + closing
- —
- Monthly P&I
- —
- Monthly cashflow
- —
- DSCR
- —
- Eligible?
- —
No personal income docs; deal must DSCR.
Hard money
10% down · 12.0% · 12mo
- Down + closing
- —
- Monthly P&I
- —
- Monthly cashflow
- —
- DSCR
- —
- Eligible?
- —
Short-term bridge; refi at stabilization.
Listing history 11 events
-
2026-05-04status Pending
-
2026-04-17price $105,000
-
2026-03-27price $115,000
-
2026-01-13$135,000 Active
-
2025-03-04price $89,900
-
2025-01-04status Active
-
2025-01-04price $109,000
-
2024-10-01status Active
-
2024-05-30status Active
-
2024-04-19price $125,000
-
2024-03-20$135,000 Active
ⓘ Source: listings_history table (triggers on properties + properties_extension) + one-shot
backfill from property_details.listing_events for pre-trigger history.
Tax reassessment forecast CA · Resets to sale price
- Current annual tax
- $635 · $53/mo
- Projected year-2 tax
- $798 · $66/mo
- Expected delta
- +$163/yr (+$14/mo · 25.6%)
ⓘ Screening estimate from a state-policy table — verify with the county assessor before closing.
Climate risk First Street
- Flood 1/10 Low FEMA zone X (unshaded) · 0% chance over 30 yrs
- Wildfire 3/10 Moderate
- Heat 9/10 Extreme 7 d/yr ≥113°F today · 19 d/yr by 30 yrs out
- Wind 1/10 Low
- Air quality 3/10 Moderate 2 unhealthy d/yr today · 3 by 30 yrs out
Nearby sold comps map
Loading sold comps map…
Walkable amenities ~0.75 mi
Loading nearby amenities…
Taxation est. · year 1
- Rental income
- $21,831
- − Mortgage interest
- −$5,882
- − Property taxes
- −$635
- − Insurance
- −$525
- − Repairs & maintenance
- −$1,747
- − Management
- −$1,747
- − Depreciation
- −$3,055
- Taxable income
- $8,242
- Est. tax owed @ 24.0%
- −$1,978
- After-tax cash flow
- $7,501/yr
For passive investors: Depreciation is non-cash, so a rental often shows a tax loss while cash-flowing — sheltering income. Rental losses are passive: they offset passive income freely, and up to $25,000/yr can offset ordinary (W-2) income if you actively participate and your MAGI is under $100k (phasing out to $0 by $150k); unused losses carry forward. On sale, claimed depreciation is recaptured at up to 25%, and gains may owe capital-gains tax (a 1031 exchange can defer both). Figures are a year-1 estimate at your 24.0% rate — not tax advice; consult a CPA.
Schools (NCES district)
- District
- Seeley Union Elementary
- NCES district ID
- 0636210
- Math proficiency
- 11% ▼ -15.00%
- Reading proficiency
- 20% ▼ -10.00%
- Median HH income
- $40,082
- Composite
- 13.2/100
- National rank
- #9553
- State rank
- #489 of 517 in CA
Livability — Seeley
- Score
- 49/100
- State rank
- #1180
- US rank
- #25954
Category grades
Schools grade is shown separately in the Schools card above.
Census & demographics
- County
- Imperial County · 104,838 people
- Metro
- El Centro, CA
- Population (ZIP)
- 49,069
- Household income
- $55,057
- Rent vs Own
- Severe rent burden
- 1683.0
Population outlook (Imperial County) Hauer SSP2
- Today (2025)
- 186,713 people
- By 2030
- 190,022 · +1.8%
- By 2040
- 195,993 · +5.0%
- By 2050
- 199,534 · +6.9%
- By 2075
- 216,878 · +16.2%
- By 2100
- 352,705 · +88.9%
Race, ethnicity, and origin ACS 2023
- Neighborhood character
- Predominantly Hispanic (85%)
- Race & ethnicity
- Hispanic / Latino 85% Two or more races 24% White 9% Black 4%
- Hispanic origin (detail)
- Mexican 81%
- Common ancestry
- Lithuanian 1%
- Foreign-born
- 29% · Canada
- Languages at home
- 25% English-only · Spanish 74%
Political lean MEDSL · Imperial
- 2024 margin
- Toss-up / Even · D 48.3% · R 49.1% · Other 2.6%
- 2008→2024 swing
- -27.0pp toward R · 2008: 26.2pp · 2024: -0.9pp
- All cycles
- 2024: R+0.9 2020: D+24.4 2016: D+41.1 2012: D+28.8 2008: D+26.2
Not yet ingested
- Civics
- —
Market trends
- HPI YoY
- ▼ -156.41%
- Current HPI
- 362.4044
- Rent YoY
- —
- Metro
- El Centro, CA
- State GDP YoY
- ▲ 3.21%
- F500 in state
- 116
Industry mix (Fortune 500 HQ in CA)
| Industry | F500 HQs | Revenue |
|---|---|---|
| Technology | 27 | $1,492B |
|
||
| Financial Services | 3 | $174B |
|
||
| Retail | 3 | $44B |
|
||
| Insurance | 3 | $26B |
|
||
| Media / Entertainment | 2 | $115B |
|
||
| Pharmaceuticals / Biotech | 2 | $62B |
|
||
Price history
-22.2% since first listed11 events — show timeline
- 2026-05-04 Pending — ICAOR
- 2026-04-17 Price Changed $105,000 ICAOR
- 2026-03-27 Price Changed $115,000 ICAOR
- 2026-01-13 Listed $135,000 ICAOR
- 2025-03-04 Price Changed $89,900 ICAOR
- 2025-01-04 Relisted — ICAOR
- 2025-01-04 Price Changed $109,000 ICAOR
- 2024-10-01 Relisted — ICAOR
- 2024-05-30 Relisted — ICAOR
- 2024-04-19 Price Changed $125,000 ICAOR
- 2024-03-20 Listed $135,000 ICAOR
Property tax history
+0.1%/yrLatest (2025): $635 · +2.5% YoY. Source: county tax records.
Cash-flow waterfall
monthlySold comps — $/sqft
last 12 mo · ≤1 miLoading sold comps…