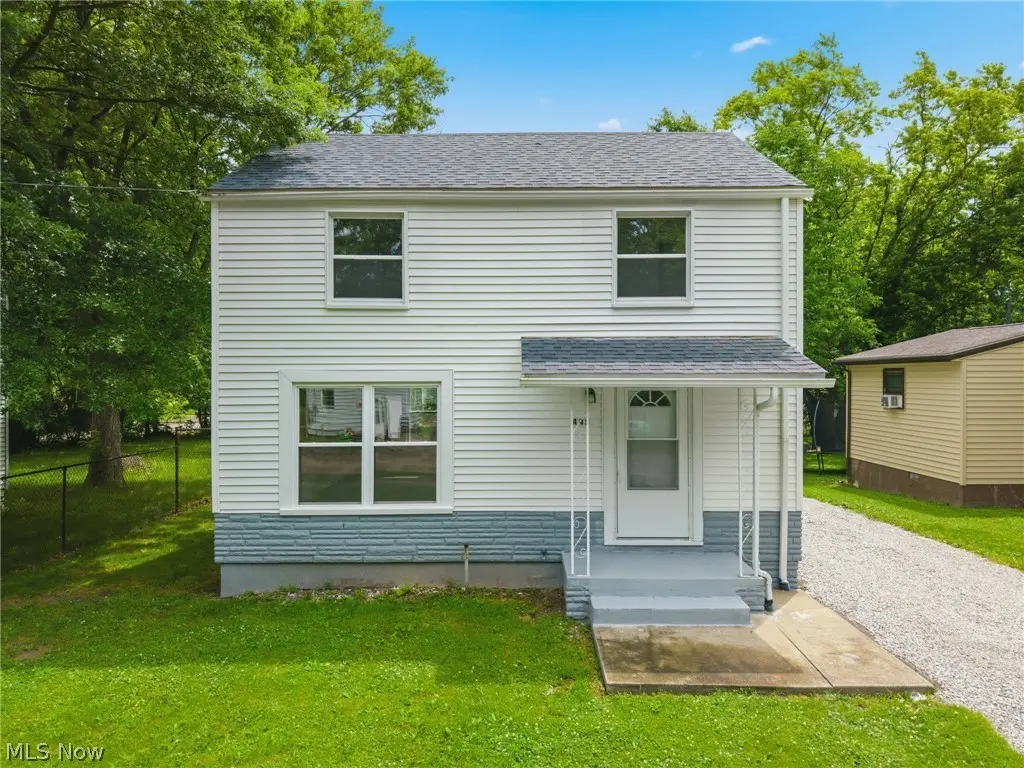
445 Oak Ave · Alliance, OH
Flood risk 1/10 · Minimal
- FEMA flood zone
- X (unshaded)
- Chance of flooding over 30 yrs
- 0.0%
- Est. flood insurance / yr
- $473 – $860
Fire risk 1/10 · Minimal
- Est. fire insurance / yr
- $713 – $1,323
Heat risk 3/10 · Minor
- Hot days now (above 97°F)
- 7 days/yr
- Hot days in 30 yrs
- 17 days/yr
Wind risk 1/10 · Minimal
- Chance of severe wind over 30 yrs
- —
Air-quality risk 2/10 · Minimal
- Unhealthy air days now
- 1 days/yr
- Unhealthy air days in 30 yrs
- 2 days/yr
Risk factors via First Street. Map © Google.
Why this score? — see what drove the D+ grade
The composite is a weighted blend of 9 inputs, each scored 0–100. Each bar is that input's sub-score; the figure is the points it added to the 100-point composite (weight × sub-score).
- ARV discount +15.0/15.0
- Cash flow +14.3/30.0
- DSCR +4.3/10.0
- Livability +3.9/5.0
- Schools +3.5/10.0
- 1% rule +2.8/10.0
- Rent growth +2.5/5.0
- Condition / age +2.5/5.0
- Appreciation +0.0/10.0
$124,900
🖨 Deal sheet (PDF) 📄 Offer letter ✓ Due diligence
Listing remarks
Welcome home to this charming and well-maintained 3-bedroom, 1-bath home conveniently located in Alliance and just a short distance from Maple Beach Park! This move-in-ready property offers a comfortable floor plan with numerous updates already completed for peace of mind. Major improvements include fresh paint and flooring throughout, updated kitchen with stove and refrigerator included, newer windows, a newer furnace and central air conditioning system, a roof that is less than 5 years old, an updated electric breaker panel, and a hot water heater that is approximately 5 years old. Outside, you'll appreciate the partially fenced yard, perfect for pets, play, or outdoor entertaining, along
Key facts
- 7,501 sq ft lot
- Built 1944
- Listed 5 days
Property features AI
Exterior
- Parking: Gravel parking
- Utilities: Public water; Public sewer
- Home design: 2-story home
- Construction: Vinyl siding; Fiberglass roof
- Exterior features: Gravel parking
Interior
- Kitchen: Range; Refrigerator
- Bathrooms: 1 full bathroom (main level)
- Heating & cooling: Forced air heating (gas); Central air conditioning
- Interior features: Insulated windows; Ceiling fan(s)
Neighborhood map
What this means for you Summary
Snapshot
- This is a 3-bed/1.0-bath single-family listed at $125k.
Deal economics
- At list price, monthly cash flow is $23 ($273/yr) — positive.
- The deal already cash-flows at list — no discount required.
- To meet the 1% rule (rent ≥ 1% of price), the offer needs to be $98k (21.6% below list).
- Recommended offer: $98k (21.6% below list) — sets the bar for 1% rule.
- Cap rate 6.5% vs local median 4.8% in Alliance — top-decile yield for the area; either an underpriced asset or a hidden risk that comps aren't pricing in. Stress-test before assuming the spread holds.
Location & tenants
- Location reads 78/100 on livability (#175 in OH, #2,737 nationally) — a middle-class / working-renter tenant base. Strengths: commute A+, cost of living A+, housing A+; Watch: amenities F, employment F.
- Alliance City (town): math 39% / reading 45% proficiency, ranked #536 of 656 in OH (top 82%) — families likely to look elsewhere, expect single-tenant / working-renter base with shorter leases; 71% free/reduced lunch — lower-income household profile, screen leases tightly.
- Market conditions: 166 active listings in the ZIP; 3 comparable units currently listed for rent nearby; rentals at typical pace (median 15d on market — plan ~3-4 weeks tenant-placement turnaround); 528 units permitted in Stark County in 2024 (84 in 5+ unit buildings).
Forward outlook
- Local home prices are declining (-3.0%/yr); year-one equity from $864 of loan paydown is wiped out by about $4k of value loss. Plan a longer hold.
- Stark County population projected to shrink 8% by 2050 — rents likely to lag national; underwrite the cash flow, not the appreciation.
Negotiation context
- Only 5 days on market — expect competitive offers; lowballing is unlikely to land.
- Current owner paid $42k; list at $125k implies a 201% gain — meaningful room to come down on a strong offer.
Risks & watch-outs
- Watch-outs: built in 1944 — expect roof / HVAC / electrical / plumbing capex.
Questions for the listing agent
- Built in 1944 — when were the roof, HVAC, electrical panel, plumbing, and water heater last replaced?
- Is there a deadline driving the sale (1031 exchange, divorce, estate, relocation)? That informs how much negotiation room exists.
- Schools are B-rated — typically a magnet for longer-tenancy family renters. What's the average tenant stay here, and is there a school-zone premium baked into asking?
- The area grade is low — what's the realistic commute time and amenity access for the typical tenant pool here? Any planned neighborhood developments (good or bad) we should know about?
- What's the average days-on-market for RENTAL listings here right now (not sales)? A rising rental-DOM trend means longer vacancies and softer asking-rent achievability than the comps imply.
- What's the recent tenant-quality profile in this submarket — average credit score on applications, eviction rate, late-payment / NSF rate, and stable-employment percentage? A property-management company in the area should have these aggregated.
- How much new for-sale + rental construction is in the pipeline within 1–3 miles? Heavy new supply typically softens prices + rents 12–24 months out; constrained supply supports both.
Investment metrics
- 1% rule
- 0.78% ✗
- Cap rate
- 6.51%
- Cash-on-cash
- 0.78%
- DSCR
- 1.03
- GRM
- 10.6
CMA / ARV
- ARV (on-the-fly)
- $239,040
- Comps found
- 2
Show comp detail 2 sales within ~0.75 mi
| Address | Dist | Beds/Ba | Sqft | Sold | Price | $/sf | Match |
|---|---|---|---|---|---|---|---|
| 1226 Noble St | 0.11mi | 3/1.5 | 960 (0%) | 3mo | $126,000 | $131 | 91 |
| 16251 River St NE | 0.43mi | 2/1.0 (-1) | 976 (+2%) | 9mo | $243,500 | $249 | 65 |
Match score weights: distance 35% · size 25% · config 20% · recency 20%. Top-matched comps best support the ARV.
Projected returns pro-forma
-3.0% appreciation · 3.0% rent growth · sell at horizon
- IRR
- -15.1%
- Equity multiple
- 0.46×
- Total profit
- $-18,847
- Equity at exit
- $18,623
- IRR
- -6.6%
- Equity multiple
- 0.58×
- Total profit
- $-14,771
- Equity at exit
- $10,799
Cash invested: $34,972 (down + closing). Projections, not guarantees.
Landlord ↔ Tenant lean methodology
- Overall (STATE)
- 73 Landlord-Friendly
- State Ohio
- 73 Landlord-Friendly · R+6
- County
- — inherits STATE
- City
- — inherits STATE
ZIP-level market 44601
- Active inventory
- 166
- Price-to-rent
- 10.6×
Monthly cashflow live
- Estimated rent
- $979 medium interval (Pro) →
- Mortgage (P&I)
- −$655
- Tax from tax record
- −$43 /mo · $521/yr
- Insurance
- −$52
- HOA
- −$0
- Vacancy / Maint / Mgmt
- −$206
- Net cashflow
- $23
Break-even live
Sensitivity live
| Price | -10% $93 | -5% $58 | +0% $23 | +5% $-13 | +10% $-48 |
|---|---|---|---|---|---|
| Rent | -10% $-55 | -5% $-16 | +0% $23 | +5% $61 | +10% $100 |
| Rate | -1.0pp $86 | -0.5pp $54 | base $23 | +0.5pp $-10 | +1.0pp $-43 |
UW: 25.0% down · 7.5% · 30yr · 1.5% tax · 5.0% vac · 8.0% maint · 8.0% mgmt
Financing live
Cash to close
- Down payment
- $31,225
- Closing costs
- $3,747
- Reserves months
- —
- Total cash needed
- —
Loan-product check · same deal, 3 products live
Conventional
25% down · 7.5% · 30yr
- Down + closing
- —
- Monthly P&I
- —
- Monthly cashflow
- —
- DSCR
- —
- Eligible?
- —
Personal DTI + credit; lowest rate.
DSCR
20% down · 8.5% · 30yr
- Down + closing
- —
- Monthly P&I
- —
- Monthly cashflow
- —
- DSCR
- —
- Eligible?
- —
No personal income docs; deal must DSCR.
Hard money
10% down · 12.0% · 12mo
- Down + closing
- —
- Monthly P&I
- —
- Monthly cashflow
- —
- DSCR
- —
- Eligible?
- —
Short-term bridge; refi at stabilization.
Rent comps 3 comps
| Address | Beds | Baths | Sqft | Rent | $/sqft | DOM | Units | Dist |
|---|---|---|---|---|---|---|---|---|
| 1329 Auld St Alliance, OH | 2.0 | 2.0 | 900 | $895 | $0.99 | 14d | 1 | 1.07mi |
| 1329 Auld St Unit 1329 Alliance, OH | 2.0 | 2.0 | 900 | $925 | $1.03 | 14d | 1 | 1.07mi |
| 199 W Main St Alliance, OH | 2.0 | 1.0 | 600 | $860 | $1.43 | 14d | 1 | 1.08mi |
Listing history 6 events
-
2026-06-18days on market $124,900 Active 5 DOM
-
2026-06-17days on market $124,900 Active 4 DOM
-
2026-06-16days on market $124,900 Active 3 DOM
-
2026-06-15days on market $124,900 Active 2 DOM
-
2026-06-14remarks 699-char remark
-
2026-06-14$124,900 Active 1 DOM
ⓘ Source: listings_history table (triggers on properties + properties_extension) + one-shot
backfill from property_details.listing_events for pre-trigger history.
Tax reassessment forecast OH · Partial reset (capped growth)
- Current annual tax
- $521 · $43/mo
- Projected year-2 tax
- $1,235 · $103/mo
- Expected delta
- +$714/yr (+$59/mo · 137.1%)
ⓘ Screening estimate from a state-policy table — verify with the county assessor before closing.
Climate risk First Street
- Flood 1/10 Low FEMA zone X (unshaded) · 0% chance over 30 yrs
- Wildfire 1/10 Low
- Heat 3/10 Moderate 7 d/yr ≥97°F today · 17 d/yr by 30 yrs out
- Wind 1/10 Low
- Air quality 2/10 Low 1 unhealthy d/yr today · 2 by 30 yrs out
Nearby sold comps map
Loading sold comps map…
Walkable amenities ~0.75 mi
Loading nearby amenities…
Taxation est. · year 1
- Rental income
- $11,744
- − Mortgage interest
- −$6,996
- − Property taxes
- −$521
- − Insurance
- −$624
- − Repairs & maintenance
- −$940
- − Management
- −$940
- − Depreciation
- −$3,633
- Taxable loss
- −$1,910
- Est. tax savings @ 24.0%
- +$458
- After-tax cash flow
- $731/yr
For passive investors: Depreciation is non-cash, so a rental often shows a tax loss while cash-flowing — sheltering income. Rental losses are passive: they offset passive income freely, and up to $25,000/yr can offset ordinary (W-2) income if you actively participate and your MAGI is under $100k (phasing out to $0 by $150k); unused losses carry forward. On sale, claimed depreciation is recaptured at up to 25%, and gains may owe capital-gains tax (a 1031 exchange can defer both). Figures are a year-1 estimate at your 24.0% rate — not tax advice; consult a CPA.
Schools (NCES district)
- District
- Alliance City
- NCES district ID
- 3904349
- Math proficiency
- 39% ▼ -9.00%
- Reading proficiency
- 45% ▼ -5.00%
- Median HH income
- $33,326
- Composite
- 34.54/100
- National rank
- #5176
- State rank
- #536 of 656 in OH
Livability — Alliance
- Score
- 78/100
- State rank
- #175
- US rank
- #2737
Category grades
Schools grade is shown separately in the Schools card above.
Census & demographics
- Census place
- Alliance, OH
- County
- Stark County · 272,865 people
- City population
- 32,696
- Metro
- Canton-Massillon, OH
- Population (ZIP)
- 32,696
- Household income
- $61,965
- Rent vs Own
- Severe rent burden
- 780.0
Population outlook (Stark County) Hauer SSP2
- Today (2025)
- 373,708 people
- By 2030
- 371,245 · -0.7%
- By 2040
- 361,331 · -3.3%
- By 2050
- 345,290 · -7.6%
- By 2075
- 302,669 · -19.0%
- By 2100
- 238,870 · -36.1%
Race, ethnicity, and origin ACS 2023
- Neighborhood character
- Predominantly White (87%)
- Race & ethnicity
- White 87% Black 6% Two or more races 5% Hispanic / Latino 1%
- Common ancestry
- Italian 3% Lithuanian 2% Slovak 2%
- Foreign-born
- 1%
- Languages at home
- 98% English-only · Spanish 1%
Political lean MEDSL · Stark
- 2024 margin
- Strong R (+21.9) · D 38.6% · R 60.5%
- 2008→2024 swing
- -27.4pp toward R · 2008: 5.5pp · 2024: -21.9pp
- All cycles
- 2024: R+21.9 2020: R+18.5 2016: R+17.4 2012: R+0.4 2008: D+5.5
Not yet ingested
- Civics
- —
Market trends
- HPI YoY
- ▼ -174.62%
- Current HPI
- 224.9507
- Rent YoY
- —
- Metro
- Canton-Massillon, OH
- State GDP YoY
- ▲ 1.98%
- F500 in state
- 48
Industry mix (Fortune 500 HQ in OH)
| Industry | F500 HQs | Revenue |
|---|---|---|
| Insurance | 3 | $145B |
|
||
| Industrial Machinery | 3 | $49B |
|
||
| Financial Services | 3 | $24B |
|
||
| Consumer Goods | 2 | $93B |
|
||
| Aerospace / Defense | 2 | $47B |
|
||
| Utilities | 2 | $33B |
|
||
Price history
+524.5% since first listed3 events — show timeline
- 2026-06-13 Listed $124,900 MLSNOW
- 2003-04-21 Sold (Public Records) $41,500 Public Records
- 1998-03-25 Sold (Public Records) $20,000 Public Records
Property tax history
-16.7%/yrLatest (2024): $521 · +74.5% YoY. Source: county tax records.
Cash-flow waterfall
monthlySold comps — $/sqft
last 12 mo · ≤1 miLoading sold comps…