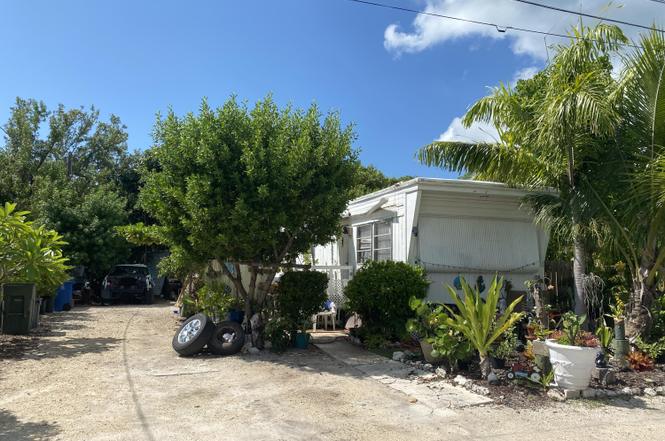
190 Garden St · Tavernier, FL
Flood risk 9/10 · Severe
- FEMA flood zone
- AE
- Chance of flooding over 30 yrs
- 0.99%
- Est. flood insurance / yr
- $1,737 – $8,500
Fire risk 1/10 · Minimal
- Est. fire insurance / yr
- $947 – $1,759
Heat risk No data
- Hot days now (above threshold)
- —
- Hot days in 30 yrs
- —
Wind risk 10/10 · Severe
- Chance of severe wind over 30 yrs
- 99.0%
Air-quality risk 2/10 · Minimal
- Unhealthy air days now
- 1 days/yr
- Unhealthy air days in 30 yrs
- 1 days/yr
Risk factors via First Street. Map © Google.
Why this score? — see what drove the B grade
The composite is a weighted blend of 9 inputs, each scored 0–100. Each bar is that input's sub-score; the figure is the points it added to the 100-point composite (weight × sub-score).
- Cash flow +24.9/30.0
- ARV discount +15.0/15.0
- DSCR +8.1/10.0
- 1% rule +5.9/10.0
- Appreciation +5.2/10.0
- Schools +4.6/10.0
- Livability +3.0/5.0
- Rent growth +2.5/5.0
- Condition / age +2.5/5.0
$265,000
🖨 Deal sheet 📄 Offer letter ✓ Due diligence
Listing remarks
Welcome to this mobile home in Tavernier! This cozy 2-bedroom, 1-bathroom mobile home offers the perfect blend of affordability and location. Nestled in a prime spot close to the beach, boat ramps, picnic areas, and ball fields. Tavernier is known for its picturesque surroundings, friendly community, and easy access to local amenities, shops, and dining options.
Key facts
- Close to the beach
- Local amenities
- Boat ramps
Tags
Property features AI
Finance
- Other: Zoned URM - Urban Res Mobile Home District; Lot less than 1/4 acre (0.09 acres); Flood zone AE
- Financial info: No seller financing; Rentals allowed with restrictions (minimum 28 days); Pets allowed
- HOA & community: No association fees; No first right of refusal; No HOA amenities included
Exterior
- Parking: Open parking
- Security: No security system
- Utilities: FKAA water; Municipal sewer with public sewer hook-up
- Home design: Manufactured single wide; Built in 1966; Located on the ocean side; Mile marker 92.5
- Construction: Manufactured construction
- Exterior features: Fencing; No dockage (no boat slip); Ocean side location
Interior
- Kitchen: Oven; Range; Refrigerator; Dishwasher
- Bathrooms: 1 full bathroom
- Heating & cooling: Window/Wall unit
- Interior features: Window/wall unit cooling and heating; Unfurnished
- Laundry & utility: Washer; Dryer
Neighborhood map
What this means for you Summary
Snapshot
- This is a 2-bed/1.0-bath manufactured listed at $265k.
Deal economics
- At list price, monthly cash flow is $146 ($2k/yr) — positive.
- The deal already cash-flows at list — no discount required.
- Meets the 1% rule at list price ($3k rent vs $265k).
- Recommended offer: $241k (9.0% below list) — sets the bar for market timing.
- Cap rate 8.9% vs local median 1.1% in Tavernier — top-decile yield for the area; either an underpriced asset or a hidden risk that comps aren't pricing in. Stress-test before assuming the spread holds.
Location & tenants
- Location reads 60/100 on livability (#807 in FL) — a middle-class / working-renter tenant base. Strengths: crime A+, housing B; Watch: amenities F, commute F, employment D-.
- Monroe (town): math 50% / reading 55% proficiency, ranked #23 of 73 in FL (top 32%) — acceptable for families but not a draw, mixed tenant base, ~2y average lease.
- Market conditions: 142 active listings in the ZIP; solid renter incomes; 332 units permitted in Monroe County in 2024 (42 in 5+ unit buildings).
Forward outlook
- In year one you build about $3k of equity ($2k loan paydown + $1k appreciation (0.5% local appreciation)).
- Monroe County population projected at +28% by 2050 — long-run rental-demand tailwind backs the buy-and-hold thesis.
- At projected returns (0.5% appreciation + 3.0% rent growth), your $74k cash investment doubles in ~10 years — after that, you're playing with house money.
- By year 9, paydown + projected appreciation supports a ~$31k cash-out refi (75% LTV) — recoverable capital for the next deal without selling this one.
Negotiation context
- It's been on market 109 days — a 9% lower offer ($241k) is reasonable based on typical stale-listing flexibility.
- 5 sale attempts since 13y ago with the ask held roughly flat each time — persistent listings suggest the price (not the market) is what's stuck; bring a comps-based counter.
- Current owner paid $172k; list at $265k implies a 54% gain — meaningful room to come down on a strong offer.
Risks & watch-outs
- Watch-outs: flood insurance adds $427/mo.
- Climate carrying-cost: in FEMA flood zone AE (mandatory federal flood insurance); severe wind risk, 99% chance of damaging wind over 30y — expect insurance premiums to compound above CPI over the hold.
Questions for the listing agent
- It's been on market 109 days. Have you received any prior offers? Is the seller open to a 9% concession, seller financing, or rate buy-down credit?
- Built in 1966 — when were the roof, HVAC, electrical panel, plumbing, and water heater last replaced?
- What's the actual annual flood-insurance premium (NFIP or private), and is the property in a SFHA with mandatory coverage?
- Why hasn't it sold? Are there any deal-killer items the seller is aware of (foundation, flood, title, zoning, code violations)?
- Is there a deadline driving the sale (1031 exchange, divorce, estate, relocation)? That informs how much negotiation room exists.
- Schools are B-rated — typically a magnet for longer-tenancy family renters. What's the average tenant stay here, and is there a school-zone premium baked into asking?
- What's the average days-on-market for RENTAL listings here right now (not sales)? A rising rental-DOM trend means longer vacancies and softer asking-rent achievability than the comps imply.
- What's the recent tenant-quality profile in this submarket — average credit score on applications, eviction rate, late-payment / NSF rate, and stable-employment percentage? A property-management company in the area should have these aggregated.
- How much new for-sale + rental construction is in the pipeline within 1–3 miles? Heavy new supply typically softens prices + rents 12–24 months out; constrained supply supports both.
Investment metrics
- 1% rule
- 1.09% ✓
- Cap rate
- 8.89%
- Cash-on-cash
- 9.26%
- DSCR
- 1.41
- GRM
- 7.7
CMA / ARV
- ARV (on-the-fly)
- $343,860
- Comps found
- 2
Show comp detail 2 sales within ~0.75 mi
| Address | Dist | Beds/Ba | Sqft | Sold | Price | $/sf | Match |
|---|---|---|---|---|---|---|---|
| 154 Garden St | 0.08mi | 2/1.5 | 672 (+2%) | 17mo | $305,000 | $454 | 78 |
| 215 Antigua Rd | 0.62mi | 2/1.0 | 672 (+2%) | 17mo | $350,000 | $521 | 53 |
Match score weights: distance 35% · size 25% · config 20% · recency 20%. Top-matched comps best support the ARV.
Projected returns pro-forma
0.46% appreciation · 3.0% rent growth · sell at horizon
- IRR
- 2.1%
- Equity multiple
- 1.10×
- Total profit
- $7,571
- Equity at exit
- $83,099
- IRR
- 7.2%
- Equity multiple
- 1.82×
- Total profit
- $60,933
- Equity at exit
- $104,940
Cash invested: $74,200 (down + closing). Projections, not guarantees.
Landlord ↔ Tenant lean methodology
- Overall (STATE)
- 87 Strongly Landlord-Friendly
- State Florida
- 87 Strongly Landlord-Friendly · R+3
- County
- — inherits STATE
- City
- — inherits STATE
ZIP-level market 33070
- Home prices YoY
- 0.0%
- Active inventory
- 142
- Price-to-rent
- 7.7×
Monthly cashflow live
- Estimated rent
- $2,879 medium interval (Pro) →
- Mortgage (P&I)
- −$1,390
- Tax from tax record
- −$202 /mo · $2,420/yr
- Insurance
- −$110
- Flood insurance flood zone
- −$427 /mo · $5,118/yr
- HOA
- −$0
- Vacancy / Maint / Mgmt
- −$605
- Net cashflow
- $146
Break-even live
UW: 25.0% down · 7.5% · 30yr · 1.5% tax · 5.0% vac · 8.0% maint · 8.0% mgmt
Financing live
Cash to close
- Down payment
- $66,250
- Closing costs
- $7,950
- Reserves months
- —
- Total cash needed
- —
Loan-product check · same deal, 3 products live
Conventional
25% down · 7.5% · 30yr
- Down + closing
- —
- Monthly P&I
- —
- Monthly cashflow
- —
- DSCR
- —
- Eligible?
- —
Personal DTI + credit; lowest rate.
DSCR
20% down · 8.5% · 30yr
- Down + closing
- —
- Monthly P&I
- —
- Monthly cashflow
- —
- DSCR
- —
- Eligible?
- —
No personal income docs; deal must DSCR.
Hard money
10% down · 12.0% · 12mo
- Down + closing
- —
- Monthly P&I
- —
- Monthly cashflow
- —
- DSCR
- —
- Eligible?
- —
Short-term bridge; refi at stabilization.
Listing history 32 events
-
2026-06-19days on market $265,000 Active 109 DOM
-
2026-06-18days on market $265,000 Active 108 DOM
-
2026-06-17days on market $265,000 Active 107 DOM
-
2026-06-16days on market $265,000 Active 106 DOM
-
2026-06-15days on market $265,000 Active 105 DOM
-
2026-06-14days on market $265,000 Active 103 DOM
-
2026-06-13days on market $265,000 Active 102 DOM
-
2026-06-10days on market $265,000 Active 100 DOM
-
2026-06-09days on market $265,000 Active 99 DOM
-
2026-06-08days on market $265,000 Active 98 DOM
-
2026-06-07days on market $265,000 Active 97 DOM
-
2026-06-05days on market $265,000 Active 94 DOM
-
2026-06-03days on market $265,000 Active 93 DOM
-
2026-06-02days on market $265,000 Active 92 DOM
-
2026-06-01days on market $265,000 Active 91 DOM
-
2026-05-31days on market $265,000 Active 90 DOM
-
2026-05-30days on market $265,000 Active 89 DOM
-
2026-03-02$265,000 Active
-
2026-03-02historical
-
2024-08-31historical
-
2024-02-28price $270,000
-
2024-01-05price $280,000
-
2023-10-30price $290,000
-
2023-09-08$300,000 Active
-
2023-09-08$270,000 Active
-
2020-05-15historical
-
2020-05-15historical
-
2014-11-30$109,000
-
2013-12-17$114,900
-
2005-11-28soldstatus $172,500
-
1990-10-01soldstatus $40,000
-
1986-12-01soldstatus $31,500
ⓘ Source: listings_history table (triggers on properties + properties_extension) + one-shot
backfill from property_details.listing_events for pre-trigger history.
Tax reassessment forecast FL · Resets to sale price
- Current annual tax
- $2,420 · $202/mo
- Projected year-2 tax
- $2,420 · $202/mo
- Expected delta
- $0/yr ($0/mo · 0.0%)
ⓘ Screening estimate from a state-policy table — verify with the county assessor before closing.
Climate risk First Street
- Flood 9/10 Extreme FEMA zone AE · 99% chance over 30 yrs
- Wildfire 1/10 Low
- Wind 10/10 Extreme 99% chance of damaging wind over 30 yrs
- Air quality 2/10 Low 1 unhealthy d/yr today · 1 by 30 yrs out
Nearby sold comps map
Loading sold comps map…
Walkable amenities ~0.75 mi
Loading nearby amenities…
Taxation est. · year 1
- Rental income
- $34,551
- − Mortgage interest
- −$14,844
- − Property taxes
- −$2,420
- − Insurance
- −$6,444
- − Repairs & maintenance
- −$2,764
- − Management
- −$2,764
- − Depreciation
- −$7,709
- Taxable loss
- −$2,394
- Est. tax savings @ 24.0%
- +$575
- After-tax cash flow
- $2,330/yr
For passive investors: Depreciation is non-cash, so a rental often shows a tax loss while cash-flowing — sheltering income. Rental losses are passive: they offset passive income freely, and up to $25,000/yr can offset ordinary (W-2) income if you actively participate and your MAGI is under $100k (phasing out to $0 by $150k); unused losses carry forward. On sale, claimed depreciation is recaptured at up to 25%, and gains may owe capital-gains tax (a 1031 exchange can defer both). Figures are a year-1 estimate at your 24.0% rate — not tax advice; consult a CPA.
Schools (NCES district)
- District
- Monroe
- NCES district ID
- 1201320
- Math proficiency
- 50% ▼ -14.00%
- Reading proficiency
- 55% ▼ -6.00%
- Median HH income
- $56,955
- Composite
- 45.51/100
- National rank
- #2608
- State rank
- #23 of 73 in FL
Livability — Tavernier
- Score
- 60/100
- State rank
- #807
- US rank
- #19118
Category grades
Schools grade is shown separately in the Schools card above.
Census & demographics
- Census place
- Tavernier, FL
- County
- Monroe County · 66,185 people
- City population
- 5,614
- Metro
- Key West, FL
- Population (ZIP)
- 5,768
- Household income
- $75,436
- Rent vs Own
- Severe rent burden
- 204.0
Population outlook (Monroe County) Hauer SSP2
- Today (2025)
- 90,706 people
- By 2030
- 96,308 · +6.2%
- By 2040
- 106,565 · +17.5%
- By 2050
- 116,500 · +28.4%
- By 2075
- 141,423 · +55.9%
- By 2100
- 151,947 · +67.5%
Race, ethnicity, and origin ACS 2023
- Neighborhood character
- Predominantly White (75%)
- Race & ethnicity
- White 75% Hispanic / Latino 22% Two or more races 12% Black 1%
- Hispanic origin (detail)
- Mexican 2% Cuban 15%
- Common ancestry
- Romanian 5% Lithuanian 3% Slovak 2%
- Foreign-born
- 16% · Canada, Guatemala, Jamaica
- Languages at home
- 80% English-only · Spanish 17% Russian/Polish/Slavic 2%
Political lean MEDSL · Monroe
- 2024 margin
- R (+18.3) · D 40.5% · R 58.8%
- 2008→2024 swing
- -23.2pp toward R · 2008: 4.9pp · 2024: -18.3pp
- All cycles
- 2024: R+18.3 2020: R+7.9 2016: R+6.9 2012: D+0.4 2008: D+4.9
Not yet ingested
- Civics
- —
Market trends
- HPI YoY
- ▲ 0.46%
- Current HPI
- 1058.63
- Rent YoY
- —
- Metro
- Key West, FL
- State GDP YoY
- ▲ 3.28%
- F500 in state
- 36
Industry mix (Fortune 500 HQ in FL)
| Industry | F500 HQs | Revenue |
|---|---|---|
| Industrial Technology | 2 | $29B |
|
||
| Insurance | 2 | $17B |
|
||
| Retail | 1 | $60B |
|
||
| Technology Distribution | 1 | $58B |
|
||
| Homebuilding | 1 | $35B |
|
||
| Technology Manufacturing | 1 | $35B |
|
||
Price history
+741.3% since first listed15 events — show timeline
- 2026-03-02 Listing Removed — FLKMLS
- 2026-03-02 Listed $265,000 FLKMLS
- 2024-08-31 Listing Removed — MARMLS
- 2024-02-28 Price Changed $270,000 FLKMLS
- 2024-01-05 Price Changed $280,000 FLKMLS
- 2023-10-30 Price Changed $290,000 FLKMLS
- 2023-09-08 Listed $270,000 MARMLS
- 2023-09-08 Listed $300,000 FLKMLS
- 2020-05-15 Listing Removed — FLKMLS
- 2020-05-15 Listing Removed — FLKMLS
- 2014-11-30 Listed $109,000 FLKMLS
- 2013-12-17 Listed $114,900 FLKMLS
- 2005-11-28 Sold (Public Records) $172,500 Public Records
- 1990-10-01 Sold (Public Records) $40,000 Public Records
- 1986-12-01 Sold (Public Records) $31,500 Public Records
Property tax history
+5.1%/yrLatest (2025): $2,420 · +4.9% YoY. Source: county tax records.
Cash-flow waterfall
monthlySold comps — $/sqft
last 12 mo · ≤1 miLoading sold comps…