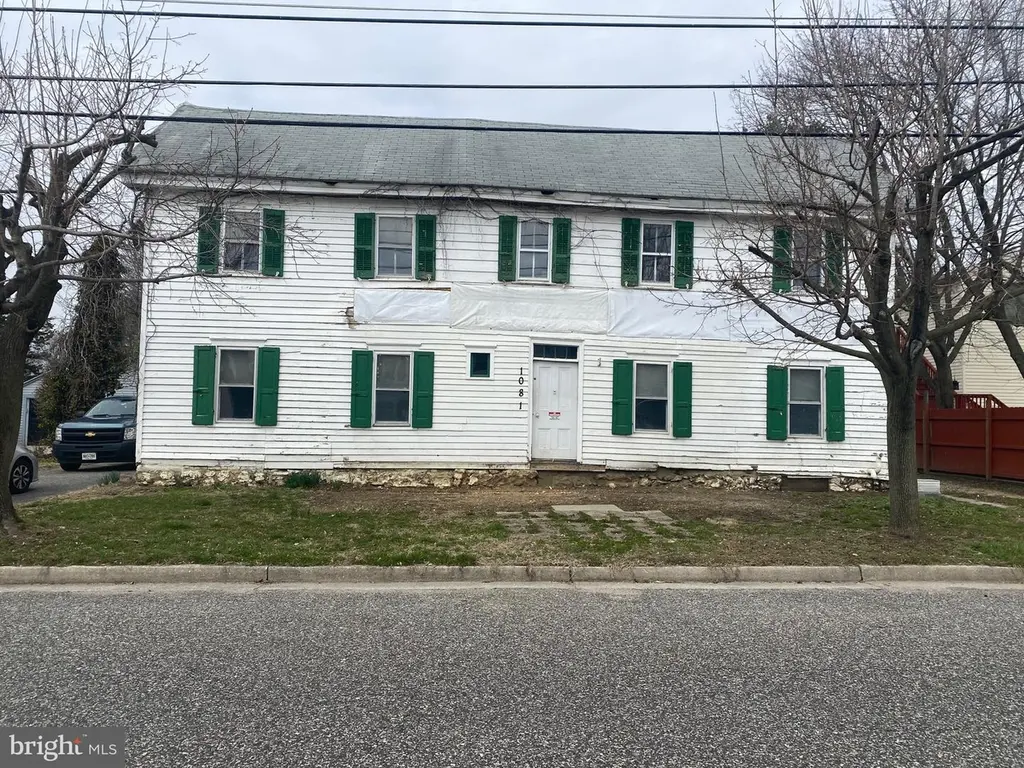
1081 Kings Hwy · Auburn, NJ
Flood risk No data
- FEMA flood zone
- —
- Chance of flooding over 30 yrs
- —
- Est. flood insurance / yr
- —
Fire risk No data
- Est. fire insurance / yr
- —
Heat risk No data
- Hot days now (above threshold)
- —
- Hot days in 30 yrs
- —
Wind risk No data
- Chance of severe wind over 30 yrs
- —
Air-quality risk No data
- Unhealthy air days now
- —
- Unhealthy air days in 30 yrs
- —
Risk factors via First Street. Map © Google.
Why this score? — see what drove the B+ grade
The composite is a weighted blend of 9 inputs, each scored 0–100. Each bar is that input's sub-score; the figure is the points it added to the 100-point composite (weight × sub-score).
- Cash flow +30.0/30.0
- 1% rule +10.0/10.0
- DSCR +10.0/10.0
- Appreciation +10.0/10.0
- ARV discount +7.5/15.0
- Schools +3.3/10.0
- Rent growth +2.5/5.0
- Livability +2.5/5.0
- Condition / age +2.5/5.0
$85,000
🖨 Deal sheet 📄 Offer letter ✓ Due diligence
Listing remarks MLS
Attention history lovers! This large home was originally a tavern and stagecoach stop for weary travelers. The home is in need of major repair but showcases large rooms, two staircases and wide plank floors in many areas. Although not currently in use there are 5 fireplaces, including a walk-in fireplace in the kitchen. The small mailroom is still intact. There is an additional building that can serve as a garage and workshop. Use your vision to bring back the glory of this home and unlock its potential.
Key facts
- Large rooms
- Five fireplaces
- Two staircases
Tags
Neighborhood map
What this means for you Summary
Snapshot
- This is a 4-bed/1.0-bath single-family listed at $85k.
Deal economics
- At list price, monthly cash flow is $1k ($12k/yr) — positive.
- The deal already cash-flows at list — no discount required.
- Meets the 1% rule at list price ($2k rent vs $85k).
- Recommended offer: $80k (6.0% below list) — sets the bar for market timing.
Location & tenants
- Location reads: area grade B — affects rentability + tenant quality, not the cash-flow math above.
- Woodstown-Pilesgrove Regional School District (town): math 23% / reading 48% proficiency, ranked #259 of 472 in NJ (top 55%) — families likely to look elsewhere, expect single-tenant / working-renter base with shorter leases.
- Market conditions: 63 active listings in the ZIP; 95 units permitted in Salem County in 2024 (0 in 5+ unit buildings).
Forward outlook
- In year one you build about $9k of equity ($588 loan paydown + $8k appreciation (10.0% local appreciation)).
- Salem County population projected at -23% by 2050 — secular population decline; favor cash flow + early exit over multi-decade hold.
- At projected returns (10.0% appreciation + 3.0% rent growth), your $24k cash investment doubles in ~2 years — after that, you're playing with house money.
- By year 4, paydown + projected appreciation supports a ~$32k cash-out refi (75% LTV) — recoverable capital for the next deal without selling this one.
Negotiation context
- It's been on market 82 days — a 6% lower offer ($80k) is reasonable based on typical stale-listing flexibility.
- 5 sale attempts since 2y ago with the ask held roughly flat each time — persistent listings suggest the price (not the market) is what's stuck; bring a comps-based counter.
- Current owner paid $65k; 31% above their basis — modest negotiation headroom, anchor on the comps not their cost.
Risks & watch-outs
- Watch-outs: built in 1750 — expect roof / HVAC / electrical / plumbing capex.
Questions for the listing agent
- It's been on market 82 days. Have you received any prior offers? Is the seller open to a 6% concession, seller financing, or rate buy-down credit?
- Built in 1750 — when were the roof, HVAC, electrical panel, plumbing, and water heater last replaced?
- Why hasn't it sold? Are there any deal-killer items the seller is aware of (foundation, flood, title, zoning, code violations)?
- Is there a deadline driving the sale (1031 exchange, divorce, estate, relocation)? That informs how much negotiation room exists.
- What's the average days-on-market for RENTAL listings here right now (not sales)? A rising rental-DOM trend means longer vacancies and softer asking-rent achievability than the comps imply.
- What's the recent tenant-quality profile in this submarket — average credit score on applications, eviction rate, late-payment / NSF rate, and stable-employment percentage? A property-management company in the area should have these aggregated.
- How much new for-sale + rental construction is in the pipeline within 1–3 miles? Heavy new supply typically softens prices + rents 12–24 months out; constrained supply supports both.
Investment metrics
- 1% rule
- 2.37% ✓
- Cap rate
- 20.45%
- Cash-on-cash
- 50.57%
- DSCR
- 3.25
- GRM
- 3.5
CMA / ARV
- ARV (median comp)
- $502,396
- List price
- $85,000
- Delta
- -83.08%
- Verdict
- UNDERPRICED
- Comps
- 6 within 1.0 mi
Show comp detail 2 sales within ~0.75 mi
| Address | Dist | Beds/Ba | Sqft | Sold | Price | $/sf | Match |
|---|---|---|---|---|---|---|---|
| 1096 Kings Hwy | 0.09mi | 4/2.0 | 2,330 (-3%) | 14mo | $399,000 | $171 | 75 |
| 143 County Home Rd | 0.33mi | 3/2.5 (-1) | 2,080 (-13%) | 11mo | $590,000 | $284 | 42 |
Match score weights: distance 35% · size 25% · config 20% · recency 20%. Top-matched comps best support the ARV.
Projected returns pro-forma
10.0% appreciation · 3.0% rent growth · sell at horizon
- IRR
- 64.1%
- Equity multiple
- 5.63×
- Total profit
- $110,200
- Equity at exit
- $76,575
- IRR
- 57.7%
- Equity multiple
- 12.53×
- Total profit
- $274,350
- Equity at exit
- $165,136
Cash invested: $23,800 (down + closing). Projections, not guarantees.
Landlord ↔ Tenant lean methodology
- Overall (STATE)
- 21 Tenant-Leaning
- State New Jersey
- 21 Tenant-Leaning · D+6
- County
- — inherits STATE
- City
- — inherits STATE
ZIP-level market 08098
- Home prices YoY
- 3.7%
- Active inventory
- 63
- Price-to-rent
- 3.5×
Monthly cashflow live
- Estimated rent
- $2,013 medium interval (Pro) →
- Mortgage (P&I)
- −$446
- Tax est. 1.5%
- −$106 /mo · $1,275/yr
- Insurance
- −$35
- HOA
- −$0
- Vacancy / Maint / Mgmt
- −$423
- Net cashflow
- $1,003
Break-even live
UW: 25.0% down · 7.5% · 30yr · 1.5% tax · 5.0% vac · 8.0% maint · 8.0% mgmt
Financing live
Cash to close
- Down payment
- $21,250
- Closing costs
- $2,550
- Reserves months
- —
- Total cash needed
- —
Loan-product check · same deal, 3 products live
Conventional
25% down · 7.5% · 30yr
- Down + closing
- —
- Monthly P&I
- —
- Monthly cashflow
- —
- DSCR
- —
- Eligible?
- —
Personal DTI + credit; lowest rate.
DSCR
20% down · 8.5% · 30yr
- Down + closing
- —
- Monthly P&I
- —
- Monthly cashflow
- —
- DSCR
- —
- Eligible?
- —
No personal income docs; deal must DSCR.
Hard money
10% down · 12.0% · 12mo
- Down + closing
- —
- Monthly P&I
- —
- Monthly cashflow
- —
- DSCR
- —
- Eligible?
- —
Short-term bridge; refi at stabilization.
Listing history 19 events
-
2026-06-13statusdays on market $85,000 Pending 82 DOM
-
2026-06-09days on market $85,000 Active 81 DOM
-
2026-06-08days on market $85,000 Active 80 DOM
-
2026-06-07days on market $85,000 Active 79 DOM
-
2026-06-04days on market $85,000 Active 76 DOM
-
2026-06-03days on market $85,000 Active 75 DOM
-
2026-06-02days on market $85,000 Active 74 DOM
-
2026-06-01days on market $85,000 Active 73 DOM
-
2026-05-31days on market $85,000 Active 72 DOM
-
2026-03-20$85,000 Active 510-char remark
Show marketing remark (510 chars)
Attention history lovers! This large home was originally a tavern and stagecoach stop for weary travelers. The home is in need of major repair but showcases large rooms, two staircases and wide plank floors in many areas. Although not currently in use there are 5 fireplaces, including a walk-in fireplace in the kitchen. The small mailroom is still intact. There is an additional building that can serve as a garage and workshop. Use your vision to bring back the glory of this home and unlock its potential.
-
2025-09-08historical
-
2025-08-08status Active
-
2025-08-02historical
-
2025-06-01status Active
-
2025-04-08status Pending
-
2025-04-02$85,000 Active
-
2025-01-17soldstatus $65,000 Closed
-
2024-12-30status Pending
-
2024-12-02$117,500 Active
ⓘ Source: listings_history table (triggers on properties + properties_extension) + one-shot
backfill from property_details.listing_events for pre-trigger history.
Nearby sold comps map
Loading sold comps map…
Walkable amenities ~0.75 mi
Loading nearby amenities…
Taxation est. · year 1
- Rental income
- $24,157
- − Mortgage interest
- −$4,761
- − Property taxes
- −$1,275
- − Insurance
- −$425
- − Repairs & maintenance
- −$1,933
- − Management
- −$1,933
- − Depreciation
- −$2,473
- Taxable income
- $11,358
- Est. tax owed @ 24.0%
- −$2,726
- After-tax cash flow
- $9,309/yr
For passive investors: Depreciation is non-cash, so a rental often shows a tax loss while cash-flowing — sheltering income. Rental losses are passive: they offset passive income freely, and up to $25,000/yr can offset ordinary (W-2) income if you actively participate and your MAGI is under $100k (phasing out to $0 by $150k); unused losses carry forward. On sale, claimed depreciation is recaptured at up to 25%, and gains may owe capital-gains tax (a 1031 exchange can defer both). Figures are a year-1 estimate at your 24.0% rate — not tax advice; consult a CPA.
Schools (NCES district)
- District
- Woodstown-Pilesgrove Regional School District
- NCES district ID
- 3418330
- Math proficiency
- 23% ▼ -25.00%
- Reading proficiency
- 48% ▼ -18.00%
- Median HH income
- $76,323
- Composite
- 33.18/100
- National rank
- #5539
- State rank
- #259 of 472 in NJ
Livability — Auburn
No livability data for this city. (Only ~50 U.S. cities are tracked.)
Census & demographics
- Population (ZIP)
- 9,475
Population outlook (Salem County) Hauer SSP2
- Today (2025)
- 59,905 people
- By 2030
- 57,351 · -4.3%
- By 2040
- 51,837 · -13.5%
- By 2050
- 46,356 · -22.6%
- By 2075
- 36,452 · -39.2%
- By 2100
- 28,907 · -51.7%
Race, ethnicity, and origin ACS 2023
- Neighborhood character
- Predominantly White (76%)
- Race & ethnicity
- White 76% Hispanic / Latino 11% Two or more races 8% Black 8%
- Hispanic origin (detail)
- Mexican 6% Puerto Rican 4%
- Common ancestry
- Romanian 4% Iranian 1% Slovak 1%
- Foreign-born
- 6% · Canada
- Languages at home
- 96% English-only · Spanish 3%
Political lean MEDSL · Salem
- 2024 margin
- R (+19.2) · D 39.6% · R 58.8% · Other 1.6%
- 2008→2024 swing
- -23.1pp toward R · 2008: 3.9pp · 2024: -19.2pp
- All cycles
- 2024: R+19.2 2020: R+12.8 2016: R+15.4 2012: D+0.8 2008: D+3.9
Not yet ingested
- Civics
- —
Market trends
- HPI YoY
- ▲ 10.27%
- Current HPI
- 290.7359
- Rent YoY
- —
- Metro
- —
- State GDP YoY
- ▲ 2.05%
- F500 in state
- 34
Industry mix (Fortune 500 HQ in NJ)
| Industry | F500 HQs | Revenue |
|---|---|---|
| Consumer Goods | 3 | $31B |
|
||
| Pharmaceuticals | 2 | $153B |
|
||
| Technology | 2 | $21B |
|
||
| Insurance | 2 | $20B |
|
||
| Healthcare | 2 | $19B |
|
||
| Financial Services | 1 | $70B |
|
||
Price history
-27.7% since first listed10 events — show timeline
- 2026-03-20 Listed $85,000 BRIGHT MLS
- 2025-09-08 Listing Removed — BRIGHT MLS
- 2025-08-08 Relisted — BRIGHT MLS
- 2025-08-02 Listing Removed — BRIGHT MLS
- 2025-06-01 Relisted — BRIGHT MLS
- 2025-04-08 Pending — BRIGHT MLS
- 2025-04-02 Listed $85,000 BRIGHT MLS
- 2025-01-17 Sold (MLS) $65,000 BRIGHT MLS
- 2024-12-30 Pending — BRIGHT MLS
- 2024-12-02 Listed $117,500 BRIGHT MLS
Cash-flow waterfall
monthlySold comps — $/sqft
last 12 mo · ≤1 miLoading sold comps…