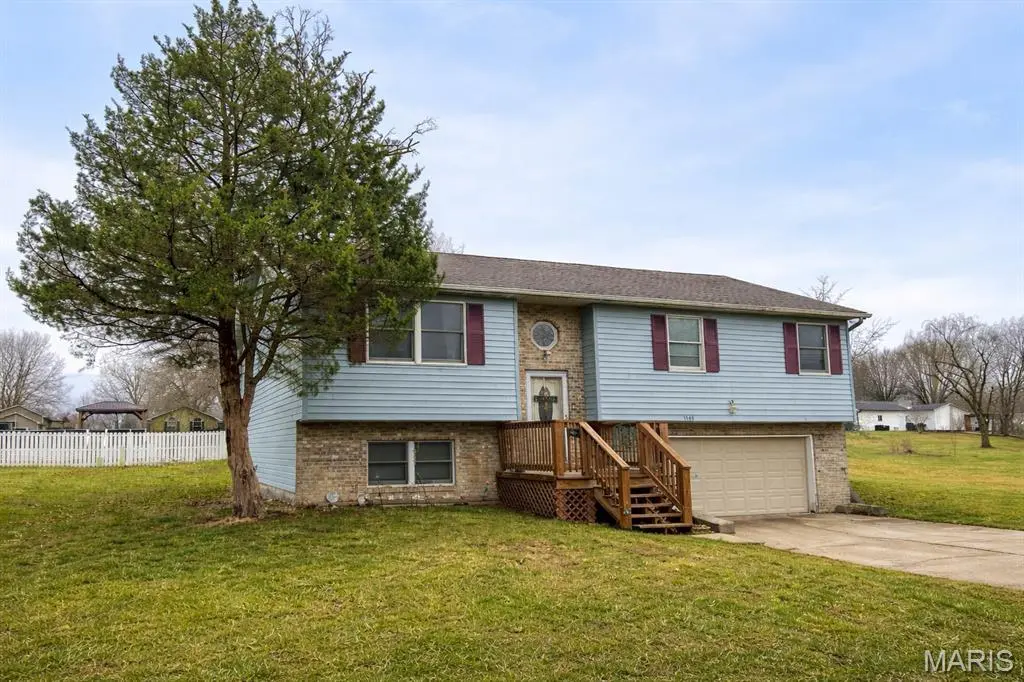
1148 Nassau Dr · Holiday Shores, IL
Flood risk 1/10 · Minimal
- FEMA flood zone
- X
- Chance of flooding over 30 yrs
- 0.0%
- Est. flood insurance / yr
- $507 – $1,088
Fire risk 1/10 · Minimal
- Est. fire insurance / yr
- $804 – $1,492
Heat risk 5/10 · Moderate
- Hot days now (above 107°F)
- 7 days/yr
- Hot days in 30 yrs
- 20 days/yr
Wind risk 2/10 · Minimal
- Chance of severe wind over 30 yrs
- 2.0%
Air-quality risk 2/10 · Minimal
- Unhealthy air days now
- 1 days/yr
- Unhealthy air days in 30 yrs
- 1 days/yr
Risk factors via First Street. Map © Google.
Why this score? — see what drove the F grade
The composite is a weighted blend of 9 inputs, each scored 0–100. Each bar is that input's sub-score; the figure is the points it added to the 100-point composite (weight × sub-score).
- ARV discount +15.0/15.0
- Cash flow +5.3/30.0
- Schools +3.5/10.0
- Livability +3.3/5.0
- Condition / age +2.5/5.0
- Rent growth +1.7/5.0
- 1% rule +1.6/10.0
- DSCR +0.0/10.0
- Appreciation +0.0/10.0
$220,000
🖨 Deal sheet 📄 Offer letter ✓ Due diligence
Listing remarks MLS
Located in the sought-after lake community of Holiday Shores, this well-maintained split-foyer offers over 1,900 finished square feet, 3 bedrooms, and 3 full baths. The main level features a welcoming living space and eat-in kitchen, while the finished lower level adds flexible living space with a full bath — perfect for guests, entertaining, or a home office. Enjoy relaxing on the back deck just up the hill from the lake, plus the convenience of an oversized 28x23 garage with plenty of storage. Experience the comfort and lifestyle Holiday Shores is known for.
Key facts
- 0.26 acre lot
- 2 garage spots
- Built 1991
Neighborhood map
What this means for you Summary
Snapshot
- This is a 2-bed/2.0-bath single-family listed at $220k.
Deal economics
- At list price, monthly cash flow is $-489 ($-6k/yr) — negative.
- To cash-flow at today's rent, offer at most $134k (39.3% below list).
- To meet the 1% rule (rent ≥ 1% of price), the offer needs to be $146k (33.8% below list).
- Recommended offer: $134k (39.3% below list) — sets the bar for cash-flow.
Location & tenants
- Location reads 66/100 on livability (#558 in IL) — a middle-class / working-renter tenant base. Strengths: crime A+, employment A+, cost of living A+; Watch: schools D+, amenities F, commute F.
- Edwardsville CUSD 7 (suburban): math 39% / reading 36% proficiency, ranked #142 of 620 in IL (top 23%) — families likely to look elsewhere, expect single-tenant / working-renter base with shorter leases; only 16% free/reduced lunch — higher-income household profile.
- Market conditions: Rents falling (-3.4%/yr); 203 active listings in the ZIP; solid renter incomes; 336 units permitted in Madison County in 2024 (0 in 5+ unit buildings).
- This rent is only 17% of the median local income ($101k/yr) — well below the 30% rent-burden line; pricing power to push rent on renewal without tenant pushback.
Forward outlook
- Local home prices are declining (-3.0%/yr); year-one equity from $2k of loan paydown is wiped out by about $7k of value loss. Plan a longer hold.
- Madison County population projected at -18% by 2050 — secular population decline; favor cash flow + early exit over multi-decade hold.
Negotiation context
- It's been on market 87 days — a 6% lower offer ($207k) is reasonable based on typical stale-listing flexibility.
- Current owner paid $79k; list at $220k implies a 178% gain — meaningful room to come down on a strong offer.
Risks & watch-outs
- Climate carrying-cost: extreme-heat days projected 7→20/yr by 2055 (HVAC capex compounding) — expect insurance premiums to compound above CPI over the hold.
Questions for the listing agent
- What do current leases actually rent for vs. the listed asking? Can we see a recent rent roll and the last 12 months of T-12 income?
- It's been on market 87 days. Have you received any prior offers? Is the seller open to a 39% concession, seller financing, or rate buy-down credit?
- What does the HOA fee cover, when was the last increase, and are there any pending special assessments or reserve-fund shortfalls?
- Why hasn't it sold? Are there any deal-killer items the seller is aware of (foundation, flood, title, zoning, code violations)?
- Is there a deadline driving the sale (1031 exchange, divorce, estate, relocation)? That informs how much negotiation room exists.
- Schools are D-rated, which usually means shorter tenancies and higher turnover. Who's the typical renter profile here, and what's been the actual vacancy rate?
- The area grade is low — what's the realistic commute time and amenity access for the typical tenant pool here? Any planned neighborhood developments (good or bad) we should know about?
- What's the average days-on-market for RENTAL listings here right now (not sales)? A rising rental-DOM trend means longer vacancies and softer asking-rent achievability than the comps imply.
- What's the recent tenant-quality profile in this submarket — average credit score on applications, eviction rate, late-payment / NSF rate, and stable-employment percentage? A property-management company in the area should have these aggregated.
- How much new for-sale + rental construction is in the pipeline within 1–3 miles? Heavy new supply typically softens prices + rents 12–24 months out; constrained supply supports both.
Investment metrics
- 1% rule
- 0.66% ✗
- Cap rate
- 3.62%
- Cash-on-cash
- -9.53%
- DSCR
- 0.58
- GRM
- 12.6
CMA / ARV
- ARV (median comp)
- $305,438
- List price
- $220,000
- Delta
- -27.97%
- Verdict
- UNDERPRICED
- Comps
- 20 within 1.0 mi
Show comp detail 6 sales within ~0.75 mi
| Address | Dist | Beds/Ba | Sqft | Sold | Price | $/sf | Match |
|---|---|---|---|---|---|---|---|
| 1145 Nassau Dr | 0.04mi | 3/3.0 (+1) | 2,618 (+3%) | 8mo | $360,000 | $138 | 77 |
| 1149 Bermuda Dr | 0.02mi | 3/2.0 (+1) | 2,230 (-12%) | 2mo | $219,900 | $99 | 72 |
| 1711 Su Twan Dr | 0.42mi | 3/2.5 (+1) | 2,524 (-0%) | 20mo | $319,900 | $127 | 57 |
| 1823 Port Ln | 0.40mi | 3/3.0 (+1) | 2,650 (+5%) | 10mo | $699,900 | $264 | 56 |
| 1986 Sextant Dr | 0.41mi | 3/2.5 (+1) | 2,430 (-4%) | 24mo | $325,000 | $134 | 47 |
| 1738 Fountainbleu Dr | 0.52mi | 3/3.0 (+1) | 2,157 (-15%) | 5mo | $345,000 | $160 | 38 |
Match score weights: distance 35% · size 25% · config 20% · recency 20%. Top-matched comps best support the ARV.
Projected returns pro-forma
-3.0% appreciation · 0.0% rent growth · sell at horizon
- IRR
- -37.0%
- Equity multiple
- -0.15×
- Total profit
- $-70,994
- Equity at exit
- $32,803
- IRR
- -78.3%
- Equity multiple
- -0.92×
- Total profit
- $-118,064
- Equity at exit
- $19,022
Cash invested: $61,600 (down + closing). Projections, not guarantees.
Landlord ↔ Tenant lean methodology
- Overall (STATE)
- 43 Moderately Tenant-Leaning
- State Illinois
- 43 Moderately Tenant-Leaning · D+7
- County
- — inherits STATE
- City
- — inherits STATE
ZIP-level market 62025
- Home prices YoY
- -22.2%
- Rents YoY
- -3.4%
- Active inventory
- 203
- Price-to-rent
- 12.6×
Monthly cashflow live
- Estimated rent
- $1,456 medium interval (Pro) →
- Mortgage (P&I)
- −$1,154
- Tax from tax record
- −$331 /mo · $3,976/yr
- Insurance
- −$92
- HOA
- −$63
- Vacancy / Maint / Mgmt
- −$306
- Net cashflow
- $-489
Break-even live
UW: 25.0% down · 7.5% · 30yr · 1.5% tax · 5.0% vac · 8.0% maint · 8.0% mgmt
Financing live
Cash to close
- Down payment
- $55,000
- Closing costs
- $6,600
- Reserves months
- —
- Total cash needed
- —
Loan-product check · same deal, 3 products live
Conventional
25% down · 7.5% · 30yr
- Down + closing
- —
- Monthly P&I
- —
- Monthly cashflow
- —
- DSCR
- —
- Eligible?
- —
Personal DTI + credit; lowest rate.
DSCR
20% down · 8.5% · 30yr
- Down + closing
- —
- Monthly P&I
- —
- Monthly cashflow
- —
- DSCR
- —
- Eligible?
- —
No personal income docs; deal must DSCR.
Hard money
10% down · 12.0% · 12mo
- Down + closing
- —
- Monthly P&I
- —
- Monthly cashflow
- —
- DSCR
- —
- Eligible?
- —
Short-term bridge; refi at stabilization.
HOA detail
- Monthly dues
- $63 · $756/yr
Listing history 6 events
-
2026-06-01days on market $220,000 Active 87 DOM
-
2026-05-31days on market $220,000 Active 86 DOM
-
2026-03-07$220,000 Active 572-char remark
Show marketing remark (572 chars)
Located in the sought-after lake community of Holiday Shores, this well-maintained split-foyer offers over 1,900 finished square feet, 3 bedrooms, and 3 full baths. The main level features a welcoming living space and eat-in kitchen, while the finished lower level adds flexible living space with a full bath — perfect for guests, entertaining, or a home office. Enjoy relaxing on the back deck just up the hill from the lake, plus the convenience of an oversized 28x23 garage with plenty of storage. Experience the comfort and lifestyle Holiday Shores is known for.
-
2026-03-06historical $220,000 572-char remark
Show marketing remark (572 chars)
Located in the sought-after lake community of Holiday Shores, this well-maintained split-foyer offers over 1,900 finished square feet, 3 bedrooms, and 3 full baths. The main level features a welcoming living space and eat-in kitchen, while the finished lower level adds flexible living space with a full bath — perfect for guests, entertaining, or a home office. Enjoy relaxing on the back deck just up the hill from the lake, plus the convenience of an oversized 28x23 garage with plenty of storage. Experience the comfort and lifestyle Holiday Shores is known for.
-
1994-08-31soldstatus $79,000
-
1992-03-19soldstatus $73,000
ⓘ Source: listings_history table (triggers on properties + properties_extension) + one-shot
backfill from property_details.listing_events for pre-trigger history.
Tax reassessment forecast IL · Partial reset (capped growth)
- Current annual tax
- $3,976 · $331/mo
- Projected year-2 tax
- $4,485 · $374/mo
- Expected delta
- +$509/yr (+$42/mo · 12.8%)
ⓘ Screening estimate from a state-policy table — verify with the county assessor before closing.
Climate risk First Street
- Flood 1/10 Low FEMA zone X · 0% chance over 30 yrs
- Wildfire 1/10 Low
- Heat 5/10 Major 7 d/yr ≥107°F today · 20 d/yr by 30 yrs out
- Wind 2/10 Low 2% chance of damaging wind over 30 yrs
- Air quality 2/10 Low 1 unhealthy d/yr today · 1 by 30 yrs out
Nearby sold comps map
Loading sold comps map…
Walkable amenities ~0.75 mi
Loading nearby amenities…
Taxation est. · year 1
- Rental income
- $17,472
- − Mortgage interest
- −$12,323
- − Property taxes
- −$3,976
- − Insurance
- −$1,100
- − Repairs & maintenance
- −$1,398
- − Management
- −$1,398
- − HOA
- −$756
- − Depreciation
- −$6,400
- Taxable loss
- −$9,879
- Est. tax savings @ 24.0%
- +$2,371
- After-tax cash flow
- $-3,502/yr
For passive investors: Depreciation is non-cash, so a rental often shows a tax loss while cash-flowing — sheltering income. Rental losses are passive: they offset passive income freely, and up to $25,000/yr can offset ordinary (W-2) income if you actively participate and your MAGI is under $100k (phasing out to $0 by $150k); unused losses carry forward. On sale, claimed depreciation is recaptured at up to 25%, and gains may owe capital-gains tax (a 1031 exchange can defer both). Figures are a year-1 estimate at your 24.0% rate — not tax advice; consult a CPA.
Schools (NCES district)
- District
- Edwardsville CUSD 7
- NCES district ID
- 1713530
- Math proficiency
- 39% ▼ -12.00%
- Reading proficiency
- 36% ▼ -17.00%
- Median HH income
- $72,131
- Composite
- 34.56/100
- National rank
- #5169
- State rank
- #142 of 620 in IL
Livability — Holiday Shores
- Score
- 66/100
- State rank
- #558
- US rank
- #11744
Category grades
Schools grade is shown separately in the Schools card above.
Census & demographics
- Census place
- Holiday Shores, IL
- County
- Madison County · 189,064 people
- Metro
- St. Louis, MO-IL
- Population (ZIP)
- 35,520
- Household income
- $100,741
- Rent vs Own
- Severe rent burden
- 1027.0
Population outlook (Madison County) Hauer SSP2
- Today (2025)
- 258,371 people
- By 2030
- 251,523 · -2.7%
- By 2040
- 233,640 · -9.6%
- By 2050
- 213,042 · -17.5%
- By 2075
- 165,255 · -36.0%
- By 2100
- 123,953 · -52.0%
Race, ethnicity, and origin ACS 2023
- Neighborhood character
- Predominantly White (87%)
- Race & ethnicity
- White 87% Black 5% Two or more races 4% Hispanic / Latino 3% Asian 2%
- Common ancestry
- Romanian 2% Lithuanian 2% Slovak 2%
- Foreign-born
- 3% · Canada, China
- Languages at home
- 96% English-only · Spanish 2% Other Indo-European 1%
Political lean MEDSL · Madison
- 2024 margin
- R (+13.3) · D 42.5% · R 55.8% · Other 1.8%
- 2008→2024 swing
- -22.5pp toward R · 2008: 9.2pp · 2024: -13.3pp
- All cycles
- 2024: R+13.3 2020: R+13.2 2016: R+15.6 2012: R+1.4 2008: D+9.2
Not yet ingested
- Civics
- —
Market trends
- HPI YoY
- ▼ -70.36%
- Current HPI
- 245.9787
- Rent YoY
- ▼ -3.37%
- Metro
- St. Louis, MO-IL
- State GDP YoY
- ▲ 1.59%
- F500 in state
- 60
Industry mix (Fortune 500 HQ in IL)
| Industry | F500 HQs | Revenue |
|---|---|---|
| Insurance | 4 | $201B |
|
||
| Consumer Goods | 4 | $87B |
|
||
| Industrial Machinery | 3 | $64B |
|
||
| Healthcare | 2 | $55B |
|
||
| Retail / Pharmacy | 1 | $148B |
|
||
| Agriculture / Food | 1 | $86B |
|
||
Price history
+201.4% since first listed4 events — show timeline
- 2026-03-07 Listed $220,000 MARIS as Distributed by MLS Grid
- 2026-03-06 Coming Soon $220,000 MARIS as Distributed by MLS Grid
- 1994-08-31 Sold (Public Records) $79,000 Public Records
- 1992-03-19 Sold (Public Records) $73,000 Public Records
Property tax history
+3.7%/yrLatest (2024): $3,976 · +7.7% YoY. Source: county tax records.
Cash-flow waterfall
monthlySold comps — $/sqft
last 12 mo · ≤1 miLoading sold comps…