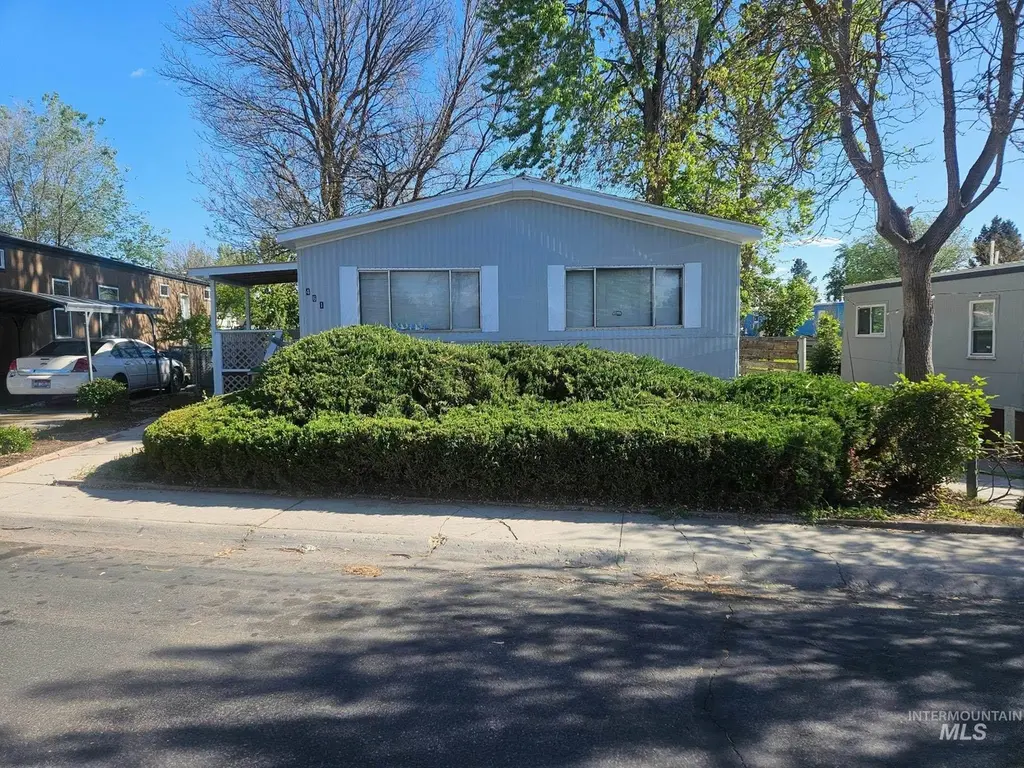
461 W Greenleaf St · Boise City, ID
Flood risk No data
- FEMA flood zone
- —
- Chance of flooding over 30 yrs
- —
- Est. flood insurance / yr
- —
Fire risk No data
- Est. fire insurance / yr
- —
Heat risk No data
- Hot days now (above threshold)
- —
- Hot days in 30 yrs
- —
Wind risk No data
- Chance of severe wind over 30 yrs
- —
Air-quality risk No data
- Unhealthy air days now
- —
- Unhealthy air days in 30 yrs
- —
Risk factors via First Street. Map © Google.
Why this score? — see what drove the C- grade
The composite is a weighted blend of 9 inputs, each scored 0–100. Each bar is that input's sub-score; the figure is the points it added to the 100-point composite (weight × sub-score).
- Cash flow +15.0/30.0
- ARV discount +15.0/15.0
- 1% rule +5.0/10.0
- DSCR +5.0/10.0
- Schools +4.2/10.0
- Rent growth +3.5/5.0
- Condition / age +2.8/5.0
- Livability +2.5/5.0
- Appreciation +0.0/10.0
$39,900
🖨 Deal sheet 📄 Offer letter ✓ Due diligence
Listing remarks
Well-maintained mobile home offering comfort, flexibility, and room to make it your own. All fresh exterior paint with some fresh interior paint to match, this home is move-in ready while leaving plenty of room to add your personal touch. Situated on a large lot, you'll enjoy outdoor space that's hard to come by in a mobile home at this price point. A rare covered patio perfect for relaxing and staying cool on a summer day, while TWO spacious storage sheds (10'x10' & 10'x9') provide excellent space for tools, hobbies, or extra storage. Priced to sell - the seller is motivated and offering this great opportunity for a buyer seeking value, space, and potential.
Key facts
- 2 parking spots
- Built 1981
- Listed 23 days
Property features AI
Finance
- Other: Small lot (approximately 5,999 sq ft) — within the mobile home park
- HOA & community: Monthly association fee ($1,040)
Exterior
- Parking: Two covered parking spaces; Two-car carport
- Utilities: Community water service; Sewer connected; Paved road access
- Home design: Mobile/manufactured home on a rented lot; Built in 1981
- Construction: Year built 1981
- Exterior features: Covered patio/deck; Storage shed; Located in a mobile home park
Interior
- Kitchen: Kitchen on main level (~11 x 9); Built-in oven/range; Refrigerator; Garbage disposal
- Bedrooms: Three bedrooms, all on the main level (primary ~12 x 12; Bedroom 2 ~12 x 12; Bedroom 3 ~12 x 11)
- Flooring: Carpet; Laminate
- Bathrooms: Two bathrooms
- Heating & cooling: No central heating listed; Ductless / mini-split cooling
- Interior features: Main-level primary bedroom; Great room; Solid surface countertops
- Laundry & utility: Washer and dryer present; Utility room on main level (~9 x 6)
Neighborhood map
What this means for you Summary
Snapshot
- This is a 3-bed/2.0-bath manufactured listed at $40k. Condition is rated average.
Deal economics
- At list price, monthly cash flow is $41 ($492/yr) — positive.
- The deal already cash-flows at list — no discount required.
- Meets the 1% rule at list price ($2k rent vs $40k).
- Recommended offer: $39k (1.5% below list) — sets the bar for market timing.
- Cap rate 7.5% vs local median 2.6% in Boise City — top-decile yield for the area; either an underpriced asset or a hidden risk that comps aren't pricing in. Stress-test before assuming the spread holds.
Location & tenants
- Location reads: area grade C — affects rentability + tenant quality, not the cash-flow math above.
- Boise Independent District (urban): math 42% / reading 56% proficiency, ranked #36 of 92 in ID (top 39%) — families likely to look elsewhere, expect single-tenant / working-renter base with shorter leases.
- Market conditions: Rents rising fast (+4.0%/yr); 135 active listings in the ZIP; 19 comparable units currently listed for rent nearby; rentals at typical pace (median 15d on market — plan ~3-4 weeks tenant-placement turnaround); solid renter incomes; 5,129 units permitted in Ada County in 2024 (414 in 5+ unit buildings).
Forward outlook
- Local home prices are declining (-3.0%/yr); year-one equity from $276 of loan paydown is wiped out by about $1k of value loss. Plan a longer hold.
- Ada County population projected at +45% by 2050 — long-run rental-demand tailwind backs the buy-and-hold thesis.
- At projected returns (-3.0% appreciation + 4.0% rent growth), your $11k cash investment doubles in ~9 years — after that, you're playing with house money.
Negotiation context
- It's been on market 23 days — a 2% lower offer ($39k) is reasonable based on typical stale-listing flexibility.
- 2 sale attempts with the ask held roughly flat each time — persistent listings suggest the price (not the market) is what's stuck; bring a comps-based counter.
Risks & watch-outs
- Watch-outs: HOA is 61% of rent.
Questions for the listing agent
- What does the HOA fee cover, when was the last increase, and are there any pending special assessments or reserve-fund shortfalls?
- Is there a deadline driving the sale (1031 exchange, divorce, estate, relocation)? That informs how much negotiation room exists.
- What's the average days-on-market for RENTAL listings here right now (not sales)? A rising rental-DOM trend means longer vacancies and softer asking-rent achievability than the comps imply.
- What's the recent tenant-quality profile in this submarket — average credit score on applications, eviction rate, late-payment / NSF rate, and stable-employment percentage? A property-management company in the area should have these aggregated.
- How much new for-sale + rental construction is in the pipeline within 1–3 miles? Heavy new supply typically softens prices + rents 12–24 months out; constrained supply supports both.
Investment metrics
- 1% rule
- 4.30% ✓
- Cap rate
- 7.53%
- Cash-on-cash
- 4.40%
- DSCR
- 1.20
- GRM
- 1.9
CMA / ARV
- ARV (on-the-fly)
- $74,976
- Comps found
- 12
Show comp detail 12 sales within ~0.75 mi
| Address | Dist | Beds/Ba | Sqft | Sold | Price | $/sf | Match |
|---|---|---|---|---|---|---|---|
| 10369 W Florence Ln | 0.17mi | 3/2.0 | 1,064 (+1%) | 3mo | $75,000 | $70 | 88 |
| 315 Driftwood Rd | 0.25mi | 2/2.0 (-1) | 1,056 (0%) | 7mo | $115,000 | $109 | 78 |
| 137 Rainbow Dr | 0.09mi | 3/2.0 | 1,152 (+9%) | 5mo | $137,000 | $119 | 77 |
| 145 N Rainbow Dr | 0.08mi | 2/1.0 (-1) | 968 (-8%) | 5mo | $78,500 | $81 | 70 |
| 376 Bonanza St | 0.21mi | 3/1.5 | 935 (-12%) | 6mo | $49,900 | $53 | 64 |
| 425 Mesquite | 0.35mi | 3/2.0 | 924 (-12%) | 0mo | $54,990 | $60 | 63 |
| 238 N Checola Cir | 0.19mi | 2/2.0 (-1) | 1,200 (+14%) | 1mo | $85,000 | $71 | 63 |
| 505 Greenleaf | 0.47mi | 3/2.0 | 980 (-7%) | 6mo | $85,000 | $87 | 61 |
| 621 Timathy St | 0.54mi | 3/2.0 | 1,152 (+9%) | 3mo | $74,990 | $65 | 57 |
| 618 Empress St | 0.49mi | 2/2.0 (-1) | 975 (-8%) | 4mo | $74,700 | $77 | 56 |
| 540 Meadowland Cir | 0.39mi | 2/2.0 (-1) | 924 (-12%) | 1mo | $46,500 | $50 | 55 |
| 558 Silver City Dr | 0.43mi | 2/2.0 (-1) | 924 (-12%) | 2mo | $39,900 | $43 | 52 |
Match score weights: distance 35% · size 25% · config 20% · recency 20%. Top-matched comps best support the ARV.
Projected returns pro-forma
-3.0% appreciation · 4.01% rent growth · sell at horizon
- IRR
- -3.2%
- Equity multiple
- 0.87×
- Total profit
- $-1,428
- Equity at exit
- $5,949
- IRR
- 11.3%
- Equity multiple
- 2.09×
- Total profit
- $12,202
- Equity at exit
- $3,450
Cash invested: $11,172 (down + closing). Projections, not guarantees.
Landlord ↔ Tenant lean methodology
- Overall (STATE)
- 91 Strongly Landlord-Friendly
- State Idaho
- 91 Strongly Landlord-Friendly · R+18
- County
- — inherits STATE
- City
- — inherits STATE
ZIP-level market 83713
- Home prices YoY
- -26.5%
- Rents YoY
- 4.0%
- Active inventory
- 135
- Price-to-rent
- 1.9×
Monthly cashflow live
- Estimated rent
- $1,717 high interval (Pro) →
- Mortgage (P&I)
- −$209
- Tax est. 1.5%
- −$50 /mo · $598/yr
- Insurance
- −$17
- HOA
- −$1,040
- Vacancy / Maint / Mgmt
- −$361
- Net cashflow
- $41
Break-even live
UW: 25.0% down · 7.5% · 30yr · 1.5% tax · 5.0% vac · 8.0% maint · 8.0% mgmt
Financing live
Cash to close
- Down payment
- $9,975
- Closing costs
- $1,197
- Reserves months
- —
- Total cash needed
- —
Loan-product check · same deal, 3 products live
Conventional
25% down · 7.5% · 30yr
- Down + closing
- —
- Monthly P&I
- —
- Monthly cashflow
- —
- DSCR
- —
- Eligible?
- —
Personal DTI + credit; lowest rate.
DSCR
20% down · 8.5% · 30yr
- Down + closing
- —
- Monthly P&I
- —
- Monthly cashflow
- —
- DSCR
- —
- Eligible?
- —
No personal income docs; deal must DSCR.
Hard money
10% down · 12.0% · 12mo
- Down + closing
- —
- Monthly P&I
- —
- Monthly cashflow
- —
- DSCR
- —
- Eligible?
- —
Short-term bridge; refi at stabilization.
Rent comps 19 comps
| Address | Beds | Baths | Sqft | Rent | $/sqft | DOM | Units | Dist |
|---|---|---|---|---|---|---|---|---|
| 10077 W Rifleman Ln Unit 103 Boise, ID | 2.0 | 2.0 | 860 | $1,395 | $1.62 | 11d | 1 | 0.30mi |
| 9993 W Rosecroft Ct #101 Boise, ID | 2.0 | 2.5 | 1136 | $1,575 | $1.39 | 3d | 1 | 0.42mi |
| 10105 W Garverdale Ln Ste 201 Boise, ID | 2.0 | 2.0 | 915 | $1,350 | $1.48 | 14d | 1 | 0.51mi |
| 9846 W Rosecroft Ct #102 Boise, ID | 2.0 | 2.5 | 1236 | $1,545 | $1.25 | 3d | 1 | 0.51mi |
| 11239 W Gabrielle Dr Boise, ID | 2.0 | 2.5 | 1128 | $1,645 | $1.46 | 23d | 1 | 0.55mi |
| 10096 W Garverdale Ln Boise, ID | 3.0 | 2.0 | 1113 | $1,600 | $1.44 | 23d | 1 | 0.56mi |
| 11383 W Fairview Ave Boise, ID | 2.0 | 2.0 | 1123 | $1,575 | $1.40 | 3d | 4 | 0.66mi |
| 9130 W Irving St Boise, ID | 2.0 | 1.5 | 952 | $1,575 | $1.65 | 3d | 5 | 0.86mi |
| 930 N Maple Grove Rd Boise, ID | 1.0–3.0 | 1.0–2.0 | 950 | $2,333 | $2.46 | 3d | 14 | 1.03mi |
| 9169 W Cory Ln #202 Boise, ID | 2.0 | 1.5 | 968 | $1,395 | $1.44 | 21d | 1 | 1.22mi |
| 8443 W Rifleman St Unit 8443 Boise, ID | 2.0 | 1.0 | 846 | $1,900 | $2.25 | 3d | 1 | 1.29mi |
| 2555 N Workland Ln Unit 202 Boise, ID | 2.0 | 1.0 | 800 | $1,325 | $1.66 | 14d | 1 | 1.31mi |
| 9056 W Sigmont Ln Unit 201 Boise, ID | 2.0 | 2.0 | 900 | $1,300 | $1.44 | 14d | 1 | 1.33mi |
| 10887 W Ustick Rd Boise, ID | 2.0–3.0 | 1.0–2.0 | 874 | $1,605 | $1.84 | 3d | 3 | 1.35mi |
| 10811 W Ustick Rd Boise, ID | 2.0 | 1.0 | 794 | $1,345 | $1.69 | 21d | 1 | 1.37mi |
| 10222 W Ustick Rd Boise, ID | 2.0 | 2.0 | 1010 | $1,575 | $1.56 | 23d | 1 | 1.40mi |
| 10042 W Smoke Ranch Dr Boise, ID | 3.0 | 2.5 | 1478 | $2,050 | $1.39 | 23d | 1 | 1.48mi |
| 2663 N Fastwater Ave Boise, ID | 3.0 | 2.0 | 1204 | $1,795 | $1.49 | 14d | 1 | 1.48mi |
| 8834 W Pine Valley Ln Unit 1 Boise, ID | 3.0 | 2.5 | 1427 | $1,925 | $1.35 | 11d | 1 | 1.49mi |
HOA detail
- Monthly dues
- $1,040 · $12,480/yr
Listing history 3 events
-
2026-05-05status Active
-
2026-04-30status Pending
-
2026-04-24$39,900 Active
ⓘ Source: listings_history table (triggers on properties + properties_extension) + one-shot
backfill from property_details.listing_events for pre-trigger history.
Nearby sold comps map
Loading sold comps map…
Walkable amenities ~0.75 mi
Loading nearby amenities…
Taxation est. · year 1
- Rental income
- $20,608
- − Mortgage interest
- −$2,235
- − Property taxes
- −$598
- − Insurance
- −$200
- − Repairs & maintenance
- −$1,649
- − Management
- −$1,649
- − HOA
- −$12,480
- − Depreciation
- −$1,161
- Taxable income
- $637
- Est. tax owed @ 24.0%
- −$153
- After-tax cash flow
- $339/yr
For passive investors: Depreciation is non-cash, so a rental often shows a tax loss while cash-flowing — sheltering income. Rental losses are passive: they offset passive income freely, and up to $25,000/yr can offset ordinary (W-2) income if you actively participate and your MAGI is under $100k (phasing out to $0 by $150k); unused losses carry forward. On sale, claimed depreciation is recaptured at up to 25%, and gains may owe capital-gains tax (a 1031 exchange can defer both). Figures are a year-1 estimate at your 24.0% rate — not tax advice; consult a CPA.
Condition & rehab AI · 12 photos
This mobile home is move-in ready with some cosmetic updates needed to improve its curb appeal and interior aesthetics.
Repairs flagged
- Moderate kitchen cabinets — dated and in need of replacement
- Moderate bathroom fixtures — dated and in need of replacement
- Minor exterior paint — worn but not peeling
Value-add opportunities
- Both update kitchen cabinets and fixtures — modernizing the kitchen would appeal to both buyers and renters
- Both paint interior walls — fresh paint would improve the home's curb appeal and interior aesthetics
- Both replace exterior paint — new paint would improve the home's curb appeal and increase its value
- Both update bathroom fixtures — modernizing the bathrooms would appeal to both buyers and renters
Renovation cost estimate screening
| Repair item | Severity | Est. cost |
|---|---|---|
| kitchen cabinets · dated and in need of replacement | Moderate | $3,000–15,000 |
| bathroom fixtures · dated and in need of replacement | Moderate | $3,000–15,000 |
| exterior paint · worn but not peeling | Minor | $500–3,000 |
| Total estimated repair cost · 3 items | $6,500–33,000 |
Value-add ROI direction
- Both update kitchen cabinets and fixtures — modernizing the kitchen would appeal to both buyers and renters ↑
- Both paint interior walls — fresh paint would improve the home's curb appeal and interior aesthetics ↑
- Both replace exterior paint — new paint would improve the home's curb appeal and increase its value ↑
- Both update bathroom fixtures — modernizing the bathrooms would appeal to both buyers and renters ↑
ⓘ Cost ranges are severity-bucket heuristics (US national rule-of-thumb). Get contractor quotes + a written scope before underwriting a rehab budget.
Schools (NCES district)
- District
- Boise Independent District
- NCES district ID
- 1600360
- Math proficiency
- 42% ▼ -5.00%
- Reading proficiency
- 56% ▼ -1.00%
- Median HH income
- $49,135
- Composite
- 41.82/100
- National rank
- #3388
- State rank
- #36 of 92 in ID
Livability — Boise City
No livability data for this city. (Only ~50 U.S. cities are tracked.)
Census & demographics
- Census place
- Boise City, ID
- County
- Ada County · 522,161 people
- City population
- 152,689
- Metro
- Boise City, ID
- Population (ZIP)
- 31,549
- Household income
- $91,295
- Rent vs Own
- Severe rent burden
- 805.0
Population outlook (Ada County) Hauer SSP2
- Today (2025)
- 535,818 people
- By 2030
- 585,751 · +9.3%
- By 2040
- 682,435 · +27.4%
- By 2050
- 775,818 · +44.8%
- By 2075
- 994,458 · +85.6%
- By 2100
- 1,148,884 · +114.4%
Race, ethnicity, and origin ACS 2023
- Neighborhood character
- Predominantly White (79%)
- Race & ethnicity
- White 79% Two or more races 10% Hispanic / Latino 10% Asian 3% Black 1%
- Hispanic origin (detail)
- Mexican 8%
- Common ancestry
- Portuguese 4% Slovak 2% Lithuanian 2%
- Foreign-born
- 9% · Canada, Jamaica, China
- Languages at home
- 87% English-only · Spanish 7% Other Indo-European 2% German/W. Germanic 1%
Political lean MEDSL · Ada
- 2024 margin
- R (+10.3) · D 43.4% · R 53.8% · Other 2.8%
- 2008→2024 swing
- -4.2pp toward R · 2008: -6.2pp · 2024: -10.3pp
- All cycles
- 2024: R+10.3 2020: R+3.9 2016: R+9.2 2012: R+11.3 2008: R+6.2
Not yet ingested
- Civics
- —
Market trends
- HPI YoY
- ▼ -122.31%
- Current HPI
- 338.9271
- Rent YoY
- ▲ 4.01%
- Metro
- Boise City, ID
- State GDP YoY
- ▲ 4.51%
- F500 in state
- 6
Industry mix (Fortune 500 HQ in ID)
| Industry | F500 HQs | Revenue |
|---|---|---|
| Retail | 1 | $79B |
|
||
| Technology | 1 | $25B |
|
||
| Food / Agriculture | 1 | $6B |
|
||
Price history
3 events — show timeline
- 2026-05-05 Relisted — IMLS
- 2026-04-30 Pending — IMLS
- 2026-04-24 Listed $39,900 IMLS
Cash-flow waterfall
monthlySold comps — $/sqft
last 12 mo · ≤1 miLoading sold comps…