 🏗️ New Construction
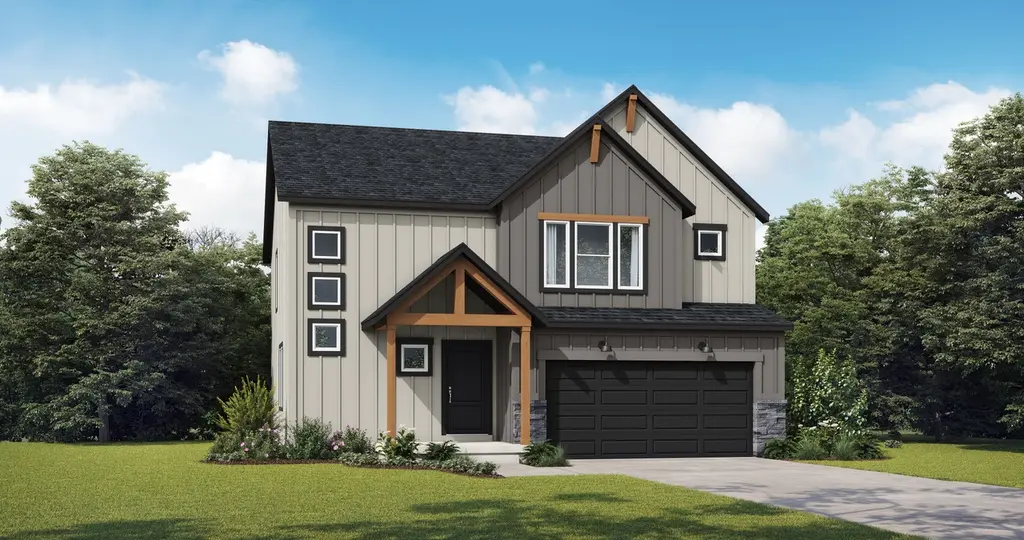
Basswood Plan · Kansas City, MO
Flood risk 1/10 · Minimal
- FEMA flood zone
- X (unshaded)
- Chance of flooding over 30 yrs
- 0.0%
- Est. flood insurance / yr
- $507 – $1,088
Fire risk 4/10 · Minor
- Est. fire insurance / yr
- $1,054 – $1,958
Heat risk 4/10 · Minor
- Hot days now (above 105°F)
- 7 days/yr
- Hot days in 30 yrs
- 16 days/yr
Wind risk 2/10 · Minimal
- Chance of severe wind over 30 yrs
- —
Air-quality risk 3/10 · Minor
- Unhealthy air days now
- 3 days/yr
- Unhealthy air days in 30 yrs
- 4 days/yr
Risk factors via First Street. Map © Google.
Why this score? — see what drove the F grade
The composite is a weighted blend of 9 inputs, each scored 0–100. Each bar is that input's sub-score; the figure is the points it added to the 100-point composite (weight × sub-score).
- ARV discount +7.5/15.0
- Cash flow +6.1/30.0
- Rent growth +4.9/5.0
- Schools +4.5/10.0
- Livability +3.9/5.0
- Condition / age +2.5/5.0
- 1% rule +1.4/10.0
- DSCR +0.4/10.0
- Appreciation +0.0/10.0
$399,400
🖨 Deal sheet (PDF) 📄 Offer letter ✓ Due diligence
Listing remarks MLS
Our Basswood home plan features a modern, open layout designed for comfortable living. The main level highlights a spacious kitchen with a large island that overlooks both the dining and great rooms, making it perfect for entertainment and family gatherings. Additionally, a sizable home office on this level provides a dedicated space for work or study. Upstairs, the primary bedroom is a luxurious retreat with a spa-like bathroom, complete with an oversized countertop, dual sinks, and a walk-in shower. The second floor also includes a large full bath for shared use and a conveniently located laundry room adjacent to the 3 bedrooms. Looking for additional space? Consider finishing the lower level! You can finish this area to include a large rec room, a 5th bedroom and full bathroom, providing additional living space and flexibility.
Key facts
- Spacious kitchen
- Open layout
- Spa-like bathroom
Tags
Neighborhood map
What this means for you Summary
Snapshot
- This is a 4-bed/2.5-bath single-family listed at $399k.
Deal economics
- At list price, monthly cash flow is $-857 ($-10k/yr) — negative.
- To cash-flow at today's rent, offer at most $335k (16.1% below list).
- To meet the 1% rule (rent ≥ 1% of price), the offer needs to be $293k (26.6% below list).
- Recommended offer: $293k (26.6% below list) — sets the bar for 1% rule.
Location & tenants
- Location reads 78/100 on livability (#28 in MO, #2,671 nationally) — a middle-class / working-renter tenant base. Strengths: amenities A+, commute A+, cost of living A+; Watch: crime F.
- Liberty 53 (suburban): math 41% / reading 59% proficiency, ranked #24 of 324 in MO (top 7%) — acceptable for families but not a draw, mixed tenant base, ~2y average lease; only 15% free/reduced lunch — higher-income household profile.
- Zoned schools: Warren Hills Elem. (math 48% / reading 60%, grade C, #215 of 1,115 statewide, top 20%, 603 students, 20% FRL); South Valley Middle (math 33% / reading 53%, grade D-, #134 of 391 statewide, top 35%, 791 students, 18% FRL); Liberty North High School (math 25% / reading 75%, grade D+, #116 of 521 statewide, top 22%, 2,326 students, 18% FRL) — zoned schools at 19% FRL track the district average.
- Market conditions: Rents rising fast (+9.5%/yr); 241 active listings in the ZIP; 1 comparable units currently listed for rent nearby; high-income renter base; 341 units permitted in Clay County in 2024 (40 in 5+ unit buildings).
Forward outlook
- Local home prices are declining (-3.0%/yr); year-one equity from $3k of loan paydown is wiped out by about $14k of value loss. Plan a longer hold.
- Clay County population projected at +24% by 2050 — long-run rental-demand tailwind backs the buy-and-hold thesis.
Negotiation context
- It's been on market 199 days — a 12% lower offer ($351k) is reasonable based on typical stale-listing flexibility.
Questions for the listing agent
- What do current leases actually rent for vs. the listed asking? Can we see a recent rent roll and the last 12 months of T-12 income?
- It's been on market 199 days. Have you received any prior offers? Is the seller open to a 27% concession, seller financing, or rate buy-down credit?
- Why hasn't it sold? Are there any deal-killer items the seller is aware of (foundation, flood, title, zoning, code violations)?
- Is there a deadline driving the sale (1031 exchange, divorce, estate, relocation)? That informs how much negotiation room exists.
- Crime grade is F in this area — have there been break-ins, vandalism, or insurance claims at this property in the last 3 years? What carrier currently insures it and at what premium?
- The area grade is low — what's the realistic commute time and amenity access for the typical tenant pool here? Any planned neighborhood developments (good or bad) we should know about?
- What's the average days-on-market for RENTAL listings here right now (not sales)? A rising rental-DOM trend means longer vacancies and softer asking-rent achievability than the comps imply.
- What's the recent tenant-quality profile in this submarket — average credit score on applications, eviction rate, late-payment / NSF rate, and stable-employment percentage? A property-management company in the area should have these aggregated.
- How much new for-sale + rental construction is in the pipeline within 1–3 miles? Heavy new supply typically softens prices + rents 12–24 months out; constrained supply supports both.
Investment metrics
- 1% rule
- 0.64% ✗
- Cap rate
- 4.05%
- Cash-on-cash
- -8.00%
- DSCR
- 0.64
- GRM
- 13.1
CMA / ARV
- ARV (median comp)
- $459,096
- List price
- $399,400
- Delta
- -13.00%
- Verdict
- UNDERPRICED
- Comps
- 20 within 1.0 mi
Show comp detail 12 sales within ~0.75 mi
| Address | Dist | Beds/Ba | Sqft | Sold | Price | $/sf | Match |
|---|---|---|---|---|---|---|---|
| 11014 N Crescent Ct | 0.06mi | 4/2.5 | 2,251 (0%) | 4mo | $433,000 | $192 | 94 |
| 9421 NE 111th Pl | 0.09mi | 4/2.5 | 2,251 (0%) | 3mo | $455,699 | $202 | 94 |
| 11024 N Glenwood Ave | 0.07mi | 4/2.5 | 2,251 (0%) | 6mo | $438,950 | $195 | 92 |
| 11021 N Crescent Ct | 0.11mi | 4/2.5 | 2,251 (0%) | 6mo | $477,939 | $212 | 90 |
| 11112 N Glenwood Ave | 0.04mi | 4/3.5 | 2,362 (+5%) | 4mo | $472,000 | $200 | 83 |
| 9214 NE 110th Ter | 0.15mi | 4/3.5 | 2,323 (+3%) | 5mo | $480,000 | $207 | 80 |
| 9110 NE 111th Pl | 0.18mi | 4/3.0 | 2,329 (+4%) | 6mo | $430,500 | $185 | 79 |
| 9601 NE 112th St | 0.23mi | 3/2.0 (-1) | 2,272 (+1%) | 5mo | $600,000 | $264 | 77 |
| 9418 NE 111th Ter | 0.11mi | 3/3.0 (-1) | 2,584 (+15%) | 1mo | $528,023 | $204 | 63 |
| 8804 NE 109th St | 0.61mi | 4/3.5 | 2,130 (-5%) | 3mo | $379,999 | $178 | 56 |
| 11215 N Lewis Ave | 0.66mi | 3/2.5 (-1) | 2,176 (-3%) | 5mo | $340,000 | $156 | 54 |
| 11004 N Hunter Ave | 0.44mi | 3/3.0 (-1) | 1,938 (-14%) | 5mo | $340,000 | $175 | 45 |
Match score weights: distance 35% · size 25% · config 20% · recency 20%. Top-matched comps best support the ARV.
Projected returns pro-forma
-3.0% appreciation · 8.0% rent growth · sell at horizon
- IRR
- -25.0%
- Equity multiple
- 0.12×
- Total profit
- $-113,463
- Equity at exit
- $68,453
- IRR
- -10.5%
- Equity multiple
- 0.23×
- Total profit
- $-98,434
- Equity at exit
- $39,694
Cash invested: $128,547 (down + closing). Projections, not guarantees.
Landlord ↔ Tenant lean methodology
- Overall (STATE)
- 81 Strongly Landlord-Friendly
- State Missouri
- 81 Strongly Landlord-Friendly · R+10
- County
- — inherits STATE
- City
- — inherits STATE
ZIP-level market 64157
- Home prices YoY
- -18.1%
- Rents YoY
- 9.5%
- Active inventory
- 241
- Price-to-rent
- 11.4×
Monthly cashflow live
- Estimated rent
- $2,931 medium interval (Pro) →
- Mortgage (P&I)
- −$2,408
- Tax est. 1.5%
- −$574 /mo · $6,886/yr
- Insurance
- −$191
- HOA
- −$0
- Vacancy / Maint / Mgmt
- −$615
- Net cashflow
- $-857
Break-even live
Sensitivity live
| Price | -10% $-540 | -5% $-699 | +0% $-857 | +5% $-1,016 | +10% $-1,175 |
|---|---|---|---|---|---|
| Rent | -10% $-1,089 | -5% $-973 | +0% $-857 | +5% $-742 | +10% $-626 |
| Rate | -1.0pp $-626 | -0.5pp $-741 | base $-857 | +0.5pp $-976 | +1.0pp $-1,097 |
UW: 25.0% down · 7.5% · 30yr · 1.5% tax · 5.0% vac · 8.0% maint · 8.0% mgmt
Financing live
Cash to close
- Down payment
- $114,774
- Closing costs
- $13,773
- Reserves months
- —
- Total cash needed
- —
Loan-product check · same deal, 3 products live
Conventional
25% down · 7.5% · 30yr
- Down + closing
- —
- Monthly P&I
- —
- Monthly cashflow
- —
- DSCR
- —
- Eligible?
- —
Personal DTI + credit; lowest rate.
DSCR
20% down · 8.5% · 30yr
- Down + closing
- —
- Monthly P&I
- —
- Monthly cashflow
- —
- DSCR
- —
- Eligible?
- —
No personal income docs; deal must DSCR.
Hard money
10% down · 12.0% · 12mo
- Down + closing
- —
- Monthly P&I
- —
- Monthly cashflow
- —
- DSCR
- —
- Eligible?
- —
Short-term bridge; refi at stabilization.
Rent comps 1 comps
| Address | Beds | Baths | Sqft | Rent | $/sqft | DOM | Units | Dist |
|---|---|---|---|---|---|---|---|---|
| 8952 NE 116th Pl Kansas City, MO | 3.0 | 2.5 | 2071 | $2,541 | $1.23 | 45d | 1 | 0.82mi |
Listing history 15 events
-
2026-06-21days on market $399,400 Active 199 DOM
-
2026-06-18days on market $399,400 Active 196 DOM
-
2026-06-17days on market $399,400 Active 195 DOM
-
2026-06-16days on market $399,400 Active 194 DOM
-
2026-06-15days on market $399,400 Active 193 DOM
-
2026-06-13days on market $399,400 Active 191 DOM
-
2026-06-09days on market $399,400 Active 187 DOM
-
2026-06-08days on market $399,400 Active 186 DOM
-
2026-06-07days on market $399,400 Active 185 DOM
-
2026-06-03days on market $399,400 Active 181 DOM
-
2026-06-02days on market $399,400 Active 180 DOM
-
2026-06-01days on market $399,400 Active 179 DOM
-
2026-05-31days on market $399,400 Active 178 DOM
-
2026-01-02price $399,400 842-char remark
Show marketing remark (842 chars)
Our Basswood home plan features a modern, open layout designed for comfortable living. The main level highlights a spacious kitchen with a large island that overlooks both the dining and great rooms, making it perfect for entertainment and family gatherings. Additionally, a sizable home office on this level provides a dedicated space for work or study. Upstairs, the primary bedroom is a luxurious retreat with a spa-like bathroom, complete with an oversized countertop, dual sinks, and a walk-in shower. The second floor also includes a large full bath for shared use and a conveniently located laundry room adjacent to the 3 bedrooms. Looking for additional space? Consider finishing the lower level! You can finish this area to include a large rec room, a 5th bedroom and full bathroom, providing additional living space and flexibility.
-
2025-12-04$414,100 Active 842-char remark
Show marketing remark (842 chars)
Our Basswood home plan features a modern, open layout designed for comfortable living. The main level highlights a spacious kitchen with a large island that overlooks both the dining and great rooms, making it perfect for entertainment and family gatherings. Additionally, a sizable home office on this level provides a dedicated space for work or study. Upstairs, the primary bedroom is a luxurious retreat with a spa-like bathroom, complete with an oversized countertop, dual sinks, and a walk-in shower. The second floor also includes a large full bath for shared use and a conveniently located laundry room adjacent to the 3 bedrooms. Looking for additional space? Consider finishing the lower level! You can finish this area to include a large rec room, a 5th bedroom and full bathroom, providing additional living space and flexibility.
ⓘ Source: listings_history table (triggers on properties + properties_extension) + one-shot
backfill from property_details.listing_events for pre-trigger history.
Climate risk First Street
- Flood 1/10 Low FEMA zone X (unshaded) · 0% chance over 30 yrs
- Wildfire 4/10 Moderate
- Heat 4/10 Moderate 7 d/yr ≥105°F today · 16 d/yr by 30 yrs out
- Wind 2/10 Low
- Air quality 3/10 Moderate 3 unhealthy d/yr today · 4 by 30 yrs out
Nearby sold comps map
Loading sold comps map…
Walkable amenities ~0.75 mi
Loading nearby amenities…
Taxation est. · year 1
- Rental income
- $35,171
- − Mortgage interest
- −$25,717
- − Property taxes
- −$6,886
- − Insurance
- −$2,295
- − Repairs & maintenance
- −$2,814
- − Management
- −$2,814
- − Depreciation
- −$13,356
- Taxable loss
- −$18,711
- Est. tax savings @ 24.0%
- +$4,491
- After-tax cash flow
- $-5,797/yr
For passive investors: Depreciation is non-cash, so a rental often shows a tax loss while cash-flowing — sheltering income. Rental losses are passive: they offset passive income freely, and up to $25,000/yr can offset ordinary (W-2) income if you actively participate and your MAGI is under $100k (phasing out to $0 by $150k); unused losses carry forward. On sale, claimed depreciation is recaptured at up to 25%, and gains may owe capital-gains tax (a 1031 exchange can defer both). Figures are a year-1 estimate at your 24.0% rate — not tax advice; consult a CPA.
Schools (NCES district)
- District
- Liberty 53
- NCES district ID
- 2918540
- Math proficiency
- 41% ▼ -9.00%
- Reading proficiency
- 59% ▼ -3.00%
- Median HH income
- $78,226
- Composite
- 45.41/100
- National rank
- #2624
- State rank
- #24 of 324 in MO
Livability — Kansas City
- Score
- 78/100
- State rank
- #28
- US rank
- #2671
Category grades
Schools grade is shown separately in the Schools card above.
Census & demographics
- Census place
- Kansas City, MO
- County
- Clay County · 220,651 people
- City population
- 439,467
- Metro
- Kansas City, MO-KS
- Population (ZIP)
- 23,030
- Household income
- $149,526
- Rent vs Own
- Severe rent burden
- 87.0
Population outlook (Clay County) Hauer SSP2
- Today (2025)
- 266,022 people
- By 2030
- 280,057 · +5.3%
- By 2040
- 306,153 · +15.1%
- By 2050
- 328,630 · +23.5%
- By 2075
- 375,182 · +41.0%
- By 2100
- 392,861 · +47.7%
Race, ethnicity, and origin ACS 2023
- Neighborhood character
- Predominantly White (82%)
- Race & ethnicity
- White 82% Asian 7% Two or more races 6% Hispanic / Latino 5% Black 3%
- Common ancestry
- Slovak 3% Italian 2% Lithuanian 2%
- Foreign-born
- 6% · Canada, Vietnam, China
- Languages at home
- 92% English-only · Spanish 3% Other Asian/Pacific 2% Vietnamese 1%
Political lean MEDSL · Clay
- 2024 margin
- Lean R (+5.6) · D 46.4% · R 52.0% · Other 1.6%
- 2008→2024 swing
- -4.9pp toward R · 2008: -0.7pp · 2024: -5.6pp
- All cycles
- 2024: R+5.6 2020: R+4.1 2016: R+11.1 2012: R+8.4 2008: R+0.7
Not yet ingested
- Civics
- —
Market trends
- HPI YoY
- ▼ -43.38%
- Current HPI
- 195.9921
- Rent YoY
- ▲ 9.50%
- Metro
- Kansas City, MO-KS
- State GDP YoY
- ▲ 1.84%
- F500 in state
- 20
Industry mix (Fortune 500 HQ in MO)
| Industry | F500 HQs | Revenue |
|---|---|---|
| Healthcare | 1 | $163B |
|
||
| Insurance | 1 | $21B |
|
||
| Industrial Technology | 1 | $17B |
|
||
| Retail | 1 | $16B |
|
||
| Industrial Distribution | 1 | $10B |
|
||
| Utilities | 1 | $9B |
|
||
Price history
-3.5% since first listed2 events — show timeline
- 2026-01-02 Price Changed $399,400 Zillow
- 2025-12-04 Listed $414,100 Zillow
Cash-flow waterfall
monthlySold comps — $/sqft
last 12 mo · ≤1 miLoading sold comps…