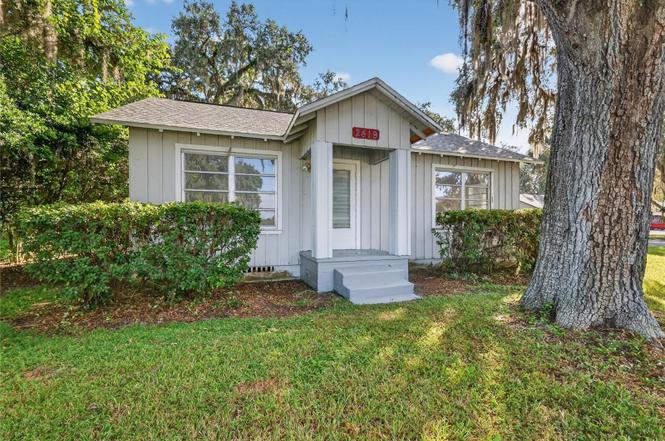
2419 W Main St · Leesburg, FL
Flood risk 1/10 · Minimal
- FEMA flood zone
- X (unshaded)
- Chance of flooding over 30 yrs
- 0.0%
- Est. flood insurance / yr
- $507 – $1,088
Fire risk 3/10 · Minor
- Est. fire insurance / yr
- $947 – $1,759
Heat risk 8/10 · Major
- Hot days now (above 108°F)
- 7 days/yr
- Hot days in 30 yrs
- 22 days/yr
Wind risk 9/10 · Severe
- Chance of severe wind over 30 yrs
- 99.0%
Air-quality risk 2/10 · Minimal
- Unhealthy air days now
- 1 days/yr
- Unhealthy air days in 30 yrs
- 1 days/yr
Risk factors via First Street. Map © Google.
Why this score? — see what drove the D- grade
The composite is a weighted blend of 9 inputs, each scored 0–100. Each bar is that input's sub-score; the figure is the points it added to the 100-point composite (weight × sub-score).
- Cash flow +15.3/30.0
- DSCR +4.7/10.0
- Schools +4.2/10.0
- 1% rule +3.3/10.0
- Livability +3.1/5.0
- Condition / age +2.5/5.0
- Rent growth +2.3/5.0
- ARV discount +0.0/15.0
- Appreciation +0.0/10.0
$199,900
🖨 Deal sheet (PDF) 📄 Offer letter ✓ Due diligence
Listing remarks
Come take a look at this flexible opportunity to own either a single family home with a mother in law quarters / attached rental, duplex, or even a professional office with a rental apartment in the rear! This home was built initially as a single family home, but has been partitioned to be a 2/1 up front and a studio apartment in the rear. Its location as a corner lot directly on Main Street, just moments away from the New WAWA, adjacent to a professional plaza, moments to Brownwood and Downtown Leesburg, position it perfectly for an income property as professional space or multi-family. The home boasts a brand new roof (2025) and new water heater. The lot is 1/4 acre with detached storag
Key facts
- Attached rental
- Detached storage
- New water heater
Tags
Property features AI
Finance
- Other: Zoned C-1; Lot around 0.25 acre (1/4 to less than 1/2 acre); Asphalt road access; Located at 2419 W Main St, Leesburg, FL
Exterior
- Parking: Carport (2 spaces)
- Utilities: Public water; Public sewer; Cable available; Electricity connected; Water connected; Sewer connected
- Home design: Single family residence; Residential property; One level; Faces north
- Construction: Frame construction with wood siding; Shingle roof; Crawlspace and slab foundation; Built area approximately 1,550 sq ft
- Exterior features: Outdoor lighting; Storage
Interior
- Kitchen: Range; Refrigerator
- Bedrooms: 3 bedrooms
- Flooring: Wood flooring
- Bathrooms: 2 full bathrooms
- Heating & cooling: Central heating (electric); Central air conditioning
- Interior features: Ceiling fans
- Laundry & utility: Laundry in common area; Outside laundry
Neighborhood map
What this means for you Summary
Snapshot
- This is a 3-bed/1.0-bath single-family listed at $200k.
Deal economics
- At list price, monthly cash flow is $73 ($873/yr) — positive.
- The deal already cash-flows at list — no discount required.
- To meet the 1% rule (rent ≥ 1% of price), the offer needs to be $166k (17.0% below list).
- Recommended offer: $166k (17.0% below list) — sets the bar for 1% rule.
- Cap rate 6.7% vs local median 4.4% in Leesburg — top-decile yield for the area; either an underpriced asset or a hidden risk that comps aren't pricing in. Stress-test before assuming the spread holds.
Location & tenants
- Location reads 62/100 on livability (#751 in FL) — a middle-class / working-renter tenant base. Strengths: cost of living A+, housing A+; Watch: crime D, amenities F, commute F.
- Lake (suburban): math 49% / reading 50% proficiency, ranked #37 of 73 in FL (top 51%) — families likely to look elsewhere, expect single-tenant / working-renter base with shorter leases.
- Zoned schools: Leesburg Elementary School (math 31% / reading 32%, grade F, #1,841 of 2,144 statewide, top 86%, 822 students, 71% FRL); Oak Park Middle School (math 32% / reading 36%, grade F, #426 of 571 statewide, top 75%, 575 students, 70% FRL); Leesburg High School (math 24% / reading 32%, grade F, #464 of 667 statewide, top 70%, 1,641 students, 58% FRL) — zoned schools average 66% FRL vs 49% district-wide (17 pts higher); higher-poverty schools than district average — tighter screening recommended.
- Zoned-school proficiency averages 31% at this address vs 50% district-wide (-18 pts) — the specific schools serving this property underperform the Lake average; the district grade overstates school quality for this exact location.
- Market conditions: Rents soft (-0.9%/yr); 798 active listings in the ZIP; 18 comparable units currently listed for rent nearby; rentals at typical pace (median 20d on market — plan ~3-4 weeks tenant-placement turnaround); 4,799 units permitted in Lake County in 2024 (814 in 5+ unit buildings).
Forward outlook
- Local home prices are declining (-3.0%/yr); year-one equity from $1k of loan paydown is wiped out by about $6k of value loss. Plan a longer hold.
- Lake County population projected at +37% by 2050 — long-run rental-demand tailwind backs the buy-and-hold thesis.
Negotiation context
- It's been on market 221 days — a 12% lower offer ($176k) is reasonable based on typical stale-listing flexibility.
- 2 sale attempts; this cycle's ask has dropped $30k (13%) from the opening price — seller is motivated, your offer sets the floor, not the list.
- Current owner paid $24k; list at $200k implies a 751% gain — meaningful room to come down on a strong offer.
Risks & watch-outs
- Watch-outs: built in 1946 — expect roof / HVAC / electrical / plumbing capex.
- Climate carrying-cost: severe wind risk, 99% chance of damaging wind over 30y; extreme-heat days projected 7→22/yr by 2055 (HVAC capex compounding) — expect insurance premiums to compound above CPI over the hold.
Questions for the listing agent
- It's been on market 221 days. Have you received any prior offers? Is the seller open to a 17% concession, seller financing, or rate buy-down credit?
- Built in 1946 — when were the roof, HVAC, electrical panel, plumbing, and water heater last replaced?
- Why hasn't it sold? Are there any deal-killer items the seller is aware of (foundation, flood, title, zoning, code violations)?
- Is there a deadline driving the sale (1031 exchange, divorce, estate, relocation)? That informs how much negotiation room exists.
- Schools are D-rated, which usually means shorter tenancies and higher turnover. Who's the typical renter profile here, and what's been the actual vacancy rate?
- Crime grade is D in this area — have there been break-ins, vandalism, or insurance claims at this property in the last 3 years? What carrier currently insures it and at what premium?
- The area grade is low — what's the realistic commute time and amenity access for the typical tenant pool here? Any planned neighborhood developments (good or bad) we should know about?
- What's the average days-on-market for RENTAL listings here right now (not sales)? A rising rental-DOM trend means longer vacancies and softer asking-rent achievability than the comps imply.
- What's the recent tenant-quality profile in this submarket — average credit score on applications, eviction rate, late-payment / NSF rate, and stable-employment percentage? A property-management company in the area should have these aggregated.
- How much new for-sale + rental construction is in the pipeline within 1–3 miles? Heavy new supply typically softens prices + rents 12–24 months out; constrained supply supports both.
Investment metrics
- 1% rule
- 0.83% ✗
- Cap rate
- 6.73%
- Cash-on-cash
- 1.56%
- DSCR
- 1.07
- GRM
- 10.0
CMA / ARV
- ARV (on-the-fly)
- $159,650
- Comps found
- 3
Show comp detail 3 sales within ~0.75 mi
| Address | Dist | Beds/Ba | Sqft | Sold | Price | $/sf | Match |
|---|---|---|---|---|---|---|---|
| 707 Coachman Dr | 0.46mi | 2/2.0 (-1) | 1,510 (-3%) | 17mo | $155,500 | $103 | 52 |
| 2364 Conestoga Dr | 0.43mi | 2/2.0 (-1) | 1,534 (-1%) | 21mo | $144,132 | $94 | 51 |
| 201 S Lone Oak Dr | 0.35mi | 3/2.0 | 1,715 (+11%) | 13mo | $281,300 | $164 | 51 |
Match score weights: distance 35% · size 25% · config 20% · recency 20%. Top-matched comps best support the ARV.
Projected returns pro-forma
-3.0% appreciation · 0.0% rent growth · sell at horizon
- IRR
- -16.9%
- Equity multiple
- 0.42×
- Total profit
- $-32,687
- Equity at exit
- $29,806
- IRR
- -14.8%
- Equity multiple
- 0.26×
- Total profit
- $-41,551
- Equity at exit
- $17,284
Cash invested: $55,972 (down + closing). Projections, not guarantees.
Landlord ↔ Tenant lean methodology
- Overall (STATE)
- 87 Strongly Landlord-Friendly
- State Florida
- 87 Strongly Landlord-Friendly · R+3
- County
- — inherits STATE
- City
- — inherits STATE
ZIP-level market 34748
- Home prices YoY
- -25.3%
- Rents YoY
- -0.9%
- Active inventory
- 798
- Price-to-rent
- 10.0×
Monthly cashflow live
- Estimated rent
- $1,659 high interval (Pro) →
- Mortgage (P&I)
- −$1,048
- Tax from tax record
- −$107 /mo · $1,280/yr
- Insurance
- −$83
- HOA
- −$0
- Vacancy / Maint / Mgmt
- −$348
- Net cashflow
- $73
Break-even live
Sensitivity live
| Price | -10% $186 | -5% $129 | +0% $73 | +5% $16 | +10% $-40 |
|---|---|---|---|---|---|
| Rent | -10% $-58 | -5% $7 | +0% $73 | +5% $138 | +10% $204 |
| Rate | -1.0pp $173 | -0.5pp $124 | base $73 | +0.5pp $21 | +1.0pp $-32 |
UW: 25.0% down · 7.5% · 30yr · 1.5% tax · 5.0% vac · 8.0% maint · 8.0% mgmt
Financing live
Cash to close
- Down payment
- $49,975
- Closing costs
- $5,997
- Reserves months
- —
- Total cash needed
- —
Loan-product check · same deal, 3 products live
Conventional
25% down · 7.5% · 30yr
- Down + closing
- —
- Monthly P&I
- —
- Monthly cashflow
- —
- DSCR
- —
- Eligible?
- —
Personal DTI + credit; lowest rate.
DSCR
20% down · 8.5% · 30yr
- Down + closing
- —
- Monthly P&I
- —
- Monthly cashflow
- —
- DSCR
- —
- Eligible?
- —
No personal income docs; deal must DSCR.
Hard money
10% down · 12.0% · 12mo
- Down + closing
- —
- Monthly P&I
- —
- Monthly cashflow
- —
- DSCR
- —
- Eligible?
- —
Short-term bridge; refi at stabilization.
Rent comps 18 comps
| Address | Beds | Baths | Sqft | Rent | $/sqft | DOM | Units | Dist |
|---|---|---|---|---|---|---|---|---|
| 502 Old Colony Rd Leesburg, FL | 3.0 | 2.0 | 1456 | $1,299 | $0.89 | 25d | 1 | 0.30mi |
| 513 Old Colony Rd Leesburg, FL | 3.0 | 2.0 | 1198 | $1,699 | $1.42 | 6d | 1 | 0.35mi |
| 1004 Royal Oak Blvd Unit 1004 Leesburg, FL | 2.0 | 2.5 | 1244 | $1,550 | $1.25 | 6d | 1 | 0.96mi |
| 1009 McCormack St Leesburg, FL | 2.0 | 1.0 | 1400 | $1,025 | $0.73 | 25d | 1 | 0.96mi |
| 2920 Pecan Ave Leesburg, FL | 2.0 | 2.5 | 1288 | $1,700 | $1.32 | 25d | 1 | 1.00mi |
| 3019 Walnut Ct Leesburg, FL | 3.0 | 2.0 | 1854 | $1,799 | $0.97 | 4d | 1 | 1.01mi |
| 3019 Walnut Ct Leesburg, FL | 3.0 | 2.0 | 1854 | $1,799 | $0.97 | 0d | 1 | 1.01mi |
| 2940 Peach St Leesburg, FL | 2.0 | 2.5 | 1288 | $1,750 | $1.36 | 19d | 1 | 1.02mi |
| 3029 Walnut Ct Leesburg, FL | 3.0 | 2.0 | 1854 | $1,799 | $0.97 | 6d | 1 | 1.03mi |
| 3029 Walnut Ct Leesburg, FL | 3.0 | 2.0 | 1854 | $1,799 | $0.97 | 5d | 1 | 1.03mi |
| 1125 Apple Ter Unit 1125 Leesburg, FL | 3.0 | 2.0 | 1450 | $1,695 | $1.17 | 0d | 1 | 1.04mi |
| 1020 Birchwood Ct Unit 2 Leesburg, FL | 2.0 | 1.0 | 1230 | $1,250 | $1.02 | 19d | 1 | 1.15mi |
| 1604 Woodlyn Dr Leesburg, FL | 3.0 | 1.5 | 1088 | $1,500 | $1.38 | 25d | 1 | 1.18mi |
| 1317 Cambridge Dr Leesburg, FL | 3.0 | 1.5 | 1240 | $1,600 | $1.29 | 25d | 1 | 1.29mi |
| 1220 W Dixie Ave Leesburg, FL | 3.0 | 2.0 | 1304 | $1,600 | $1.23 | 6d | 1 | 1.31mi |
| 200 S 11th St Unit 102 Leesburg, FL | 2.0 | 2.5 | 1379 | $1,675 | $1.21 | 25d | 1 | 1.39mi |
| 200 S 11th St Leesburg, FL | 2.0 | 2.0 | 1379 | $1,675 | $1.21 | 25d | 1 | 1.40mi |
| 716 Marietta St Leesburg, FL | 3.0 | 2.0 | 1250 | $1,600 | $1.28 | 25d | 1 | 1.49mi |
Listing history 14 events
-
2026-06-07statusdays on market $199,900 Pending 221 DOM
-
2026-06-04days on market $199,900 Active 220 DOM
-
2026-06-03days on market $199,900 Active 219 DOM
-
2026-06-02days on market $199,900 Active 218 DOM
-
2026-06-02days on market $199,900 Active 217 DOM
-
2026-05-31days on market $199,900 Active 216 DOM
-
2026-04-15status Active
-
2026-04-09status Pending
-
2026-03-27price $199,900
-
2026-02-03price $209,900
-
2025-12-26price $219,900
-
2025-11-21price $224,900
-
2025-10-21$229,900 Active
-
1974-01-01soldstatus $23,500
ⓘ Source: listings_history table (triggers on properties + properties_extension) + one-shot
backfill from property_details.listing_events for pre-trigger history.
Tax reassessment forecast FL · Resets to sale price
- Current annual tax
- $1,280 · $107/mo
- Projected year-2 tax
- $1,659 · $138/mo
- Expected delta
- +$379/yr (+$32/mo · 29.6%)
ⓘ Screening estimate from a state-policy table — verify with the county assessor before closing.
Climate risk First Street
- Flood 1/10 Low FEMA zone X (unshaded) · 0% chance over 30 yrs
- Wildfire 3/10 Moderate
- Heat 8/10 Severe 7 d/yr ≥108°F today · 22 d/yr by 30 yrs out
- Wind 9/10 Extreme 99% chance of damaging wind over 30 yrs
- Air quality 2/10 Low 1 unhealthy d/yr today · 1 by 30 yrs out
Nearby sold comps map
Loading sold comps map…
Walkable amenities ~0.75 mi
Loading nearby amenities…
Taxation est. · year 1
- Rental income
- $19,914
- − Mortgage interest
- −$11,198
- − Property taxes
- −$1,280
- − Insurance
- −$1,000
- − Repairs & maintenance
- −$1,593
- − Management
- −$1,593
- − Depreciation
- −$5,815
- Taxable loss
- −$2,565
- Est. tax savings @ 24.0%
- +$616
- After-tax cash flow
- $1,488/yr
For passive investors: Depreciation is non-cash, so a rental often shows a tax loss while cash-flowing — sheltering income. Rental losses are passive: they offset passive income freely, and up to $25,000/yr can offset ordinary (W-2) income if you actively participate and your MAGI is under $100k (phasing out to $0 by $150k); unused losses carry forward. On sale, claimed depreciation is recaptured at up to 25%, and gains may owe capital-gains tax (a 1031 exchange can defer both). Figures are a year-1 estimate at your 24.0% rate — not tax advice; consult a CPA.
Schools (NCES district)
- District
- Lake
- NCES district ID
- 1201050
- Math proficiency
- 49% ▼ -7.00%
- Reading proficiency
- 50% ▼ -4.00%
- Median HH income
- $46,632
- Composite
- 42.05/100
- National rank
- #3327
- State rank
- #37 of 73 in FL
Livability — Leesburg
- Score
- 62/100
- State rank
- #751
- US rank
- #16429
Category grades
Schools grade is shown separately in the Schools card above.
Census & demographics
- Census place
- Leesburg, FL
- County
- Lake County · 364,602 people
- City population
- 70,232
- Metro
- Orlando-Kissimmee-Sanford, FL
- Population (ZIP)
- 48,095
- Household income
- $58,192
- Rent vs Own
- Severe rent burden
- 1745.0
Population outlook (Lake County) Hauer SSP2
- Today (2025)
- 386,640 people
- By 2030
- 417,107 · +7.9%
- By 2040
- 476,676 · +23.3%
- By 2050
- 531,296 · +37.4%
- By 2075
- 648,303 · +67.7%
- By 2100
- 698,530 · +80.7%
Race, ethnicity, and origin ACS 2023
- Neighborhood character
- Majority White (64%)
- Race & ethnicity
- White 64% Black 16% Hispanic / Latino 15% Two or more races 9% Asian 1%
- Hispanic origin (detail)
- Mexican 4% Puerto Rican 5% Cuban 3%
- Common ancestry
- Romanian 3% Lithuanian 3% Slovak 2%
- Foreign-born
- 9% · Canada, Vietnam, Jamaica
- Languages at home
- 88% English-only · Spanish 10% French/Haitian/Cajun 1%
Political lean MEDSL · Lake
- 2024 margin
- Strong R (+24.7) · D 37.3% · R 62.0%
- 2008→2024 swing
- -11.2pp toward R · 2008: -13.5pp · 2024: -24.7pp
- All cycles
- 2024: R+24.7 2020: R+20.0 2016: R+23.1 2012: R+17.1 2008: R+13.5
Not yet ingested
- Civics
- —
Market trends
- HPI YoY
- ▼ -88.97%
- Current HPI
- 262.1766
- Rent YoY
- ▼ -0.95%
- Metro
- Orlando-Kissimmee-Sanford, FL
- State GDP YoY
- ▲ 3.28%
- F500 in state
- 36
Industry mix (Fortune 500 HQ in FL)
| Industry | F500 HQs | Revenue |
|---|---|---|
| Industrial Technology | 2 | $29B |
|
||
| Insurance | 2 | $17B |
|
||
| Retail | 1 | $60B |
|
||
| Technology Distribution | 1 | $58B |
|
||
| Homebuilding | 1 | $35B |
|
||
| Technology Manufacturing | 1 | $35B |
|
||
Price history
+750.6% since first listed8 events — show timeline
- 2026-04-15 Relisted — Stellar MLS as Distributed by MLS Grid
- 2026-04-09 Pending — Stellar MLS as Distributed by MLS Grid
- 2026-03-27 Price Changed $199,900 Stellar MLS as Distributed by MLS Grid
- 2026-02-03 Price Changed $209,900 Stellar MLS as Distributed by MLS Grid
- 2025-12-26 Price Changed $219,900 Stellar MLS as Distributed by MLS Grid
- 2025-11-21 Price Changed $224,900 Stellar MLS as Distributed by MLS Grid
- 2025-10-21 Listed $229,900 Stellar MLS as Distributed by MLS Grid
- 1974-01-01 Sold (Public Records) $23,500 Public Records
Property tax history
+6.6%/yrLatest (2025): $1,280 · +2.3% YoY. Source: county tax records.
Cash-flow waterfall
monthlySold comps — $/sqft
last 12 mo · ≤1 miLoading sold comps…