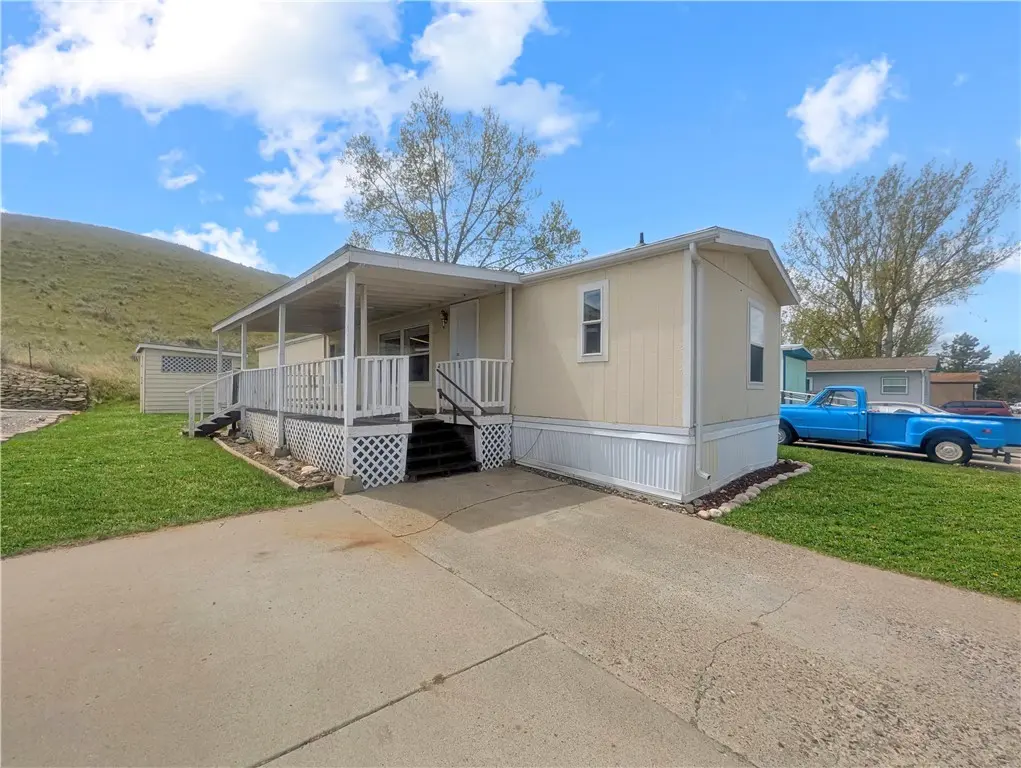
2224 Highway 87 E #206 · Lockwood, MT
Flood risk 1/10 · Minimal
- FEMA flood zone
- D
- Chance of flooding over 30 yrs
- 0.0%
- Est. flood insurance / yr
- $544 – $1,084
Fire risk 7/10 · Major
- Est. fire insurance / yr
- $918 – $1,706
Heat risk 3/10 · Minor
- Hot days now (above 94°F)
- 7 days/yr
- Hot days in 30 yrs
- 15 days/yr
Wind risk 1/10 · Minimal
- Chance of severe wind over 30 yrs
- —
Air-quality risk 4/10 · Minor
- Unhealthy air days now
- 5 days/yr
- Unhealthy air days in 30 yrs
- 6 days/yr
Risk factors via First Street. Map © Google.
Why this score? — see what drove the D+ grade
The composite is a weighted blend of 9 inputs, each scored 0–100. Each bar is that input's sub-score; the figure is the points it added to the 100-point composite (weight × sub-score).
- Cash flow +16.3/30.0
- 1% rule +10.0/10.0
- DSCR +5.0/10.0
- ARV discount +4.1/15.0
- Rent growth +3.5/5.0
- Livability +3.0/5.0
- Schools +2.4/10.0
- Condition / age +2.2/5.0
- Appreciation +0.0/10.0
$59,000
🖨 Deal sheet (PDF) 📄 Offer letter ✓ Due diligence
Key facts
- No rear neighbors
- Great location
- Covered front deck
Tags
Property features AI
Finance
- Other: Residential property in the Hillside subdivision
- HOA & community: Homeowners association with monthly fee of $850
Exterior
- Parking: Off-street parking; no garage
- Utilities: Natural gas available; Standard water and sewer (details not provided)
- Home design: Manufactured home (single-family residence); 1,120 above-grade finished area; Located on an interior lot; Subdivision: Hillside; Zoned Rural Residential Manufactured Home
- Construction: Masonite exterior; Asphalt shingle roof; No basement
- Exterior features: Front porch; Deck; Landscaped lot; Shed on the property
Interior
- Kitchen: Equipped with dishwasher, oven, range, and refrigerator
- Bedrooms: 2 bedrooms on the main level
- Bathrooms: 2 full bathrooms (both on the main level)
- Heating & cooling: Natural gas forced-air heating; No central cooling
- Interior features: Dishwasher; Oven; Range; Refrigerator
Neighborhood map
What this means for you Summary
Snapshot
- This is a 2-bed/2.0-bath manufactured listed at $59k. Condition is rated fair.
Deal economics
- At list price, monthly cash flow is $32 ($384/yr) — positive.
- The deal already cash-flows at list — no discount required.
- Meets the 1% rule at list price ($1k rent vs $59k).
- Recommended offer: $58k (1.5% below list) — sets the bar for market timing.
- Cap rate 6.9% vs local median 1.8% in Lockwood — top-decile yield for the area; either an underpriced asset or a hidden risk that comps aren't pricing in. Stress-test before assuming the spread holds.
Location & tenants
- Location reads 59/100 on livability (#238 in MT) — a working-class tenant base; expect higher turnover. Strengths: cost of living A+, housing A+; Watch: health & safety C-, amenities F, commute F.
- Lockwood K-12 (suburban): math 21% / reading 33% proficiency, ranked #86 of 116 in MT (top 74%) — low school quality limits family demand, transient renter base, plan for 1-2y turnover.
- Zoned schools: Lockwood Primary (374 students, 0% FRL); Lockwood Middle School (math 19% / reading 35%, grade F, #115 of 146 statewide, top 79%, 433 students, 0% FRL); Lockwood High School (546 students, 0% FRL) — zoned schools average 0% FRL vs 35% district-wide (35 pts lower); this property's tenant base skews higher-income than the district average.
- Market conditions: Rents rising (+4.0%/yr); 279 active listings in the ZIP; 1 comparable units currently listed for rent nearby; 1,401 units permitted in Yellowstone County in 2024 (281 in 5+ unit buildings).
Forward outlook
- Local home prices are declining (-3.0%/yr); year-one equity from $408 of loan paydown is wiped out by about $2k of value loss. Plan a longer hold.
- Yellowstone County population projected at +26% by 2050 — long-run rental-demand tailwind backs the buy-and-hold thesis.
Negotiation context
- It's been on market 19 days — a 2% lower offer ($58k) is reasonable based on typical stale-listing flexibility.
Risks & watch-outs
- Watch-outs: HOA is 48% of rent.
- Climate carrying-cost: major wildfire risk — expect insurance premiums to compound above CPI over the hold.
Questions for the listing agent
- Have any recent inspections been done? Can we get a copy of the seller's disclosures and any deferred-maintenance estimates?
- What does the HOA fee cover, when was the last increase, and are there any pending special assessments or reserve-fund shortfalls?
- Is there a deadline driving the sale (1031 exchange, divorce, estate, relocation)? That informs how much negotiation room exists.
- Schools are F-rated, which usually means shorter tenancies and higher turnover. Who's the typical renter profile here, and what's been the actual vacancy rate?
- The area grade is low — what's the realistic commute time and amenity access for the typical tenant pool here? Any planned neighborhood developments (good or bad) we should know about?
- What's the average days-on-market for RENTAL listings here right now (not sales)? A rising rental-DOM trend means longer vacancies and softer asking-rent achievability than the comps imply.
- What's the recent tenant-quality profile in this submarket — average credit score on applications, eviction rate, late-payment / NSF rate, and stable-employment percentage? A property-management company in the area should have these aggregated.
- How much new for-sale + rental construction is in the pipeline within 1–3 miles? Heavy new supply typically softens prices + rents 12–24 months out; constrained supply supports both.
Investment metrics
- 1% rule
- 2.43% ✓
- Cap rate
- 6.94%
- Cash-on-cash
- 2.32%
- DSCR
- 1.10
- GRM
- 3.4
CMA / ARV
- ARV (on-the-fly)
- $54,880
- Comps found
- 12
Show comp detail 12 sales within ~0.75 mi
| Address | Dist | Beds/Ba | Sqft | Sold | Price | $/sf | Match |
|---|---|---|---|---|---|---|---|
| 2224 Us Highway 87 E Trlr 158 | 0.13mi | 3/2.0 (+1) | 1,216 (+9%) | 0mo | $69,900 | $57 | 75 |
| 2224 Highway 87 E #220 #220 | 0.12mi | 3/2.0 (+1) | 1,065 (-5%) | 9mo | $59,000 | $55 | 74 |
| 2224 US Highway 87 E Trlr 91 | 0.12mi | 3/2.0 (+1) | 1,216 (+9%) | 2mo | $50,150 | $41 | 73 |
| 2224 Highway 87 E #28 #28 | 0.12mi | 3/2.0 (+1) | 1,216 (+9%) | 3mo | $49,000 | $40 | 73 |
| 2224 U.s. Highway 87 East #65 | 0.13mi | 3/2.0 (+1) | 1,216 (+9%) | 3mo | $85,000 | $70 | 72 |
| 2224 Highway 87 E #193 | 0.18mi | 3/2.0 (+1) | 1,216 (+9%) | 2mo | $59,000 | $49 | 70 |
| 2224 Highway 87 E #230 #230 | 0.12mi | 3/2.0 (+1) | 1,216 (+9%) | 9mo | $59,000 | $49 | 68 |
| 2224 US Hwy 87 E #90 | 0.12mi | 3/2.0 (+1) | 1,216 (+9%) | 9mo | $102,000 | $84 | 68 |
| 2224 Highway 87 E #129 | 0.12mi | 3/2.0 (+1) | 1,216 (+9%) | 10mo | $59,000 | $49 | 67 |
| 2224 US Highway 87 E #57 | 0.13mi | 3/1.0 (+1) | 1,216 (+9%) | 8mo | $45,000 | $37 | 64 |
| 2224 US Highway 87 E #181 | 0.13mi | 3/2.0 (+1) | 1,274 (+14%) | 10mo | $87,500 | $69 | 58 |
| 1803 Highway 87 E #4 | 0.72mi | 3/1.0 (+1) | 952 (-15%) | 4mo | $39,999 | $42 | 29 |
Match score weights: distance 35% · size 25% · config 20% · recency 20%. Top-matched comps best support the ARV.
Projected returns pro-forma
-3.0% appreciation · 3.96% rent growth · sell at horizon
- IRR
- -9.1%
- Equity multiple
- 0.66×
- Total profit
- $-5,674
- Equity at exit
- $8,797
- IRR
- 3.9%
- Equity multiple
- 1.32×
- Total profit
- $5,366
- Equity at exit
- $5,101
Cash invested: $16,520 (down + closing). Projections, not guarantees.
Landlord ↔ Tenant lean methodology
- Overall (STATE)
- 82 Strongly Landlord-Friendly
- State Montana
- 82 Strongly Landlord-Friendly · R+11
- County
- — inherits STATE
- City
- — inherits STATE
ZIP-level market 59101
- Rents YoY
- 4.0%
- Active inventory
- 279
- Price-to-rent
- 3.4×
Monthly cashflow live
- Estimated rent
- $1,436 medium interval (Pro) →
- Mortgage (P&I)
- −$309
- Tax est. 1.5%
- −$74 /mo · $885/yr
- Insurance
- −$25
- HOA
- −$695
- Vacancy / Maint / Mgmt
- −$302
- Net cashflow
- $32
Break-even live
Sensitivity live
| Price | -10% $73 | -5% $52 | +0% $32 | +5% $12 | +10% $-9 |
|---|---|---|---|---|---|
| Rent | -10% $-81 | -5% $-25 | +0% $32 | +5% $89 | +10% $145 |
| Rate | -1.0pp $62 | -0.5pp $47 | base $32 | +0.5pp $17 | +1.0pp $1 |
UW: 25.0% down · 7.5% · 30yr · 1.5% tax · 5.0% vac · 8.0% maint · 8.0% mgmt
Financing live
Cash to close
- Down payment
- $14,750
- Closing costs
- $1,770
- Reserves months
- —
- Total cash needed
- —
Loan-product check · same deal, 3 products live
Conventional
25% down · 7.5% · 30yr
- Down + closing
- —
- Monthly P&I
- —
- Monthly cashflow
- —
- DSCR
- —
- Eligible?
- —
Personal DTI + credit; lowest rate.
DSCR
20% down · 8.5% · 30yr
- Down + closing
- —
- Monthly P&I
- —
- Monthly cashflow
- —
- DSCR
- —
- Eligible?
- —
No personal income docs; deal must DSCR.
Hard money
10% down · 12.0% · 12mo
- Down + closing
- —
- Monthly P&I
- —
- Monthly cashflow
- —
- DSCR
- —
- Eligible?
- —
Short-term bridge; refi at stabilization.
Rent comps 1 comps
| Address | Beds | Baths | Sqft | Rent | $/sqft | DOM | Units | Dist |
|---|---|---|---|---|---|---|---|---|
| 133 Hemlock Dr Billings, MT | 3.0 | 2.0 | 1450 | $1,700 | $1.17 | 45d | 1 | 0.60mi |
HOA detail
- Monthly dues
- $695 · $8,340/yr
Listing history 14 events
-
2026-06-21days on market $59,000 Active 19 DOM
-
2026-06-19days on market $59,000 Active 17 DOM
-
2026-06-18days on market $59,000 Active 16 DOM
-
2026-06-17days on market $59,000 Active 15 DOM
-
2026-06-16days on market $59,000 Active 14 DOM
-
2026-06-15days on market $59,000 Active 13 DOM
-
2026-06-14days on market $59,000 Active 11 DOM
-
2026-06-13days on market $59,000 Active 10 DOM
-
2026-06-10days on market $59,000 Active 8 DOM
-
2026-06-09days on market $59,000 Active 7 DOM
-
2026-06-08days on market $59,000 Active 6 DOM
-
2026-06-07days on market $59,000 Active 5 DOM
-
2026-06-05days on market $59,000 Active 2 DOM
-
2026-06-03$59,000 Active 1 DOM
ⓘ Source: listings_history table (triggers on properties + properties_extension) + one-shot
backfill from property_details.listing_events for pre-trigger history.
Climate risk First Street
- Flood 1/10 Low FEMA zone D · 0% chance over 30 yrs
- Wildfire 7/10 Severe
- Heat 3/10 Moderate 7 d/yr ≥94°F today · 15 d/yr by 30 yrs out
- Wind 1/10 Low
- Air quality 4/10 Moderate 5 unhealthy d/yr today · 6 by 30 yrs out
Nearby sold comps map
Loading sold comps map…
Walkable amenities ~0.75 mi
Loading nearby amenities…
Taxation est. · year 1
- Rental income
- $17,236
- − Mortgage interest
- −$3,305
- − Property taxes
- −$885
- − Insurance
- −$295
- − Repairs & maintenance
- −$1,379
- − Management
- −$1,379
- − HOA
- −$8,340
- − Depreciation
- −$1,716
- Taxable loss
- −$63
- Est. tax savings @ 24.0%
- +$15
- After-tax cash flow
- $399/yr
For passive investors: Depreciation is non-cash, so a rental often shows a tax loss while cash-flowing — sheltering income. Rental losses are passive: they offset passive income freely, and up to $25,000/yr can offset ordinary (W-2) income if you actively participate and your MAGI is under $100k (phasing out to $0 by $150k); unused losses carry forward. On sale, claimed depreciation is recaptured at up to 25%, and gains may owe capital-gains tax (a 1031 exchange can defer both). Figures are a year-1 estimate at your 24.0% rate — not tax advice; consult a CPA.
Condition & rehab AI · 12 photos
The home requires moderate renovations to update the kitchen and bathrooms, repair the exterior siding, and paint the interior walls. These updates would significantly increase its resale and rental value.
Repairs flagged
- Moderate kitchen cabinets — dated and in need of replacement
- Moderate kitchen countertops — dated and in need of replacement
- Moderate bathroom cabinets — dated and in need of replacement
- Moderate bathroom countertops — dated and in need of replacement
- Moderate exterior siding — moderate wear
Value-add opportunities
- Both update kitchen cabinets and countertops — modernizing the kitchen would appeal to both buyers and renters
- Both update bathroom cabinets and countertops — modernizing the bathrooms would appeal to both buyers and renters
- Both repair and paint exterior siding — improving the exterior would enhance curb appeal and increase property value
Renovation cost estimate screening
| Repair item | Severity | Est. cost |
|---|---|---|
| kitchen cabinets · dated and in need of replacement | Moderate | $3,000–15,000 |
| kitchen countertops · dated and in need of replacement | Moderate | $3,000–15,000 |
| bathroom cabinets · dated and in need of replacement | Moderate | $3,000–15,000 |
| bathroom countertops · dated and in need of replacement | Moderate | $3,000–15,000 |
| exterior siding · moderate wear | Moderate | $3,000–15,000 |
| Total estimated repair cost · 5 items | $15,000–75,000 |
Value-add ROI direction
- Both update kitchen cabinets and countertops — modernizing the kitchen would appeal to both buyers and renters ↑
- Both update bathroom cabinets and countertops — modernizing the bathrooms would appeal to both buyers and renters ↑
- Both repair and paint exterior siding — improving the exterior would enhance curb appeal and increase property value ↑
ⓘ Cost ranges are severity-bucket heuristics (US national rule-of-thumb). Get contractor quotes + a written scope before underwriting a rehab budget.
Schools (NCES district)
- District
- Lockwood K-12
- NCES district ID
- 3000656
- Math proficiency
- 21% ▼ -5.00%
- Reading proficiency
- 33% ▼ -1.00%
- Median HH income
- $53,104
- Composite
- 23.97/100
- National rank
- #7779
- State rank
- #86 of 116 in MT
Livability — Lockwood
- Score
- 59/100
- State rank
- #238
- US rank
- #20350
Category grades
Schools grade is shown separately in the Schools card above.
Census & demographics
- Census place
- Lockwood, MT
- County
- Yellowstone County · 159,426 people
- Metro
- Billings, MT
- Population (ZIP)
- 42,250
- Household income
- $58,598
- Rent vs Own
- Severe rent burden
- 1534.0
Population outlook (Yellowstone County) Hauer SSP2
- Today (2025)
- 176,227 people
- By 2030
- 185,619 · +5.3%
- By 2040
- 203,543 · +15.5%
- By 2050
- 221,100 · +25.5%
- By 2075
- 266,931 · +51.5%
- By 2100
- 301,141 · +70.9%
Race, ethnicity, and origin ACS 2023
- Neighborhood character
- Predominantly White (75%)
- Race & ethnicity
- White 75% Hispanic / Latino 9% Native American 9% Two or more races 8% Black 1%
- Hispanic origin (detail)
- Mexican 6%
- Common ancestry
- Portuguese 6% Italian 2% Lithuanian 2%
- Foreign-born
- 2% · Canada
- Languages at home
- 96% English-only · Spanish 1%
Political lean MEDSL · Yellowstone
- 2024 margin
- Strong R (+27.1) · D 34.9% · R 62.0% · Other 3.1%
- 2008→2024 swing
- -20.8pp toward R · 2008: -6.3pp · 2024: -27.1pp
- All cycles
- 2024: R+27.1 2020: R+24.0 2016: R+27.1 2012: R+20.6 2008: R+6.3
Not yet ingested
- Civics
- —
Market trends
- HPI YoY
- ▼ -191.74%
- Current HPI
- 201.7039
- Rent YoY
- ▲ 3.96%
- Metro
- Billings, MT
- State GDP YoY
- ▲ 3.41%
- F500 in state
- 2
Industry mix (Fortune 500 HQ in MT)
| Industry | F500 HQs | Revenue |
|---|---|---|
| Technology / Analytics | 1 | $2B |
|
||
Price history
1 event — show timeline
- 2026-06-02 Listed $59,000 BMTMLS
Cash-flow waterfall
monthlySold comps — $/sqft
last 12 mo · ≤1 miLoading sold comps…