 Multi-family
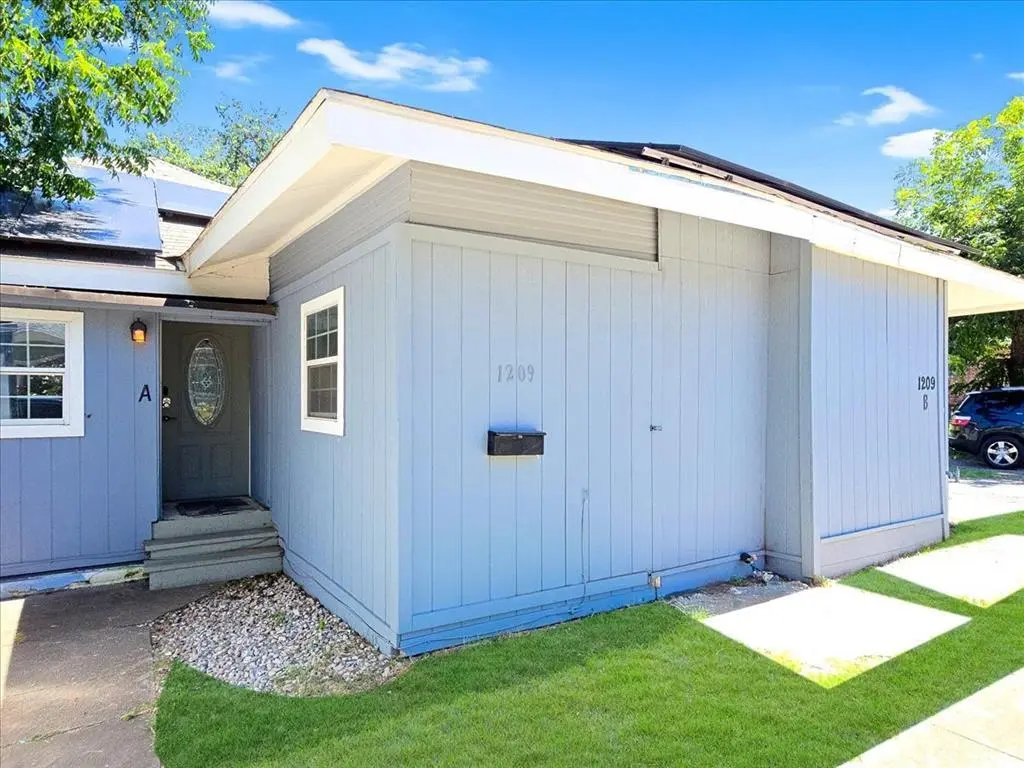
1209 15th Pl · Fort Worth, TX
Flood risk 1/10 · Minimal
- FEMA flood zone
- X (unshaded)
- Chance of flooding over 30 yrs
- 0.0%
- Est. flood insurance / yr
- $507 – $1,088
Fire risk 2/10 · Minimal
- Est. fire insurance / yr
- $1,222 – $2,270
Heat risk 8/10 · Major
- Hot days now (above 109°F)
- 7 days/yr
- Hot days in 30 yrs
- 23 days/yr
Wind risk 4/10 · Minor
- Chance of severe wind over 30 yrs
- 24.0%
Air-quality risk 3/10 · Minor
- Unhealthy air days now
- 3 days/yr
- Unhealthy air days in 30 yrs
- 4 days/yr
Risk factors via First Street. Map © Google.
Why this score? — see what drove the B grade
The composite is a weighted blend of 9 inputs, each scored 0–100. Each bar is that input's sub-score; the figure is the points it added to the 100-point composite (weight × sub-score).
- Cash flow +30.0/30.0
- DSCR +10.0/10.0
- Appreciation +8.1/10.0
- 1% rule +7.6/10.0
- ARV discount +7.0/15.0
- Livability +4.0/5.0
- Rent growth +2.5/5.0
- Condition / age +2.5/5.0
- Schools +2.0/10.0
$275,000
🖨 Deal sheet (PDF) 📄 Offer letter ✓ Due diligence
Multi-family units
County records classify this as Multi-Family (2-4 Unit). Listing-text estimate: 1 unit. estimate disagrees with records
Listing remarks MLS
Duplex near the Stockyards has great cash flow. The right side is a 2-bedroom, 1-bath, and leases for $1300 a month. The left side is vacant currently and should rent for the same amount. That is $31,200 in annual income. The left side has an add-on and is larger than the right side. 9x7 office and 2 storage areas inside that could be used in multiple ways. 1 is 13x6 & the other is 12x6. Only show the left side until we have an executed contract
Key facts
- 2 storage areas
- 9x7 office
- 5,445 sq ft lot
Tags
Neighborhood map
What this means for you Summary
Snapshot
- This is a 4-bed/2.0-bath multifamily listed at $275k.
Deal economics
- At list price, monthly cash flow is $1k ($13k/yr) — positive.
- The deal already cash-flows at list — no discount required.
- Meets the 1% rule at list price ($3k rent vs $275k).
- Recommended offer: $242k (12.0% below list) — sets the bar for market timing.
- Cap rate 11.0% vs local median 3.9% in Fort Worth — top-decile yield for the area; either an underpriced asset or a hidden risk that comps aren't pricing in. Stress-test before assuming the spread holds.
Location & tenants
- Location reads 80/100 on livability (#49 in TX, #1,954 nationally) — a professional / high-income tenant draw. Strengths: amenities A+, cost of living A+, housing A+; Watch: schools D+, crime F.
- Fort Worth ISD (urban): math 18% / reading 28% proficiency, ranked #742 of 826 in TX (top 90%) — low school quality limits family demand, transient renter base, plan for 1-2y turnover; 73% free/reduced lunch — lower-income household profile, screen leases tightly.
- Market conditions: Rents flat; 33 active listings in the ZIP; 15 comparable units currently listed for rent nearby; rentals lingering (median 44d on market — plan ~5-8 weeks vacancy on turnover, expect pricing pressure); 60% of comp listings sitting > 30 days — soft ceiling on asking rent; 18,938 units permitted in Tarrant County in 2024 (8,336 in 5+ unit buildings).
- At $3,467/mo this rent would consume 79% of the median local household income ($53k/yr) (locally 406% of renters already pay >50% of income on rent) — very limited rent-growth headroom before tenants either downsize or default.
Forward outlook
- In year one you build about $19k of equity ($2k loan paydown + $17k appreciation (6.3% local appreciation)).
- Tarrant County population projected at +41% by 2050 — long-run rental-demand tailwind backs the buy-and-hold thesis.
- At projected returns (6.3% appreciation + 0.0% rent growth), your $77k cash investment doubles in ~3 years — after that, you're playing with house money.
- By year 2, paydown + projected appreciation supports a ~$31k cash-out refi (75% LTV) — recoverable capital for the next deal without selling this one.
Negotiation context
- It's been on market 327 days — a 12% lower offer ($242k) is reasonable based on typical stale-listing flexibility.
- 2 sale attempts since 22y ago; this cycle's ask has dropped $25k (8%) from the opening price — seller is motivated, your offer sets the floor, not the list.
Risks & watch-outs
- Watch-outs: built in 1923 — expect roof / HVAC / electrical / plumbing capex.
- Climate carrying-cost: extreme-heat days projected 7→23/yr by 2055 (HVAC capex compounding) — expect insurance premiums to compound above CPI over the hold.
Questions for the listing agent
- It's been on market 327 days. Have you received any prior offers? Is the seller open to a 12% concession, seller financing, or rate buy-down credit?
- Built in 1923 — when were the roof, HVAC, electrical panel, plumbing, and water heater last replaced?
- Why hasn't it sold? Are there any deal-killer items the seller is aware of (foundation, flood, title, zoning, code violations)?
- Is there a deadline driving the sale (1031 exchange, divorce, estate, relocation)? That informs how much negotiation room exists.
- Schools are D-rated, which usually means shorter tenancies and higher turnover. Who's the typical renter profile here, and what's been the actual vacancy rate?
- Crime grade is F in this area — have there been break-ins, vandalism, or insurance claims at this property in the last 3 years? What carrier currently insures it and at what premium?
- What's the average days-on-market for RENTAL listings here right now (not sales)? A rising rental-DOM trend means longer vacancies and softer asking-rent achievability than the comps imply.
- What's the recent tenant-quality profile in this submarket — average credit score on applications, eviction rate, late-payment / NSF rate, and stable-employment percentage? A property-management company in the area should have these aggregated.
- How much new apartment / multifamily construction is in the pipeline within 1–3 miles? Heavy new supply (>2% of stock underway) typically softens rents 12–24 months out; light construction supports rent growth.
Investment metrics
- 1% rule
- 1.26% ✓
- Cap rate
- 10.97%
- Cash-on-cash
- 16.70%
- DSCR
- 1.74
- GRM
- 6.6
CMA / ARV
- ARV (median comp)
- $271,693
- List price
- $275,000
- Delta
- 1.22%
- Verdict
- FAIR
- Comps
- 5 within 1.0 mi
Show comp detail 2 sales within ~0.75 mi
| Address | Dist | Beds/Ba | Sqft | Sold | Price | $/sf | Match |
|---|---|---|---|---|---|---|---|
| 1203 Harrington Ave | 0.39mi | 4/3.0 | 2,292 (+12%) | 8mo | $285,000 | $124 | 50 |
| 1951 Belmont Ave | 0.65mi | 5/3.0 (+1) | 1,803 (-12%) | 16mo | $275,000 | $153 | 28 |
Match score weights: distance 35% · size 25% · config 20% · recency 20%. Top-matched comps best support the ARV.
Projected returns pro-forma
6.29% appreciation · 0.03% rent growth · sell at horizon
- IRR
- 28.2%
- Equity multiple
- 2.85×
- Total profit
- $142,166
- Equity at exit
- $177,857
- IRR
- 25.0%
- Equity multiple
- 5.48×
- Total profit
- $345,326
- Equity at exit
- $326,923
Cash invested: $77,000 (down + closing). Projections, not guarantees.
Landlord ↔ Tenant lean methodology
- Overall (STATE)
- 87 Strongly Landlord-Friendly
- State Texas
- 87 Strongly Landlord-Friendly · R+5
- County
- — inherits STATE
- City
- — inherits STATE
ZIP-level market 76164
- Home prices YoY
- 2.1%
- Rents YoY
- 0.0%
- Active inventory
- 33
- Price-to-rent
- 13.2×
Monthly cashflow live
- Estimated rent
- $3,467 high interval (Pro) →
- Mortgage (P&I)
- −$1,442
- Tax from tax record
- −$111 /mo · $1,330/yr
- Insurance
- −$115
- HOA
- −$0
- Vacancy / Maint / Mgmt
- −$728
- Net cashflow
- $1,071
Break-even live
Sensitivity live
| Price | -10% $1,227 | -5% $1,149 | +0% $1,071 | +5% $994 | +10% $916 |
|---|---|---|---|---|---|
| Rent | -10% $798 | -5% $934 | +0% $1,071 | +5% $1,208 | +10% $1,345 |
| Rate | -1.0pp $1,210 | -0.5pp $1,141 | base $1,071 | +0.5pp $1,000 | +1.0pp $928 |
2-unit breakdown (identical units grouped — click to expand)
| Units | Beds | Baths | Est. rent |
|---|---|---|---|
| 2× units | 2 | 1 | $3,466 |
| #1 | 2 | 1 | $1,733 |
| #2 | 2 | 1 | $1,733 |
| Total (2 units) | $3,467 | ||
UW: 25.0% down · 7.5% · 30yr · 1.5% tax · 5.0% vac · 8.0% maint · 8.0% mgmt
Financing live
Cash to close
- Down payment
- $68,750
- Closing costs
- $8,250
- Reserves months
- —
- Total cash needed
- —
Loan-product check · same deal, 3 products live
Conventional
25% down · 7.5% · 30yr
- Down + closing
- —
- Monthly P&I
- —
- Monthly cashflow
- —
- DSCR
- —
- Eligible?
- —
Personal DTI + credit; lowest rate.
DSCR
20% down · 8.5% · 30yr
- Down + closing
- —
- Monthly P&I
- —
- Monthly cashflow
- —
- DSCR
- —
- Eligible?
- —
No personal income docs; deal must DSCR.
Hard money
10% down · 12.0% · 12mo
- Down + closing
- —
- Monthly P&I
- —
- Monthly cashflow
- —
- DSCR
- —
- Eligible?
- —
Short-term bridge; refi at stabilization.
Rent comps 15 comps
| Address | Beds | Baths | Sqft | Rent | $/sqft | DOM | Units | Dist |
|---|---|---|---|---|---|---|---|---|
| 1217 Clinton Ave Fort Worth, TX | 4.0 | 2.0 | 1698 | $1,795 | $1.06 | 44d | 1 | 0.75mi |
| 852 Northwood Rd Fort Worth, TX | 3.0 | 2.0 | 1438 | $2,845 | $1.98 | 44d | 1 | 0.97mi |
| 207 Adrian Dr Fort Worth, TX | 3.0 | 2.5 | 2042 | $3,300 | $1.62 | 15d | 1 | 1.05mi |
| 218 Wimberly St Fort Worth, TX | 3.0 | 2.5 | 2080 | $3,400 | $1.63 | 5d | 1 | 1.08mi |
| 2801 Weisenberger St Fort Worth, TX | 3.0 | 4.0 | 2053 | $3,395 | $1.65 | 44d | 1 | 1.12mi |
| 2805 Weisenberger St #502 Fort Worth, TX | 3.0 | 3.5 | 2024 | $3,250 | $1.61 | 44d | 1 | 1.12mi |
| 101 Lindenwood Dr Fort Worth, TX | 3.0 | 2.0 | 2064 | $3,895 | $1.89 | 44d | 1 | 1.21mi |
| 2514 Columbus Ave Fort Worth, TX | 3.0 | 2.0 | 1432 | $2,500 | $1.75 | 44d | 1 | 1.28mi |
| 2815 Merrimac St Fort Worth, TX | 3.0 | 2.5 | 2254 | $3,200 | $1.42 | 44d | 1 | 1.34mi |
| 2621 Lee Ave Unit B Fort Worth, TX | 3.0 | 2.0 | 1400 | $1,550 | $1.11 | 6d | 1 | 1.40mi |
| 2621 Lee Ave Unit B Fort Worth, TX | 3.0 | 2.0 | 1400 | $1,595 | $1.14 | 44d | 1 | 1.40mi |
| 2621 Lee Ave Unit B Fort Worth, TX | 3.0 | 2.0 | 1400 | $1,550 | $1.11 | 22d | 1 | 1.40mi |
| 2621 Lee Ave Fort Worth, TX | 3.0 | 2.0 | 1400 | $1,550 | $1.11 | 22d | 1 | 1.40mi |
| 701 Arch Adams Ln Unit 3121 Fort Worth, TX | 3.0 | 2.0 | 1538 | $2,121 | $1.38 | 3d | 1 | 1.48mi |
| 701 Arch Adams Ln Unit 734 Fort Worth, TX | 3.0 | 2.0 | 1538 | $2,164 | $1.41 | 44d | 1 | 1.48mi |
Listing history 20 events
-
2026-06-17days on market $275,000 Active 327 DOM
-
2026-06-16days on market $275,000 Active 326 DOM
-
2026-06-15days on market $275,000 Active 325 DOM
-
2026-06-13days on market $275,000 Active 323 DOM
-
2026-06-09days on market $275,000 Active 319 DOM
-
2026-06-08days on market $275,000 Active 318 DOM
-
2026-06-07days on market $275,000 Active 317 DOM
-
2026-06-04days on market $275,000 Active 314 DOM
-
2026-06-03days on market $275,000 Active 313 DOM
-
2026-06-02days on market $275,000 Active 312 DOM
-
2026-06-02days on market $275,000 Active 311 DOM
-
2026-05-31days on market $275,000 Active 310 DOM
-
2025-11-06price $275,000 453-char remark
Show marketing remark (453 chars)
Duplex near the Stockyards has great cash flow. The right side is a 2-bedroom, 1-bath, and leases for $1300 a month. The left side is vacant currently and should rent for the same amount. That is $31,200 in annual income. The left side has an add-on and is larger than the right side. 9x7 office and 2 storage areas inside that could be used in multiple ways. 1 is 13x6 & the other is 12x6. Only show the left side until we have an executed contract
-
2025-07-25$299,900 Active 453-char remark
Show marketing remark (453 chars)
Duplex near the Stockyards has great cash flow. The right side is a 2-bedroom, 1-bath, and leases for $1300 a month. The left side is vacant currently and should rent for the same amount. That is $31,200 in annual income. The left side has an add-on and is larger than the right side. 9x7 office and 2 storage areas inside that could be used in multiple ways. 1 is 13x6 & the other is 12x6. Only show the left side until we have an executed contract
-
2015-05-28soldstatus
-
2013-03-19soldstatus
-
2005-06-01soldstatus
-
2005-04-19soldstatus 142-char remark
Show marketing remark (142 chars)
NEW ROOF HAS JUST BEEN COMPLETED IN SEPTEMBER 2004, ELECTRICAL UPDATED BRING ALL OFFERS JUST REDUCED FOR QUICK SELL CASH ONLY SOLD AS IS ONLY.
-
2005-04-10historical 142-char remark
Show marketing remark (142 chars)
NEW ROOF HAS JUST BEEN COMPLETED IN SEPTEMBER 2004, ELECTRICAL UPDATED BRING ALL OFFERS JUST REDUCED FOR QUICK SELL CASH ONLY SOLD AS IS ONLY.
-
2004-08-20$30,000 142-char remark
Show marketing remark (142 chars)
NEW ROOF HAS JUST BEEN COMPLETED IN SEPTEMBER 2004, ELECTRICAL UPDATED BRING ALL OFFERS JUST REDUCED FOR QUICK SELL CASH ONLY SOLD AS IS ONLY.
ⓘ Source: listings_history table (triggers on properties + properties_extension) + one-shot
backfill from property_details.listing_events for pre-trigger history.
Tax reassessment forecast TX · Resets to sale price
- Current annual tax
- $1,330 · $111/mo
- Projected year-2 tax
- $5,032 · $419/mo
- Expected delta
- +$3,703/yr (+$309/mo · 278.5%)
ⓘ Screening estimate from a state-policy table — verify with the county assessor before closing.
Climate risk First Street
- Flood 1/10 Low FEMA zone X (unshaded) · 0% chance over 30 yrs
- Wildfire 2/10 Low
- Heat 8/10 Severe 7 d/yr ≥109°F today · 23 d/yr by 30 yrs out
- Wind 4/10 Moderate 24% chance of damaging wind over 30 yrs
- Air quality 3/10 Moderate 3 unhealthy d/yr today · 4 by 30 yrs out
Nearby sold comps map
Loading sold comps map…
Walkable amenities ~0.75 mi
Loading nearby amenities…
Taxation est. · year 1
- Rental income
- $41,604
- − Mortgage interest
- −$15,404
- − Property taxes
- −$1,330
- − Insurance
- −$1,375
- − Repairs & maintenance
- −$3,328
- − Management
- −$3,328
- − Depreciation
- −$8,000
- Taxable income
- $8,838
- Est. tax owed @ 24.0%
- −$2,121
- After-tax cash flow
- $10,736/yr
For passive investors: Depreciation is non-cash, so a rental often shows a tax loss while cash-flowing — sheltering income. Rental losses are passive: they offset passive income freely, and up to $25,000/yr can offset ordinary (W-2) income if you actively participate and your MAGI is under $100k (phasing out to $0 by $150k); unused losses carry forward. On sale, claimed depreciation is recaptured at up to 25%, and gains may owe capital-gains tax (a 1031 exchange can defer both). Figures are a year-1 estimate at your 24.0% rate — not tax advice; consult a CPA.
Schools (NCES district)
- District
- Fort Worth ISD
- NCES district ID
- 4819700
- Math proficiency
- 18% ▼ -16.00%
- Reading proficiency
- 28% ▼ -6.00%
- Median HH income
- $42,109
- Composite
- 19.61/100
- National rank
- #8753
- State rank
- #742 of 826 in TX
Livability — Fort Worth
- Score
- 80/100
- State rank
- #49
- US rank
- #1954
Category grades
Schools grade is shown separately in the Schools card above.
Census & demographics
- Census place
- Fort Worth, TX
- County
- Tarrant County · 2,033,669 people
- City population
- 911,619
- Metro
- Dallas-Fort Worth-Arlington, TX
- Population (ZIP)
- 13,457
- Household income
- $52,882
- Rent vs Own
- Severe rent burden
- 406.0
Population outlook (Tarrant County) Hauer SSP2
- Today (2025)
- 2,380,417 people
- By 2030
- 2,578,900 · +8.3%
- By 2040
- 2,974,995 · +25.0%
- By 2050
- 3,350,489 · +40.8%
- By 2075
- 4,216,909 · +77.2%
- By 2100
- 4,741,527 · +99.2%
Race, ethnicity, and origin ACS 2023
- Neighborhood character
- Predominantly Hispanic (92%)
- Race & ethnicity
- Hispanic / Latino 92% Two or more races 28% White 5% Black 2%
- Hispanic origin (detail)
- Mexican 86%
- Foreign-born
- 35% · Canada
- Languages at home
- 27% English-only · Spanish 73%
Political lean MEDSL · Tarrant
- 2024 margin
- Lean R (+5.1) · D 46.7% · R 51.9% · Other 1.4%
- 2008→2024 swing
- +6.6pp toward D · 2008: -11.7pp · 2024: -5.1pp
- All cycles
- 2024: R+5.1 2020: D+0.2 2016: R+8.7 2012: R+15.7 2008: R+11.7
Not yet ingested
- Civics
- —
Market trends
- HPI YoY
- ▲ 6.29%
- Current HPI
- 305.7594
- Rent YoY
- ▬ 0.03%
- Metro
- Dallas-Fort Worth-Arlington, TX
- State GDP YoY
- ▲ 3.95%
- F500 in state
- 110
Industry mix (Fortune 500 HQ in TX)
| Industry | F500 HQs | Revenue |
|---|---|---|
| Energy | 16 | $1,198B |
|
||
| Technology | 5 | $198B |
|
||
| Engineering / Construction | 4 | $72B |
|
||
| Energy Services | 3 | $60B |
|
||
| Utilities | 3 | $41B |
|
||
| Healthcare | 2 | $330B |
|
||
Price history
+816.7% since first listed8 events — show timeline
- 2025-11-06 Price Changed $275,000 NTREIS
- 2025-07-25 Listed $299,900 NTREIS
- 2015-05-28 Sold (Public Records) — Public Records
- 2013-03-19 Sold (Public Records) — Public Records
- 2005-06-01 Sold (Public Records) — Public Records
- 2005-04-19 Sold (MLS) — NTREIS
- 2005-04-10 Listing Removed — NTREIS
- 2004-08-20 Listed $30,000 NTREIS
Property tax history
-1.8%/yrLatest (2025): $1,330 · +7.3% YoY. Source: county tax records.
Cash-flow waterfall
monthlySold comps — $/sqft
last 12 mo · ≤1 miLoading sold comps…