16121 Three Oaks Rd · Three Oaks, MI
Flood risk 1/10 · Minimal
- FEMA flood zone
- X (unshaded)
- Chance of flooding over 30 yrs
- 0.0%
- Est. flood insurance / yr
- $507 – $1,088
Fire risk 1/10 · Minimal
- Est. fire insurance / yr
- $784 – $1,456
Heat risk 2/10 · Minimal
- Hot days now (above 100°F)
- 7 days/yr
- Hot days in 30 yrs
- 15 days/yr
Wind risk 2/10 · Minimal
- Chance of severe wind over 30 yrs
- —
Air-quality risk 3/10 · Minor
- Unhealthy air days now
- 2 days/yr
- Unhealthy air days in 30 yrs
- 3 days/yr
Risk factors via First Street. Map © Google.
Why this score? — see what drove the C grade
The composite is a weighted blend of 9 inputs, each scored 0–100. Each bar is that input's sub-score; the figure is the points it added to the 100-point composite (weight × sub-score).
- Cash flow +24.1/30.0
- 1% rule +7.9/10.0
- DSCR +7.8/10.0
- ARV discount +7.5/15.0
- Livability +3.9/5.0
- Schools +3.7/10.0
- Rent growth +2.5/5.0
- Condition / age +2.5/5.0
- Appreciation +0.0/10.0
$170,000
🖨 Deal sheet 📄 Offer letter ✓ Due diligence
Listing remarks MLS
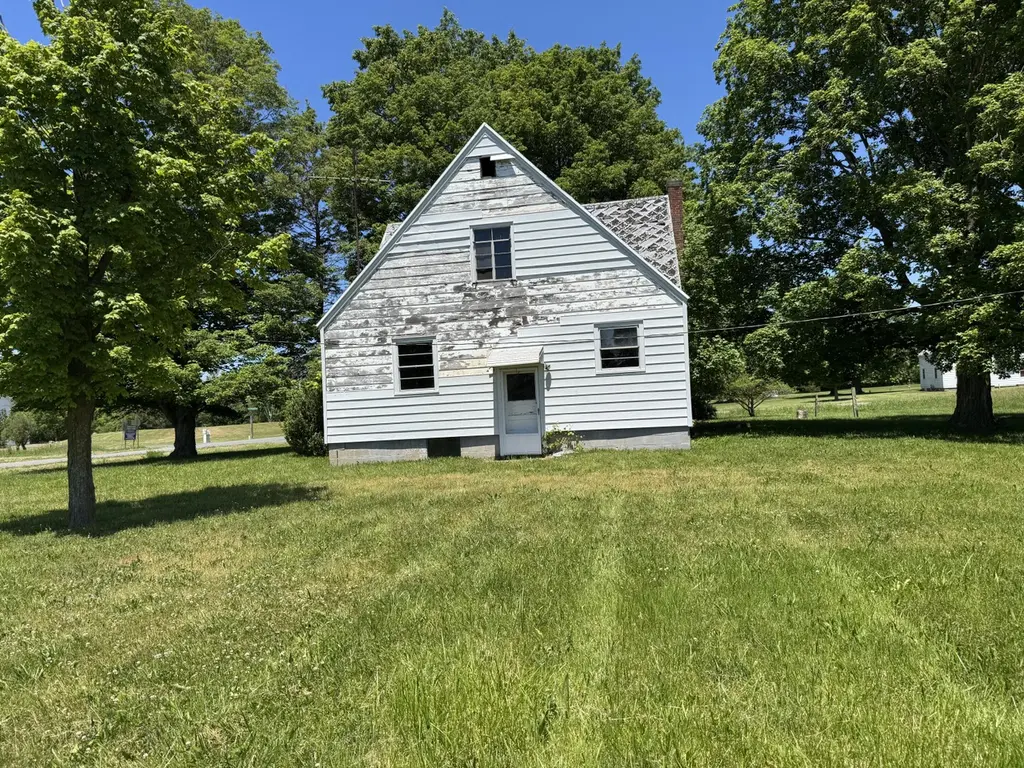
A unique rehab property that is being split off a larger farm parcel. All tax info are best guesses based on new parcel. There was a water incident so the owners stripped all the walls down to the studs. You can create a ''NEW'' three bedroom 2 bath house with just a few changes in the walls and rooms because you are starting with just the frame of a house. Needs all new mechanicals. Seller will install new well that will produce at least 5 gallons per minute of potable water after he has an offer, but before closing. Buyer has to create new septic for which Seller will provided permit and proposal to do the work. Mature trees all around the house. Just a mile north of downtown Three Oaks. Lots of permitted options for the 2.6 acres . Seller will complete land division prior to closing. You can enter from Three Oaks Rd or Elm Valley Rd. on existing driveways that cross drainage ditches.
Key facts
- New well
- Permitted options
- Existing driveways
Tags
Property features AI
Exterior
- Parking: Detached garage; 2-car garage
- Utilities: Well water; No public sewer
- Home design: Single-family residence; Traditional architectural style; Built in 1950
- Construction: Vinyl siding; Wood siding; Asphalt shingle roof; Built in 1950
- Exterior features: Corner lot; Wooded lot; Paved road access; Well water
Interior
- Kitchen: Kitchen (10 x 11)
- Bedrooms: Primary bedroom (12 x 12) — no primary bath; Bedroom 2 (10 x 12); Bedroom 3 (12 x 12); Bedroom 4 (9 x 12)
- Bathrooms: 1 full bathroom; 1 half bathroom
- Interior features: Full basement; 7 total rooms; Traditional-style layout
Neighborhood map
What this means for you Summary
Snapshot
- This is a 4-bed/1.5-bath single-family listed at $170k.
Deal economics
- At list price, monthly cash flow is $335 ($4k/yr) — positive.
- The deal already cash-flows at list — no discount required.
- Meets the 1% rule at list price ($2k rent vs $170k).
- Recommended offer: $167k (1.5% below list) — sets the bar for market timing.
Location & tenants
- Location reads 78/100 on livability (#109 in MI, #2,625 nationally) — a middle-class / working-renter tenant base. Strengths: crime A+, cost of living A+, housing A+; Watch: schools C-, amenities F, commute F.
- River Valley School District (rural): math 30% / reading 56% proficiency, ranked #171 of 540 in MI (top 32%) — families likely to look elsewhere, expect single-tenant / working-renter base with shorter leases.
- Market conditions: 51 active listings in the ZIP; 397 units permitted in Berrien County in 2024 (40 in 5+ unit buildings).
Forward outlook
- Local home prices are declining (-3.0%/yr); year-one equity from $1k of loan paydown is wiped out by about $5k of value loss. Plan a longer hold.
- Berrien County population projected at -16% by 2050 — secular population decline; favor cash flow + early exit over multi-decade hold.
Negotiation context
- It's been on market 15 days — a 2% lower offer ($167k) is reasonable based on typical stale-listing flexibility.
- 5 sale attempts since 21y ago; this cycle's ask is 143% above the opening price — seller raised mid-cycle; expect resistance to lowballs.
Risks & watch-outs
- Watch-outs: property tax is 3.1% of price; built in 1950 — expect roof / HVAC / electrical / plumbing capex.
Questions for the listing agent
- Built in 1950 — when were the roof, HVAC, electrical panel, plumbing, and water heater last replaced?
- Property tax is high relative to price — has the assessment been appealed recently, and will the sale trigger a re-assessment?
- Is there a deadline driving the sale (1031 exchange, divorce, estate, relocation)? That informs how much negotiation room exists.
- What's the average days-on-market for RENTAL listings here right now (not sales)? A rising rental-DOM trend means longer vacancies and softer asking-rent achievability than the comps imply.
- What's the recent tenant-quality profile in this submarket — average credit score on applications, eviction rate, late-payment / NSF rate, and stable-employment percentage? A property-management company in the area should have these aggregated.
- How much new for-sale + rental construction is in the pipeline within 1–3 miles? Heavy new supply typically softens prices + rents 12–24 months out; constrained supply supports both.
Investment metrics
- 1% rule
- 1.29% ✓
- Cap rate
- 8.66%
- Cash-on-cash
- 8.45%
- DSCR
- 1.38
- GRM
- 6.5
CMA / ARV
- ARV (on-the-fly)
- $390,780
- Comps found
- 1
Show comp detail 1 sale within ~0.75 mi
| Address | Dist | Beds/Ba | Sqft | Sold | Price | $/sf | Match |
|---|---|---|---|---|---|---|---|
| 16576 Three Oaks Rd | 0.57mi | 3/1.0 (-1) | 1,272 (+9%) | 9mo | $425,000 | $334 | 45 |
Match score weights: distance 35% · size 25% · config 20% · recency 20%. Top-matched comps best support the ARV.
Projected returns pro-forma
-3.0% appreciation · 3.0% rent growth · sell at horizon
- IRR
- -3.4%
- Equity multiple
- 0.87×
- Total profit
- $-6,035
- Equity at exit
- $25,348
- IRR
- 6.4%
- Equity multiple
- 1.48×
- Total profit
- $22,916
- Equity at exit
- $14,698
Cash invested: $47,600 (down + closing). Projections, not guarantees.
Landlord ↔ Tenant lean methodology
- Overall (STATE)
- 62 Landlord-Friendly
- State Michigan
- 62 Landlord-Friendly · EVEN
- County
- — inherits STATE
- City
- — inherits STATE
ZIP-level market 49128
- Home prices YoY
- -23.9%
- Active inventory
- 51
- Price-to-rent
- 6.5×
Monthly cashflow live
- Estimated rent
- $2,192 medium interval (Pro) →
- Mortgage (P&I)
- −$891
- Tax from tax record
- −$435 /mo · $5,215/yr
- Insurance
- −$71
- HOA
- −$0
- Vacancy / Maint / Mgmt
- −$460
- Net cashflow
- $335
Break-even live
UW: 25.0% down · 7.5% · 30yr · 1.5% tax · 5.0% vac · 8.0% maint · 8.0% mgmt
Financing live
Cash to close
- Down payment
- $42,500
- Closing costs
- $5,100
- Reserves months
- —
- Total cash needed
- —
Loan-product check · same deal, 3 products live
Conventional
25% down · 7.5% · 30yr
- Down + closing
- —
- Monthly P&I
- —
- Monthly cashflow
- —
- DSCR
- —
- Eligible?
- —
Personal DTI + credit; lowest rate.
DSCR
20% down · 8.5% · 30yr
- Down + closing
- —
- Monthly P&I
- —
- Monthly cashflow
- —
- DSCR
- —
- Eligible?
- —
No personal income docs; deal must DSCR.
Hard money
10% down · 12.0% · 12mo
- Down + closing
- —
- Monthly P&I
- —
- Monthly cashflow
- —
- DSCR
- —
- Eligible?
- —
Short-term bridge; refi at stabilization.
Listing history 13 events
-
2026-06-19days on market $170,000 Active 15 DOM
-
2026-06-18days on market $170,000 Active 14 DOM
-
2026-06-17days on market $170,000 Active 13 DOM
-
2026-06-16days on market $170,000 Active 12 DOM
-
2026-06-15days on market $170,000 Active 11 DOM
-
2026-06-14days on market $170,000 Active 9 DOM
-
2026-06-13days on market $170,000 Active 8 DOM
-
2026-06-10days on market $170,000 Active 6 DOM
-
2026-06-09days on market $170,000 Active 5 DOM
-
2026-06-08days on market $170,000 Active 4 DOM
-
2026-06-07days on market $170,000 Active 3 DOM
-
2026-06-05remarks 699-char remark
-
2026-06-05$170,000 Active 1 DOM
ⓘ Source: listings_history table (triggers on properties + properties_extension) + one-shot
backfill from property_details.listing_events for pre-trigger history.
Tax reassessment forecast MI · Partial reset (capped growth)
- Current annual tax
- $5,215 · $435/mo
- Projected year-2 tax
- $5,215 · $435/mo
- Expected delta
- $0/yr ($0/mo · 0.0%)
ⓘ Screening estimate from a state-policy table — verify with the county assessor before closing.
Climate risk First Street
- Flood 1/10 Low FEMA zone X (unshaded) · 0% chance over 30 yrs
- Wildfire 1/10 Low
- Heat 2/10 Low 7 d/yr ≥100°F today · 15 d/yr by 30 yrs out
- Wind 2/10 Low
- Air quality 3/10 Moderate 2 unhealthy d/yr today · 3 by 30 yrs out
Nearby sold comps map
Loading sold comps map…
Walkable amenities ~0.75 mi
Loading nearby amenities…
Taxation est. · year 1
- Rental income
- $26,309
- − Mortgage interest
- −$9,523
- − Property taxes
- −$5,215
- − Insurance
- −$850
- − Repairs & maintenance
- −$2,105
- − Management
- −$2,105
- − Depreciation
- −$4,945
- Taxable income
- $1,567
- Est. tax owed @ 24.0%
- −$376
- After-tax cash flow
- $3,645/yr
For passive investors: Depreciation is non-cash, so a rental often shows a tax loss while cash-flowing — sheltering income. Rental losses are passive: they offset passive income freely, and up to $25,000/yr can offset ordinary (W-2) income if you actively participate and your MAGI is under $100k (phasing out to $0 by $150k); unused losses carry forward. On sale, claimed depreciation is recaptured at up to 25%, and gains may owe capital-gains tax (a 1031 exchange can defer both). Figures are a year-1 estimate at your 24.0% rate — not tax advice; consult a CPA.
Schools (NCES district)
- District
- River Valley School District
- NCES district ID
- 2629790
- Math proficiency
- 30% ▼ -6.00%
- Reading proficiency
- 56% ▲ 6.00%
- Median HH income
- $47,899
- Composite
- 36.67/100
- National rank
- #4609
- State rank
- #171 of 540 in MI
Livability — Three Oaks
- Score
- 78/100
- State rank
- #109
- US rank
- #2625
Category grades
Schools grade is shown separately in the Schools card above.
Census & demographics
- Population (ZIP)
- 3,461
Population outlook (Berrien County) Hauer SSP2
- Today (2025)
- 149,273 people
- By 2030
- 145,211 · -2.7%
- By 2040
- 135,435 · -9.3%
- By 2050
- 125,543 · -15.9%
- By 2075
- 103,986 · -30.3%
- By 2100
- 82,256 · -44.9%
Race, ethnicity, and origin ACS 2023
- Neighborhood character
- Predominantly White (84%)
- Race & ethnicity
- White 84% Two or more races 12% Hispanic / Latino 11%
- Hispanic origin (detail)
- Mexican 10%
- Common ancestry
- Romanian 10% Iranian 6% Lithuanian 3%
- Foreign-born
- 3% · Canada
- Languages at home
- 92% English-only · Spanish 7%
Political lean MEDSL · Berrien
- 2024 margin
- Lean R (+7.9) · D 45.4% · R 53.2% · Other 1.4%
- 2008→2024 swing
- -13.3pp toward R · 2008: 5.5pp · 2024: -7.9pp
- All cycles
- 2024: R+7.9 2020: R+7.4 2016: R+12.7 2012: R+6.6 2008: D+5.5
Not yet ingested
- Civics
- —
Market trends
- HPI YoY
- ▼ -85.74%
- Current HPI
- 273.5945
- Rent YoY
- —
- Metro
- —
- State GDP YoY
- ▲ 1.37%
- F500 in state
- 28
Industry mix (Fortune 500 HQ in MI)
| Industry | F500 HQs | Revenue |
|---|---|---|
| Automotive Parts | 3 | $48B |
|
||
| Automotive | 2 | $372B |
|
||
| Chemicals | 1 | $45B |
|
||
| Automotive Retail | 1 | $29B |
|
||
| Healthcare / Medical Devices | 1 | $23B |
|
||
| Automotive Technology | 1 | $20B |
|
||
Price history
-55.5% since first listed10 events — show timeline
- 2026-06-04 Price Changed $170,000 MiRealSource-MiMLS
- 2026-06-04 Price Changed $170,000 REALCOMP
- 2026-06-04 Price Changed $170,000 SW Michigan MLS
- 2026-06-02 Listed $70,000 SW Michigan MLS
- 2026-06-02 Listed $70,000 REALCOMP
- 2026-06-02 Listed $70,000 MiRealSource-MiMLS
- 2005-08-17 Sold (MLS) $388,000 REALCOMP
- 2005-08-17 Sold (MLS) $388,000 SW Michigan MLS
- 2005-06-03 Listed $382,000 REALCOMP
- 2005-06-03 Listed $382,000 SW Michigan MLS
Cash-flow waterfall
monthlySold comps — $/sqft
last 12 mo · ≤1 miLoading sold comps…