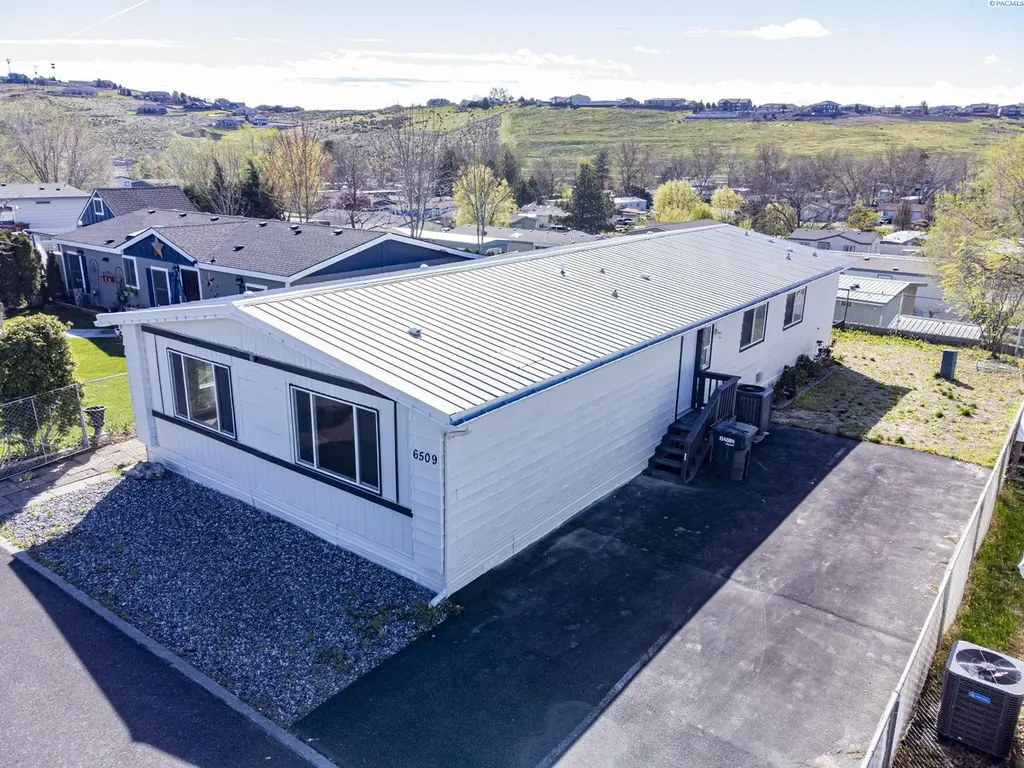
6509 James St #643 · West Richland, WA
Flood risk 1/10 · Minimal
- FEMA flood zone
- X
- Chance of flooding over 30 yrs
- 0.0%
- Est. flood insurance / yr
- $507 – $1,088
Fire risk 6/10 · Moderate
- Est. fire insurance / yr
- $604 – $1,122
Heat risk 5/10 · Moderate
- Hot days now (above 98°F)
- 7 days/yr
- Hot days in 30 yrs
- 15 days/yr
Wind risk 1/10 · Minimal
- Chance of severe wind over 30 yrs
- —
Air-quality risk 8/10 · Major
- Unhealthy air days now
- 14 days/yr
- Unhealthy air days in 30 yrs
- 14 days/yr
Risk factors via First Street. Map © Google.
Why this score? — see what drove the B+ grade
The composite is a weighted blend of 9 inputs, each scored 0–100. Each bar is that input's sub-score; the figure is the points it added to the 100-point composite (weight × sub-score).
- Cash flow +30.0/30.0
- ARV discount +12.3/15.0
- 1% rule +10.0/10.0
- DSCR +10.0/10.0
- Schools +5.3/10.0
- Condition / age +3.8/5.0
- Livability +3.6/5.0
- Rent growth +2.5/5.0
- Appreciation +0.0/10.0
$125,000
🖨 Deal sheet 📄 Offer letter ✓ Due diligence
Listing remarks MLS
MLS# 291732 Discover your perfect new home in a charming community! This beautifully updated residence features four spacious bedrooms and a versatile bonus room, along with two modern bathrooms that include a large soaker tub and a stunning walk-in tile and stone shower. Freshly painted inside and out, the home boasts brand new carpet and flooring throughout. Enjoy ample parking for multiple vehicles and extra storage with a large outdoor shed. Located just minutes from shopping amenities and with easy access to freeways, this home offers both convenience and comfort. Showings are by appointment, subject to park approval, with flexible seller financing options available. Schedule your viewing today!
Key facts
- Versatile bonus room
- Large outdoor shed
- Built 1978
Tags
Neighborhood map
What this means for you Summary
Snapshot
- This is a 4-bed/2.0-bath manufactured listed at $125k. Condition is rated good.
Deal economics
- At list price, monthly cash flow is $1k ($15k/yr) — positive.
- The deal already cash-flows at list — no discount required.
- Meets the 1% rule at list price ($3k rent vs $125k).
- Recommended offer: $118k (6.0% below list) — sets the bar for market timing.
- Cap rate 17.9% vs local median 3.2% in West Richland — top-decile yield for the area; either an underpriced asset or a hidden risk that comps aren't pricing in. Stress-test before assuming the spread holds.
Location & tenants
- Location reads 71/100 on livability (#236 in WA) — a middle-class / working-renter tenant base. Strengths: crime A+, employment A+, housing A+; Watch: cost of living D+, amenities F, commute F.
- Richland School District (urban): math 52% / reading 64% proficiency, ranked #61 of 291 in WA (top 21%) — acceptable for families but not a draw, mixed tenant base, ~2y average lease.
- Market conditions: 243 active listings in the ZIP; 6 comparable units currently listed for rent nearby; rentals leasing fast (median 14d on market — plan ~1-2 weeks tenant-placement turnaround); high-income renter base; 1,532 units permitted in Benton County in 2024 (389 in 5+ unit buildings).
Forward outlook
- Local home prices are declining (-3.0%/yr); year-one equity from $864 of loan paydown is wiped out by about $4k of value loss. Plan a longer hold.
- Benton County population projected at +32% by 2050 — long-run rental-demand tailwind backs the buy-and-hold thesis.
- At projected returns (-3.0% appreciation + 3.0% rent growth), your $35k cash investment doubles in ~3 years — after that, you're playing with house money.
Negotiation context
- It's been on market 77 days — a 6% lower offer ($118k) is reasonable based on typical stale-listing flexibility.
- 2 sale attempts since 7y ago with the ask held roughly flat each time — persistent listings suggest the price (not the market) is what's stuck; bring a comps-based counter.
Risks & watch-outs
- Climate carrying-cost: major wildfire risk; extreme-heat days projected 7→15/yr by 2055 (HVAC capex compounding) — expect insurance premiums to compound above CPI over the hold.
Questions for the listing agent
- It's been on market 77 days. Have you received any prior offers? Is the seller open to a 6% concession, seller financing, or rate buy-down credit?
- Built in 1978 — when were the roof, HVAC, electrical panel, plumbing, and water heater last replaced?
- Why hasn't it sold? Are there any deal-killer items the seller is aware of (foundation, flood, title, zoning, code violations)?
- Is there a deadline driving the sale (1031 exchange, divorce, estate, relocation)? That informs how much negotiation room exists.
- Schools are B-rated — typically a magnet for longer-tenancy family renters. What's the average tenant stay here, and is there a school-zone premium baked into asking?
- What's the average days-on-market for RENTAL listings here right now (not sales)? A rising rental-DOM trend means longer vacancies and softer asking-rent achievability than the comps imply.
- What's the recent tenant-quality profile in this submarket — average credit score on applications, eviction rate, late-payment / NSF rate, and stable-employment percentage? A property-management company in the area should have these aggregated.
- How much new for-sale + rental construction is in the pipeline within 1–3 miles? Heavy new supply typically softens prices + rents 12–24 months out; constrained supply supports both.
Investment metrics
- 1% rule
- 2.10% ✓
- Cap rate
- 17.91%
- Cash-on-cash
- 41.48%
- DSCR
- 2.85
- GRM
- 4.0
CMA / ARV
- ARV (median comp)
- $140,000
- List price
- $125,000
- Delta
- -10.71%
- Verdict
- UNDERPRICED
- Comps
- 9 within 1.0 mi
Show comp detail 12 sales within ~0.75 mi
| Address | Dist | Beds/Ba | Sqft | Sold | Price | $/sf | Match |
|---|---|---|---|---|---|---|---|
| 302 Tumbleweed Ct | 0.12mi | 3/2.0 (-1) | 1,724 (-0%) | 6mo | $150,000 | $87 | 84 |
| 6633 Desert View Dr | 0.14mi | 4/2.0 | 1,716 (-1%) | 11mo | $110,000 | $64 | 83 |
| 6500 James St #567 | 0.04mi | 4/2.0 | 1,960 (+13%) | 2mo | $125,000 | $64 | 75 |
| 6511 James St | 0.01mi | 3/2.0 (-1) | 1,536 (-11%) | 3mo | $140,000 | $91 | 74 |
| 231 James St | 0.18mi | 4/2.0 | 1,821 (+5%) | 15mo | $135,000 | $74 | 71 |
| 6403 James St | 0.09mi | 3/2.0 (-1) | 1,836 (+6%) | 13mo | $137,900 | $75 | 70 |
| 6305 Haag St | 0.21mi | 3/2.0 (-1) | 1,848 (+7%) | 13mo | $100,000 | $54 | 63 |
| 145 N 66th Ave | 0.14mi | 3/2.0 (-1) | 1,809 (+4%) | 23mo | $115,000 | $64 | 62 |
| 6200 James St | 0.21mi | 3/2.0 (-1) | 1,568 (-10%) | 11mo | $160,000 | $102 | 61 |
| 6501 James St | 0.04mi | 3/2.0 (-1) | 1,560 (-10%) | 19mo | $90,000 | $58 | 60 |
| 103 N 62nd Ave | 0.23mi | 3/2.0 (-1) | 1,512 (-13%) | 23mo | $139,000 | $92 | 44 |
| 1122 Grosscup Blvd | 0.64mi | 4/2.0 | 1,512 (-13%) | 18mo | $317,000 | $210 | 34 |
Match score weights: distance 35% · size 25% · config 20% · recency 20%. Top-matched comps best support the ARV.
Projected returns pro-forma
-3.0% appreciation · 3.0% rent growth · sell at horizon
- IRR
- 38.1%
- Equity multiple
- 2.62×
- Total profit
- $56,847
- Equity at exit
- $18,638
- IRR
- 44.6%
- Equity multiple
- 5.25×
- Total profit
- $148,893
- Equity at exit
- $10,808
Cash invested: $35,000 (down + closing). Projections, not guarantees.
Landlord ↔ Tenant lean methodology
- Overall (STATE)
- 28 Tenant-Leaning
- State Washington
- 28 Tenant-Leaning · D+8
- County
- — inherits STATE
- City
- — inherits STATE
ZIP-level market 99353
- Active inventory
- 243
- Price-to-rent
- 4.0×
Monthly cashflow live
- Estimated rent
- $2,625 high interval (Pro) →
- Mortgage (P&I)
- −$656
- Tax est. 1.5%
- −$156 /mo · $1,875/yr
- Insurance
- −$52
- HOA
- −$0
- Vacancy / Maint / Mgmt
- −$551
- Net cashflow
- $1,210
Break-even live
UW: 25.0% down · 7.5% · 30yr · 1.5% tax · 5.0% vac · 8.0% maint · 8.0% mgmt
Financing live
Cash to close
- Down payment
- $31,250
- Closing costs
- $3,750
- Reserves months
- —
- Total cash needed
- —
Loan-product check · same deal, 3 products live
Conventional
25% down · 7.5% · 30yr
- Down + closing
- —
- Monthly P&I
- —
- Monthly cashflow
- —
- DSCR
- —
- Eligible?
- —
Personal DTI + credit; lowest rate.
DSCR
20% down · 8.5% · 30yr
- Down + closing
- —
- Monthly P&I
- —
- Monthly cashflow
- —
- DSCR
- —
- Eligible?
- —
No personal income docs; deal must DSCR.
Hard money
10% down · 12.0% · 12mo
- Down + closing
- —
- Monthly P&I
- —
- Monthly cashflow
- —
- DSCR
- —
- Eligible?
- —
Short-term bridge; refi at stabilization.
Rent comps 6 comps
| Address | Beds | Baths | Sqft | Rent | $/sqft | DOM | Units | Dist |
|---|---|---|---|---|---|---|---|---|
| 6855 Cyprus Loop West Richland, WA | 3.0 | 2.0 | 2185 | $3,395 | $1.55 | 21d | 1 | 0.75mi |
| 859 Duke Ln West Richland, WA | 3.0 | 2.5 | 1472 | $2,095 | $1.42 | 13d | 1 | 0.95mi |
| 977 Creer Way Unit D-111 West Richland, WA | 3.0 | 2.5 | 1233 | $1,995 | $1.62 | 21d | 1 | 1.02mi |
| 977 Creer Way Unit D-112 West Richland, WA | 3.0 | 2.5 | 1233 | $2,095 | $1.70 | 13d | 1 | 1.02mi |
| 7752 Ranchland Ln West Richland, WA | 4.0 | 2.5 | 2050 | $2,495 | $1.22 | 13d | 1 | 1.06mi |
| 8152 Paradise Way West Richland, WA | 2.0–3.0 | 2.0–2.5 | 1262 | $2,595 | $2.06 | 13d | 7 | 1.31mi |
Listing history 18 events
-
2026-06-18status $125,000 Pending 77 DOM
-
2026-06-17days on market $125,000 Active 77 DOM
-
2026-06-16days on market $125,000 Active 76 DOM
-
2026-06-15days on market $125,000 Active 75 DOM
-
2026-06-14days on market $125,000 Active 73 DOM
-
2026-06-13days on market $125,000 Active 72 DOM
-
2026-06-10days on market $125,000 Active 70 DOM
-
2026-06-09days on market $125,000 Active 69 DOM
-
2026-06-08days on market $125,000 Active 68 DOM
-
2026-06-07days on market $125,000 Active 67 DOM
-
2026-06-05days on market $125,000 Active 64 DOM
-
2026-06-03days on market $125,000 Active 63 DOM
-
2026-06-02days on market $125,000 Active 62 DOM
-
2026-06-01days on market $125,000 Active 61 DOM
-
2026-05-31days on market $125,000 Active 60 DOM
-
2026-05-30days on market $125,000 Active 59 DOM
-
2026-04-01$125,000 Active 709-char remark
Show marketing remark (709 chars)
MLS# 291732 Discover your perfect new home in a charming community! This beautifully updated residence features four spacious bedrooms and a versatile bonus room, along with two modern bathrooms that include a large soaker tub and a stunning walk-in tile and stone shower. Freshly painted inside and out, the home boasts brand new carpet and flooring throughout. Enjoy ample parking for multiple vehicles and extra storage with a large outdoor shed. Located just minutes from shopping amenities and with easy access to freeways, this home offers both convenience and comfort. Showings are by appointment, subject to park approval, with flexible seller financing options available. Schedule your viewing today!
-
2019-11-27$92,500
ⓘ Source: listings_history table (triggers on properties + properties_extension) + one-shot
backfill from property_details.listing_events for pre-trigger history.
Climate risk First Street
- Flood 1/10 Low FEMA zone X · 0% chance over 30 yrs
- Wildfire 6/10 Major
- Heat 5/10 Major 7 d/yr ≥98°F today · 15 d/yr by 30 yrs out
- Wind 1/10 Low
- Air quality 8/10 Severe 14 unhealthy d/yr today · 14 by 30 yrs out
Nearby sold comps map
Loading sold comps map…
Walkable amenities ~0.75 mi
Loading nearby amenities…
Taxation est. · year 1
- Rental income
- $31,501
- − Mortgage interest
- −$7,002
- − Property taxes
- −$1,875
- − Insurance
- −$625
- − Repairs & maintenance
- −$2,520
- − Management
- −$2,520
- − Depreciation
- −$3,636
- Taxable income
- $13,322
- Est. tax owed @ 24.0%
- −$3,197
- After-tax cash flow
- $11,322/yr
For passive investors: Depreciation is non-cash, so a rental often shows a tax loss while cash-flowing — sheltering income. Rental losses are passive: they offset passive income freely, and up to $25,000/yr can offset ordinary (W-2) income if you actively participate and your MAGI is under $100k (phasing out to $0 by $150k); unused losses carry forward. On sale, claimed depreciation is recaptured at up to 25%, and gains may owe capital-gains tax (a 1031 exchange can defer both). Figures are a year-1 estimate at your 24.0% rate — not tax advice; consult a CPA.
Condition & rehab AI · 12 photos
This well-maintained manufactured home is move-in ready with updated interiors and a good exterior. Minor cosmetic updates could further enhance its resale and rental value.
Value-add opportunities
- Resale Paint exterior — Enhances curb appeal
- Both Replace carpet — Improves comfort and appearance
- Both Install new windows — Enhances energy efficiency and view
Renovation cost estimate screening
Value-add ROI direction
- Resale Paint exterior — Enhances curb appeal ↑
- Both Replace carpet — Improves comfort and appearance ↑
- Both Install new windows — Enhances energy efficiency and view ↑
ⓘ Cost ranges are severity-bucket heuristics (US national rule-of-thumb). Get contractor quotes + a written scope before underwriting a rehab budget.
Schools (NCES district)
- District
- Richland School District
- NCES district ID
- 5307320
- Math proficiency
- 52% ▬ 0.00%
- Reading proficiency
- 64% ▼ -1.00%
- Median HH income
- $70,475
- Composite
- 53.04/100
- National rank
- #3244
- State rank
- #61 of 291 in WA
Livability — West Richland
- Score
- 71/100
- State rank
- #236
- US rank
- #7220
Category grades
Schools grade is shown separately in the Schools card above.
Census & demographics
- Census place
- West Richland, WA
- County
- Benton County · 186,895 people
- City population
- 19,251
- Metro
- Kennewick-Richland, WA
- Population (ZIP)
- 19,251
- Household income
- $121,845
- Rent vs Own
- Severe rent burden
- 254.0
Population outlook (Benton County) Hauer SSP2
- Today (2025)
- 219,421 people
- By 2030
- 233,813 · +6.6%
- By 2040
- 262,134 · +19.5%
- By 2050
- 290,100 · +32.2%
- By 2075
- 363,525 · +65.7%
- By 2100
- 418,667 · +90.8%
Race, ethnicity, and origin ACS 2023
- Neighborhood character
- Predominantly White (74%)
- Race & ethnicity
- White 74% Hispanic / Latino 15% Two or more races 15% Asian 2%
- Hispanic origin (detail)
- Mexican 13%
- Common ancestry
- Portuguese 4% Italian 4% Lithuanian 4%
- Foreign-born
- 7% · Canada, Vietnam, China
- Languages at home
- 87% English-only · Spanish 10% Other Asian/Pacific 1% Arabic 1%
Political lean MEDSL · Benton
- 2024 margin
- Strong R (+21.9) · D 37.7% · R 59.6% · Other 2.7%
- 2008→2024 swing
- +4.2pp toward D · 2008: -26.1pp · 2024: -21.9pp
- All cycles
- 2024: R+21.9 2020: R+21.0 2016: R+26.6 2012: R+27.0 2008: R+26.1
Not yet ingested
- Civics
- —
Market trends
- HPI YoY
- ▼ -218.63%
- Current HPI
- 239.5096
- Rent YoY
- —
- Metro
- Kennewick-Richland, WA
- State GDP YoY
- ▲ 4.65%
- F500 in state
- 22
Industry mix (Fortune 500 HQ in WA)
| Industry | F500 HQs | Revenue |
|---|---|---|
| Retail | 2 | $269B |
|
||
| Technology / Retail | 1 | $638B |
|
||
| Technology | 1 | $245B |
|
||
| Telecommunications | 1 | $38B |
|
||
| Food / Beverage | 1 | $36B |
|
||
| Automotive / Trucks | 1 | $34B |
|
||
Price history
+35.1% since first listed2 events — show timeline
- 2026-04-01 Listed $125,000 PACMLS
- 2019-11-27 Listed $92,500 PACMLS
Cash-flow waterfall
monthlySold comps — $/sqft
last 12 mo · ≤1 miLoading sold comps…