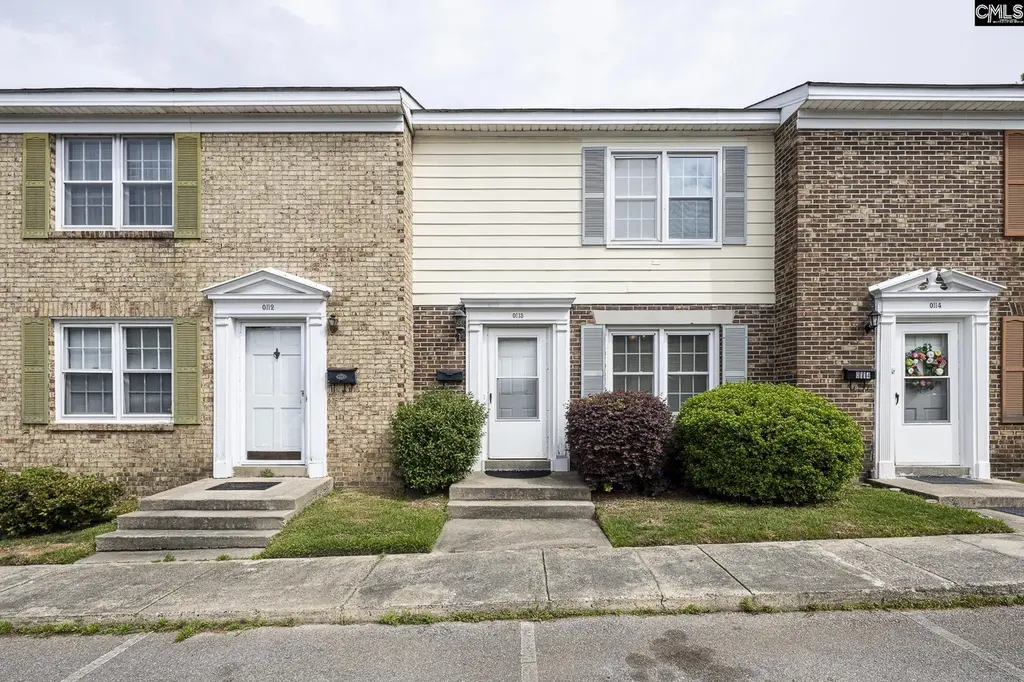
7602 Hunt Club Rd · Woodfield, SC
Flood risk 6/10 · Moderate
- FEMA flood zone
- X
- Chance of flooding over 30 yrs
- 0.99%
- Est. flood insurance / yr
- $435 – $905
Fire risk 2/10 · Minimal
- Est. fire insurance / yr
- $783 – $1,453
Heat risk 7/10 · Major
- Hot days now (above threshold)
- 7 days/yr
- Hot days in 30 yrs
- 16 days/yr
Wind risk No data
- Chance of severe wind over 30 yrs
- —
Air-quality risk No data
- Unhealthy air days now
- —
- Unhealthy air days in 30 yrs
- —
Risk factors via First Street. Map © Google.
Why this score? — see what drove the D grade
The composite is a weighted blend of 9 inputs, each scored 0–100. Each bar is that input's sub-score; the figure is the points it added to the 100-point composite (weight × sub-score).
- Cash flow +10.3/30.0
- 1% rule +8.2/10.0
- ARV discount +7.5/15.0
- Schools +3.6/10.0
- Livability +3.2/5.0
- DSCR +2.9/10.0
- Rent growth +2.6/5.0
- Condition / age +2.5/5.0
- Appreciation +0.0/10.0
$100,000
🖨 Deal sheet 📄 Offer letter ✓ Due diligence
Listing remarks
Easy living meets smart investing in this well-maintained 2-bedroom, 2.5-bath townhouse with approximately 1,200 square feet of comfortable, low-maintenance space. Located on Hunt Club Road just off Decker Blvd, this home features convenient access to shopping, dining, and everyday essentials, with easy connectivity to major roadways for a smooth commute into Columbia and surrounding areas. Enjoy a central location that keeps you close to everything while still providing a sense of neighborhood comfort. Inside, a welcoming dining area with tile flooring flows into a functional galley kitchen featuring a stylish tile backsplash, Formica countertops, bright white appliances, and ample cabinet
Key facts
- Private fenced patio
- Under-stair storage
- Laundry closet
Tags
Property features AI
Finance
- HOA & community: Community association in place; Association maintenance covers backyard, front yard and exterior maintenance, landscaping, common areas, road and street light maintenance, trash, water, sewer, pest control, and green areas
Exterior
- Parking: Two parking spaces
- Utilities: Public sewer; Public water
- Home design: Two-story property; Slab foundation; Paved road access; Public water
- Construction: Partial brick and vinyl exterior; Slab foundation
- Exterior features: Patio; Uncovered front porch; Uncovered back porch; Privacy wood fence in rear; Partial brick above foundation with vinyl siding
Interior
- Kitchen: Wood cabinets; Galley-style layout; Formica countertops; Tile floor; Tiled backsplash; Dishwasher; Over-the-range microwave; Free-standing smooth-surface range
- Bedrooms: Master bedroom on second floor with his-and-hers closets, private bath, tub/shower, built-ins, ceiling fan, carpeted floors; Second bedroom on second floor with his-and-hers closets, shared bath, tub/shower, built-ins, ceiling fan, carpeted floors
- Flooring: Carpet in bedrooms and living areas; Tile in formal dining and kitchen
- Bathrooms: Two full bathrooms; One partial bathroom; One half bathroom
- Heating & cooling: Central heating; Central cooling
- Interior features: Ceiling fans; Smoke detector; Molding
- Laundry & utility: Laundry closet on main level with electric hook-up in heated space
Neighborhood map
What this means for you Summary
Snapshot
- This is a 2-bed/2.0-bath townhouse listed at $100k.
Deal economics
- At list price, monthly cash flow is $-55 ($-664/yr) — negative.
- To cash-flow at today's rent, offer at most $90k (9.8% below list).
- Meets the 1% rule at list price ($1k rent vs $100k).
- Recommended offer: $90k (9.8% below list) — sets the bar for cash-flow.
Location & tenants
- Location reads 63/100 on livability (#165 in SC) — a middle-class / working-renter tenant base. Strengths: cost of living A+, housing A+; Watch: employment D+, crime D-, amenities F.
- Richland 02 (suburban): math 35% / reading 47% proficiency, ranked #29 of 80 in SC (top 36%) — families likely to look elsewhere, expect single-tenant / working-renter base with shorter leases.
- Zoned schools: Jackson Creek Elementary (math 26% / reading 24%, grade F, #447 of 597 statewide, top 76%, 545 students, 100% FRL) — zoned schools average 100% FRL vs 38% district-wide (62 pts higher); higher-poverty schools than district average — tighter screening recommended.
- Zoned-school proficiency averages 25% at this address vs 41% district-wide (-16 pts) — the specific schools serving this property underperform the Richland 02 average; the district grade overstates school quality for this exact location.
- Market conditions: Rents flat; 341 active listings in the ZIP; 27 comparable units currently listed for rent nearby; rentals at typical pace (median 24d on market — plan ~3-4 weeks tenant-placement turnaround); 3,472 units permitted in Richland County in 2024 (1,096 in 5+ unit buildings).
Forward outlook
- Local home prices are declining (-3.0%/yr); year-one equity from $691 of loan paydown is wiped out by about $3k of value loss. Plan a longer hold.
- Richland County population projected at +30% by 2050 — long-run rental-demand tailwind backs the buy-and-hold thesis.
Negotiation context
- It's been on market 25 days — a 2% lower offer ($98k) is reasonable based on typical stale-listing flexibility.
- 3 sale attempts since 4y ago with the ask held roughly flat each time — persistent listings suggest the price (not the market) is what's stuck; bring a comps-based counter.
Risks & watch-outs
- Watch-outs: property tax is 2.6% of price; HOA is 24% of rent.
- Climate carrying-cost: major flood risk; extreme-heat days projected 7→16/yr by 2055 (HVAC capex compounding) — expect insurance premiums to compound above CPI over the hold.
Questions for the listing agent
- What do current leases actually rent for vs. the listed asking? Can we see a recent rent roll and the last 12 months of T-12 income?
- Built in 1973 — when were the roof, HVAC, electrical panel, plumbing, and water heater last replaced?
- Property tax is high relative to price — has the assessment been appealed recently, and will the sale trigger a re-assessment?
- What does the HOA fee cover, when was the last increase, and are there any pending special assessments or reserve-fund shortfalls?
- Is there a deadline driving the sale (1031 exchange, divorce, estate, relocation)? That informs how much negotiation room exists.
- Schools are D-rated, which usually means shorter tenancies and higher turnover. Who's the typical renter profile here, and what's been the actual vacancy rate?
- Crime grade is D in this area — have there been break-ins, vandalism, or insurance claims at this property in the last 3 years? What carrier currently insures it and at what premium?
- The area grade is low — what's the realistic commute time and amenity access for the typical tenant pool here? Any planned neighborhood developments (good or bad) we should know about?
- What's the average days-on-market for RENTAL listings here right now (not sales)? A rising rental-DOM trend means longer vacancies and softer asking-rent achievability than the comps imply.
- What's the recent tenant-quality profile in this submarket — average credit score on applications, eviction rate, late-payment / NSF rate, and stable-employment percentage? A property-management company in the area should have these aggregated.
- How much new for-sale + rental construction is in the pipeline within 1–3 miles? Heavy new supply typically softens prices + rents 12–24 months out; constrained supply supports both.
Investment metrics
- 1% rule
- 1.32% ✓
- Cap rate
- 5.63%
- Cash-on-cash
- -2.37%
- DSCR
- 0.89
- GRM
- 6.3
CMA / ARV
No comps found within radius.
Projected returns pro-forma
-3.0% appreciation · 0.21% rent growth · sell at horizon
- IRR
- -25.2%
- Equity multiple
- 0.18×
- Total profit
- $-23,066
- Equity at exit
- $14,910
- IRR
- -46.4%
- Equity multiple
- -0.34×
- Total profit
- $-37,526
- Equity at exit
- $8,646
Cash invested: $28,000 (down + closing). Projections, not guarantees.
Landlord ↔ Tenant lean methodology
- Overall (STATE)
- 90 Strongly Landlord-Friendly
- State South Carolina
- 90 Strongly Landlord-Friendly · R+6
- County
- — inherits STATE
- City
- — inherits STATE
ZIP-level market 29223
- Rents YoY
- 0.2%
- Active inventory
- 341
- Price-to-rent
- 6.3×
Monthly cashflow live
- Estimated rent
- $1,321 high interval (Pro) →
- Mortgage (P&I)
- −$524
- Tax from tax record
- −$214 /mo · $2,566/yr
- Insurance
- −$42
- HOA
- −$319
- Vacancy / Maint / Mgmt
- −$277
- Net cashflow
- $-55
Break-even live
UW: 25.0% down · 7.5% · 30yr · 1.5% tax · 5.0% vac · 8.0% maint · 8.0% mgmt
Financing live
Cash to close
- Down payment
- $25,000
- Closing costs
- $3,000
- Reserves months
- —
- Total cash needed
- —
Loan-product check · same deal, 3 products live
Conventional
25% down · 7.5% · 30yr
- Down + closing
- —
- Monthly P&I
- —
- Monthly cashflow
- —
- DSCR
- —
- Eligible?
- —
Personal DTI + credit; lowest rate.
DSCR
20% down · 8.5% · 30yr
- Down + closing
- —
- Monthly P&I
- —
- Monthly cashflow
- —
- DSCR
- —
- Eligible?
- —
No personal income docs; deal must DSCR.
Hard money
10% down · 12.0% · 12mo
- Down + closing
- —
- Monthly P&I
- —
- Monthly cashflow
- —
- DSCR
- —
- Eligible?
- —
Short-term bridge; refi at stabilization.
Rent comps 27 comps
| Address | Beds | Baths | Sqft | Rent | $/sqft | DOM | Units | Dist |
|---|---|---|---|---|---|---|---|---|
| 7602 Hunt Club Rd Columbia, SC | 1.0–2.0 | 1.0–2.5 | 950 | $1,295 | $1.36 | 23d | 2 | 0.04mi |
| 7602 Hunt Club Rd Unit I-104 Columbia, SC | 2.0 | 2.5 | 1200 | $1,295 | $1.08 | 19d | 1 | 0.07mi |
| 300 Meredith Sq Columbia, SC | 2.0–3.0 | 2.0–2.5 | 1258 | $1,299 | $1.03 | 23d | 1 | 0.17mi |
| 7502 Hunt Club Rd Columbia, SC | 1.0–2.0 | 1.0–2.0 | 825 | $1,305 | $1.58 | 3d | 22 | 0.21mi |
| 7502 Hunt Club Rd Columbia, SC | 1.0–3.0 | 1.0–2.0 | 875 | $1,292 | $1.48 | 23d | 1 | 0.21mi |
| 7501 Brookfield Rd Columbia, SC | 1.0–3.0 | 1.0–2.5 | 1097 | $1,074 | $0.98 | 23d | 1 | 0.29mi |
| 7400 Hunt Club Rd Columbia, SC | 1.0–3.0 | 1.0–2.0 | 1087 | $1,040 | $0.96 | 23d | 1 | 0.43mi |
| 7006 Brookfield Rd Columbia, SC | 1.0–3.0 | 1.0–2.0 | 1090 | $1,122 | $1.03 | 11d | 7 | 0.59mi |
| 8720 Windsor Lake Blvd Columbia, SC | 1.0–3.0 | 1.0–2.0 | 967 | $1,182 | $1.22 | 23d | 15 | 0.61mi |
| 229 Windsor Point Rd Unit 3H Columbia, SC | 2.0 | 2.0 | 1000 | $1,243 | $1.24 | 23d | 1 | 0.70mi |
| 229 Windsor Point Rd Unit 3H Columbia, SC | 2.0 | 2.0 | 1000 | $1,243 | $1.24 | 2d | 1 | 0.70mi |
| 1630 Edgemore Rd Unit 1 Columbia, SC | 3.0 | 2.0 | 1225 | $1,650 | $1.35 | 23d | 1 | 0.70mi |
| 2102 Long Shadow Ln Columbia, SC | 2.0 | 1.5 | 1150 | $1,300 | $1.13 | 3d | 1 | 0.72mi |
| 2919 Chatsworth Rd Columbia, SC | 2.0 | 1.0 | 975 | $1,300 | $1.33 | 23d | 1 | 0.77mi |
| 2920 Chatsworth Rd Unit A Columbia, SC | 2.0 | 2.0 | 980 | $1,100 | $1.12 | 3d | 1 | 0.80mi |
| 2920 Chatsworth Rd Apt C Columbia, SC | 2.0 | 2.0 | 980 | $1,100 | $1.12 | 23d | 1 | 0.80mi |
| 6905 Cleaton Rd Columbia, SC | 3.0 | 2.5–3.0 | 1546 | $1,925 | $1.25 | 23d | 3 | 0.84mi |
| 1310 Oakcrest Dr Columbia, SC | 1.0–3.0 | 1.0–2.0 | 1110 | $1,598 | $1.44 | 3d | 27 | 0.92mi |
| 1930 Greenoaks Rd Unit A Columbia, SC | 2.0 | 1.5 | 900 | $1,175 | $1.31 | 11d | 1 | 0.92mi |
| 1633 Overhill Rd Columbia, SC | 3.0 | 1.5 | 1052 | $1,661 | $1.58 | 23d | 1 | 0.97mi |
| 1000 Windsor Shores Dr Columbia, SC | 1.0–3.0 | 1.0–2.0 | 1011 | $1,390 | $1.37 | 23d | 1 | 1.02mi |
| 1725 Cheltenham Ln Columbia, SC | 3.0 | 2.0 | 1444 | $1,675 | $1.16 | 23d | 1 | 1.13mi |
| 6837 N Trenholm Rd Columbia, SC | 1.0–3.0 | 1.0–2.0 | 1105 | $1,662 | $1.50 | 3d | 30 | 1.15mi |
| 3611 Ranch Rd Columbia, SC | 2.0–3.0 | 2.0 | 1400 | $1,250 | $0.89 | 3d | 3 | 1.23mi |
| 3630 Ranch Rd Unit 3-8 Columbia, SC | 2.0 | 2.0 | 1400 | $1,250 | $0.89 | 23d | 1 | 1.34mi |
| 1718 Horseshoe Dr Apt B Columbia, SC | 2.0 | 1.5 | 1050 | $1,300 | $1.24 | 11d | 1 | 1.37mi |
| 1682 Horseshoe Dr Unit D Columbia, SC | 2.0 | 2.0 | 1000 | $895 | $0.90 | 14d | 1 | 1.46mi |
HOA detail
- Monthly dues
- $319 · $3,828/yr
Listing history 12 events
-
2026-05-12status Pending
-
2026-04-27historical Active - Contingent
-
2026-04-17$100,000 Active
-
2023-10-26historical $1,000
-
2023-10-22$1,000
-
2022-03-29soldstatus $87,000
-
2022-02-15historical
-
2022-02-09$78,500 Active
-
2000-08-07soldstatus $61,554
-
1993-06-23soldstatus $51,230
-
1993-04-20soldstatus $51,900
-
1984-11-01soldstatus $46,500
ⓘ Source: listings_history table (triggers on properties + properties_extension) + one-shot
backfill from property_details.listing_events for pre-trigger history.
Tax reassessment forecast SC · Resets to sale price
- Current annual tax
- $2,566 · $214/mo
- Projected year-2 tax
- $2,566 · $214/mo
- Expected delta
- $0/yr ($0/mo · 0.0%)
ⓘ Screening estimate from a state-policy table — verify with the county assessor before closing.
Climate risk First Street
- Flood 6/10 Major FEMA zone X · 99% chance over 30 yrs
- Wildfire 2/10 Low
- Heat 7/10 Severe
Nearby sold comps map
Loading sold comps map…
Walkable amenities ~0.75 mi
Loading nearby amenities…
Taxation est. · year 1
- Rental income
- $15,852
- − Mortgage interest
- −$5,602
- − Property taxes
- −$2,566
- − Insurance
- −$500
- − Repairs & maintenance
- −$1,268
- − Management
- −$1,268
- − HOA
- −$3,828
- − Depreciation
- −$2,909
- Taxable loss
- −$2,089
- Est. tax savings @ 24.0%
- +$501
- After-tax cash flow
- $-163/yr
For passive investors: Depreciation is non-cash, so a rental often shows a tax loss while cash-flowing — sheltering income. Rental losses are passive: they offset passive income freely, and up to $25,000/yr can offset ordinary (W-2) income if you actively participate and your MAGI is under $100k (phasing out to $0 by $150k); unused losses carry forward. On sale, claimed depreciation is recaptured at up to 25%, and gains may owe capital-gains tax (a 1031 exchange can defer both). Figures are a year-1 estimate at your 24.0% rate — not tax advice; consult a CPA.
Schools (NCES district)
- District
- Richland 02
- NCES district ID
- 4503390
- Math proficiency
- 35% ▼ -15.00%
- Reading proficiency
- 47% ▼ -5.00%
- Median HH income
- $59,684
- Composite
- 36.2/100
- National rank
- #4730
- State rank
- #29 of 80 in SC
Livability — Woodfield
- Score
- 63/100
- State rank
- #165
- US rank
- #15019
Category grades
Schools grade is shown separately in the Schools card above.
Census & demographics
- Census place
- Woodfield, SC
- County
- Richland County · 389,530 people
- Metro
- Columbia, SC
- Population (ZIP)
- 53,074
- Household income
- $62,408
- Rent vs Own
- Severe rent burden
- 2857.0
Population outlook (Richland County) Hauer SSP2
- Today (2025)
- 459,667 people
- By 2030
- 487,524 · +6.1%
- By 2040
- 542,035 · +17.9%
- By 2050
- 595,371 · +29.5%
- By 2075
- 732,998 · +59.5%
- By 2100
- 820,415 · +78.5%
Race, ethnicity, and origin ACS 2023
- Neighborhood character
- Diverse neighborhood (Simpson 0.60)
- Race & ethnicity
- Black 57% White 23% Hispanic / Latino 11% Two or more races 6% Asian 4%
- Hispanic origin (detail)
- Mexican 5% Puerto Rican 2%
- Common ancestry
- Slovak 1% Serbian 1% Italian 1%
- Foreign-born
- 10% · Canada, South Korea
- Languages at home
- 86% English-only · Spanish 8% Other Indo-European 2% Korean 1%
Political lean MEDSL · Richland
- 2024 margin
- Solid D (+34.6) · D 66.4% · R 31.8% · Other 1.8%
- 2008→2024 swing
- +5.7pp toward D · 2008: 28.9pp · 2024: 34.6pp
- All cycles
- 2024: D+34.6 2020: D+38.3 2016: D+32.9 2012: D+33.3 2008: D+28.9
Not yet ingested
- Civics
- —
Market trends
- HPI YoY
- ▼ -135.96%
- Current HPI
- 195.3158
- Rent YoY
- ▲ 0.21%
- Metro
- Columbia, SC
- State GDP YoY
- ▲ 4.51%
- F500 in state
- 2
Industry mix (Fortune 500 HQ in SC)
| Industry | F500 HQs | Revenue |
|---|---|---|
| Packaging | 1 | $7B |
|
||
Price history
+115.1% since first listed12 events — show timeline
- 2026-05-12 Pending — Consolidated MLS
- 2026-04-27 Contingent — Consolidated MLS
- 2026-04-17 Listed $100,000 Consolidated MLS
- 2023-10-26 Rental Removed $1,000 LISTANZA
- 2023-10-22 Listed for Rent $1,000 LISTANZA
- 2022-03-29 Sold (Public Records) $87,000 Public Records
- 2022-02-15 Delisted — Consolidated MLS
- 2022-02-09 Listed $78,500 Consolidated MLS
- 2000-08-07 Sold (Public Records) $61,554 Public Records
- 1993-06-23 Sold (Public Records) $51,230 Public Records
- 1993-04-20 Sold (Public Records) $51,900 Public Records
- 1984-11-01 Sold (Public Records) $46,500 Public Records
Property tax history
+3.2%/yrLatest (2025): $2,566 · +296.6% YoY. Source: county tax records.
Cash-flow waterfall
monthlySold comps — $/sqft
last 12 mo · ≤1 miLoading sold comps…