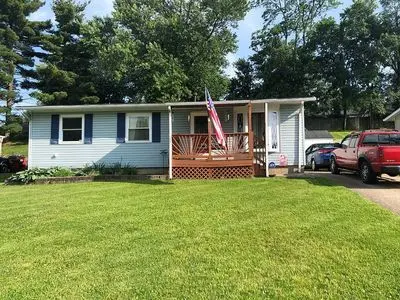
3373 Tulip Tree Dr · Erlanger, KY
Flood risk 5/10 · Moderate
- FEMA flood zone
- X (unshaded)
- Chance of flooding over 30 yrs
- 0.27%
- Est. flood insurance / yr
- $507 – $1,088
Fire risk 1/10 · Minimal
- Est. fire insurance / yr
- $839 – $1,559
Heat risk 4/10 · Minor
- Hot days now (above 101°F)
- 7 days/yr
- Hot days in 30 yrs
- 19 days/yr
Wind risk 2/10 · Minimal
- Chance of severe wind over 30 yrs
- 1.0%
Air-quality risk 2/10 · Minimal
- Unhealthy air days now
- 1 days/yr
- Unhealthy air days in 30 yrs
- 3 days/yr
Risk factors via First Street. Map © Google.
Why this score? — see what drove the D+ grade
The composite is a weighted blend of 9 inputs, each scored 0–100. Each bar is that input's sub-score; the figure is the points it added to the 100-point composite (weight × sub-score).
- Cash flow +12.9/30.0
- ARV discount +12.6/15.0
- Schools +4.1/10.0
- DSCR +3.9/10.0
- Rent growth +3.6/5.0
- Livability +3.6/5.0
- 1% rule +2.8/10.0
- Condition / age +2.5/5.0
- Appreciation +0.0/10.0
$195,000
🖨 Deal sheet 📄 Offer letter ✓ Due diligence
Listing remarks MLS
Nothing to do but Move In and enjoy this darling 3 bedroom home - New stainless steel appliances,laminate floors in kitchen and living room. New carpet in bedrooms and New vanity in bathroom. Fresh neutral paint throughout this home. Fenced yard with shed. Roof replaced last year. Convenient to Interstate and Shopping. ADT Security system.
Key facts
- Built in microwave
- Hot water heater
- Cul-de-sac
Tags
Neighborhood map
What this means for you Summary
Snapshot
- This is a 3-bed/1.0-bath single-family listed at $195k.
Deal economics
- At list price, monthly cash flow is $-15 ($-179/yr) — negative.
- To cash-flow at today's rent, offer at most $192k (1.4% below list).
- To meet the 1% rule (rent ≥ 1% of price), the offer needs to be $152k (22.1% below list).
- Recommended offer: $152k (22.1% below list) — sets the bar for 1% rule.
- Cap rate 6.2% vs local median 3.8% in Erlanger — top-decile yield for the area; either an underpriced asset or a hidden risk that comps aren't pricing in. Stress-test before assuming the spread holds.
Location & tenants
- Location reads 72/100 on livability (#126 in KY) — a middle-class / working-renter tenant base. Strengths: crime A+, cost of living A+, housing A+; Watch: schools F, amenities F, commute F.
- Boone County (suburban): math 43% / reading 49% proficiency, ranked #12 of 165 in KY (top 7%) — families likely to look elsewhere, expect single-tenant / working-renter base with shorter leases.
- Market conditions: Rents rising fast (+4.2%/yr); 122 active listings in the ZIP; 12 comparable units currently listed for rent nearby; rentals at typical pace (median 15d on market — plan ~3-4 weeks tenant-placement turnaround); 1,430 units permitted in Boone County in 2024 (928 in 5+ unit buildings).
Forward outlook
- Local home prices are declining (-3.0%/yr); year-one equity from $1k of loan paydown is wiped out by about $6k of value loss. Plan a longer hold.
- Boone County population projected at +24% by 2050 — long-run rental-demand tailwind backs the buy-and-hold thesis.
Negotiation context
- It's been on market 24 days — a 2% lower offer ($192k) is reasonable based on typical stale-listing flexibility.
- 3 sale attempts since 9y ago with the ask held roughly flat each time — persistent listings suggest the price (not the market) is what's stuck; bring a comps-based counter.
- Current owner paid $112k; list at $195k implies a 74% gain — meaningful room to come down on a strong offer.
Risks & watch-outs
- Climate carrying-cost: moderate flood risk — expect insurance premiums to compound above CPI over the hold.
Questions for the listing agent
- What do current leases actually rent for vs. the listed asking? Can we see a recent rent roll and the last 12 months of T-12 income?
- Built in 1972 — when were the roof, HVAC, electrical panel, plumbing, and water heater last replaced?
- Is there a deadline driving the sale (1031 exchange, divorce, estate, relocation)? That informs how much negotiation room exists.
- Schools are F-rated, which usually means shorter tenancies and higher turnover. Who's the typical renter profile here, and what's been the actual vacancy rate?
- The area grade is low — what's the realistic commute time and amenity access for the typical tenant pool here? Any planned neighborhood developments (good or bad) we should know about?
- What's the average days-on-market for RENTAL listings here right now (not sales)? A rising rental-DOM trend means longer vacancies and softer asking-rent achievability than the comps imply.
- What's the recent tenant-quality profile in this submarket — average credit score on applications, eviction rate, late-payment / NSF rate, and stable-employment percentage? A property-management company in the area should have these aggregated.
- How much new for-sale + rental construction is in the pipeline within 1–3 miles? Heavy new supply typically softens prices + rents 12–24 months out; constrained supply supports both.
Investment metrics
- 1% rule
- 0.78% ✗
- Cap rate
- 6.20%
- Cash-on-cash
- -0.33%
- DSCR
- 0.99
- GRM
- 10.7
CMA / ARV
- ARV (on-the-fly)
- $219,792
- Comps found
- 12
Show comp detail 12 sales within ~0.75 mi
| Address | Dist | Beds/Ba | Sqft | Sold | Price | $/sf | Match |
|---|---|---|---|---|---|---|---|
| 3375 Fir Tree Ln | 0.06mi | 3/1.0 | 936 (+3%) | 5mo | $194,400 | $208 | 89 |
| 3374 Pine Tree Ln | 0.14mi | 3/1.0 | 936 (+3%) | 2mo | $128,200 | $137 | 88 |
| 3331 Fir Tree Ln | 0.25mi | 3/1.5 | 927 (+2%) | 1mo | $242,000 | $261 | 82 |
| 3351 Sycamore Tree Ln | 0.17mi | 3/2.0 | 936 (+3%) | 3mo | $195,000 | $208 | 82 |
| 3415 Cedar Tree Ln | 0.20mi | 3/1.0 | 864 (-5%) | 7mo | $203,000 | $235 | 77 |
| 3377 Fir Tree Ln | 0.07mi | 2/1.0 (-1) | 864 (-5%) | 19mo | $208,500 | $241 | 67 |
| 3413 Spruce Tree Ln | 0.15mi | 3/2.0 | 988 (+8%) | 11mo | $265,000 | $268 | 66 |
| 3386 Spruce Tree Ln | 0.10mi | 3/2.5 | 1,048 (+15%) | 7mo | $266,000 | $254 | 59 |
| 691 Maple Tree Ln | 0.40mi | 3/1.5 | 988 (+8%) | 9mo | $220,000 | $223 | 58 |
| 695 Maple Tree Ln | 0.39mi | 3/1.5 | 988 (+8%) | 10mo | $262,400 | $266 | 57 |
| 3354 Spruce Tree Ln | 0.25mi | 3/2.0 | 996 (+9%) | 18mo | $240,000 | $241 | 54 |
| 3425 Cherry Tree Ln | 0.48mi | 4/2.0 (+1) | 999 (+10%) | 18mo | $270,000 | $270 | 37 |
Match score weights: distance 35% · size 25% · config 20% · recency 20%. Top-matched comps best support the ARV.
Projected returns pro-forma
-3.0% appreciation · 4.22% rent growth · sell at horizon
- IRR
- -15.7%
- Equity multiple
- 0.44×
- Total profit
- $-30,720
- Equity at exit
- $29,075
- IRR
- -5.5%
- Equity multiple
- 0.63×
- Total profit
- $-20,273
- Equity at exit
- $16,860
Cash invested: $54,600 (down + closing). Projections, not guarantees.
Landlord ↔ Tenant lean methodology
- Overall (STATE)
- 83 Strongly Landlord-Friendly
- State Kentucky
- 83 Strongly Landlord-Friendly · R+16
- County
- — inherits STATE
- City
- — inherits STATE
ZIP-level market 41018
- Rents YoY
- 4.2%
- Active inventory
- 122
- Price-to-rent
- 10.7×
Monthly cashflow live
- Estimated rent
- $1,519 high interval (Pro) →
- Mortgage (P&I)
- −$1,023
- Tax from tax record
- −$111 /mo · $1,332/yr
- Insurance
- −$81
- HOA
- −$0
- Vacancy / Maint / Mgmt
- −$319
- Net cashflow
- $-15
Break-even live
UW: 25.0% down · 7.5% · 30yr · 1.5% tax · 5.0% vac · 8.0% maint · 8.0% mgmt
Financing live
Cash to close
- Down payment
- $48,750
- Closing costs
- $5,850
- Reserves months
- —
- Total cash needed
- —
Loan-product check · same deal, 3 products live
Conventional
25% down · 7.5% · 30yr
- Down + closing
- —
- Monthly P&I
- —
- Monthly cashflow
- —
- DSCR
- —
- Eligible?
- —
Personal DTI + credit; lowest rate.
DSCR
20% down · 8.5% · 30yr
- Down + closing
- —
- Monthly P&I
- —
- Monthly cashflow
- —
- DSCR
- —
- Eligible?
- —
No personal income docs; deal must DSCR.
Hard money
10% down · 12.0% · 12mo
- Down + closing
- —
- Monthly P&I
- —
- Monthly cashflow
- —
- DSCR
- —
- Eligible?
- —
Short-term bridge; refi at stabilization.
Rent comps 12 comps
| Address | Beds | Baths | Sqft | Rent | $/sqft | DOM | Units | Dist |
|---|---|---|---|---|---|---|---|---|
| 3401 Queensway Dr Erlanger, KY | 2.0 | 1.5 | 860 | $1,150 | $1.34 | 2d | 4 | 0.37mi |
| 3234 N Talbot Ave Unit 3234-5 Erlanger, KY | 2.0 | 1.5 | 883 | $1,475 | $1.67 | 14d | 1 | 0.84mi |
| 580 Erlanger Rd Unit 580-5 Erlanger, KY | 2.0 | 1.5 | 883 | $1,475 | $1.67 | 43d | 1 | 0.84mi |
| 3235 N Talbot Ave Unit 3235-2 Erlanger, KY | 3.0 | 1.5 | 1032 | $1,675 | $1.62 | 16d | 1 | 0.88mi |
| 3231 N Talbot Ave Unit 3231-5 Erlanger, KY | 2.0 | 1.5 | 883 | $1,475 | $1.67 | 23d | 1 | 0.88mi |
| 3223 N Talbot Ave Unit 3223-7 Erlanger, KY | 2.0 | 1.5 | 883 | $1,475 | $1.67 | 21d | 1 | 0.89mi |
| 3219 N Talbot Ave Unit 3219-4 Erlanger, KY | 2.0 | 1.5 | 883 | $1,475 | $1.67 | 43d | 1 | 0.91mi |
| 535 Greenfield Ln Erlanger, KY | 2.0 | 1.0 | 756 | $1,300 | $1.72 | 1d | 5 | 0.99mi |
| 3422 Cintonya Dr Erlanger, KY | 1.0–2.0 | 1.0 | 625 | $1,359 | $2.17 | 1d | 8 | 1.00mi |
| 3341 Mineola Pike Erlanger, KY | 1.0–2.0 | 1.0–2.0 | 945 | $2,100 | $2.22 | 1d | 98 | 1.03mi |
| 3904 Lori Dr Erlanger, KY | 1.0–2.0 | 1.0–1.5 | 722 | $1,335 | $1.85 | 1d | 12 | 1.21mi |
| 4787 Houston Rd Florence, KY | 1.0–3.0 | 1.0–2.0 | 1025 | $2,316 | $2.26 | 1d | 25 | 1.26mi |
Listing history 21 events
-
2026-06-18days on market $195,000 Active 24 DOM
-
2026-06-17days on market $195,000 Active 23 DOM
-
2026-06-16days on market $195,000 Active 22 DOM
-
2026-06-15days on market $195,000 Active 21 DOM
-
2026-06-13days on market $195,000 Active 19 DOM
-
2026-06-09days on market $195,000 Active 15 DOM
-
2026-06-08days on market $195,000 Active 14 DOM
-
2026-06-07days on market $195,000 Active 13 DOM
-
2026-06-05days on market $195,000 Active 10 DOM
-
2026-06-03days on market $195,000 Active 9 DOM
-
2026-06-02days on market $195,000 Active 8 DOM
-
2026-06-01days on market $195,000 Active 7 DOM
-
2026-05-31days on market $195,000 Active 6 DOM
-
2026-05-25$195,000 Active
-
2018-06-18soldstatus $112,000
-
2018-05-29soldstatus $112,000 346-char remark
Show marketing remark (346 chars)
Nothing to do but Move In and enjoy this darling 3 bedroom home - New stainless steel appliances,laminate floors in kitchen and living room. New carpet in bedrooms and New vanity in bathroom. Fresh neutral paint throughout this home. Fenced yard with shed. Roof replaced last year. Convenient to Interstate and Shopping. ADT Security system.
-
2018-03-02$112,000 346-char remark
Show marketing remark (346 chars)
Nothing to do but Move In and enjoy this darling 3 bedroom home - New stainless steel appliances,laminate floors in kitchen and living room. New carpet in bedrooms and New vanity in bathroom. Fresh neutral paint throughout this home. Fenced yard with shed. Roof replaced last year. Convenient to Interstate and Shopping. ADT Security system.
-
2017-08-25soldstatus $101,000
-
2017-06-19soldstatus $55,000
-
2017-06-14soldstatus $55,000 38-char remark
Show marketing remark (38 chars)
Great investment property in Erlanger!
-
2017-03-03$62,500 38-char remark
Show marketing remark (38 chars)
Great investment property in Erlanger!
ⓘ Source: listings_history table (triggers on properties + properties_extension) + one-shot
backfill from property_details.listing_events for pre-trigger history.
Tax reassessment forecast KY · Resets to sale price
- Current annual tax
- $1,332 · $111/mo
- Projected year-2 tax
- $1,677 · $140/mo
- Expected delta
- +$345/yr (+$29/mo · 25.9%)
ⓘ Screening estimate from a state-policy table — verify with the county assessor before closing.
Climate risk First Street
- Flood 5/10 Major FEMA zone X (unshaded) · 27% chance over 30 yrs
- Wildfire 1/10 Low
- Heat 4/10 Moderate 7 d/yr ≥101°F today · 19 d/yr by 30 yrs out
- Wind 2/10 Low 100% chance of damaging wind over 30 yrs
- Air quality 2/10 Low 1 unhealthy d/yr today · 3 by 30 yrs out
Nearby sold comps map
Loading sold comps map…
Walkable amenities ~0.75 mi
Loading nearby amenities…
Taxation est. · year 1
- Rental income
- $18,227
- − Mortgage interest
- −$10,923
- − Property taxes
- −$1,332
- − Insurance
- −$975
- − Repairs & maintenance
- −$1,458
- − Management
- −$1,458
- − Depreciation
- −$5,673
- Taxable loss
- −$3,592
- Est. tax savings @ 24.0%
- +$862
- After-tax cash flow
- $683/yr
For passive investors: Depreciation is non-cash, so a rental often shows a tax loss while cash-flowing — sheltering income. Rental losses are passive: they offset passive income freely, and up to $25,000/yr can offset ordinary (W-2) income if you actively participate and your MAGI is under $100k (phasing out to $0 by $150k); unused losses carry forward. On sale, claimed depreciation is recaptured at up to 25%, and gains may owe capital-gains tax (a 1031 exchange can defer both). Figures are a year-1 estimate at your 24.0% rate — not tax advice; consult a CPA.
Schools (NCES district)
- District
- Boone County
- NCES district ID
- 2100510
- Math proficiency
- 43% ▼ -10.00%
- Reading proficiency
- 49% ▼ -12.00%
- Median HH income
- $68,096
- Composite
- 41.18/100
- National rank
- #3550
- State rank
- #12 of 165 in KY
Livability — Erlanger
- Score
- 72/100
- State rank
- #126
- US rank
- #5933
Category grades
Schools grade is shown separately in the Schools card above.
Census & demographics
- County
- Kenton County · 142,881 people
- City population
- 28,940
- Metro
- Cincinnati, OH-KY-IN
- Population (ZIP)
- 28,940
- Household income
- $68,605
- Rent vs Own
- Severe rent burden
- 678.0
Population outlook (Boone County) Hauer SSP2
- Today (2025)
- 144,066 people
- By 2030
- 152,005 · +5.5%
- By 2040
- 166,776 · +15.8%
- By 2050
- 178,974 · +24.2%
- By 2075
- 204,515 · +42.0%
- By 2100
- 215,306 · +49.4%
Race, ethnicity, and origin ACS 2023
- Neighborhood character
- Predominantly White (83%)
- Race & ethnicity
- White 83% Two or more races 7% Hispanic / Latino 5% Black 5% Asian 1%
- Hispanic origin (detail)
- Mexican 3%
- Common ancestry
- Slovak 3% Italian 2% Lithuanian 1%
- Foreign-born
- 4% · Canada, Vietnam
- Languages at home
- 94% English-only · Spanish 4%
Political lean MEDSL · Boone
- 2024 margin
- Solid R (+37.2) · D 30.6% · R 67.8% · Other 1.7%
- 2008→2024 swing
- -2.7pp toward R · 2008: -34.5pp · 2024: -37.2pp
- All cycles
- 2024: R+37.2 2020: R+35.7 2016: R+41.8 2012: R+38.7 2008: R+34.5
Not yet ingested
- Civics
- —
Market trends
- HPI YoY
- ▼ -211.57%
- Current HPI
- 215.9599
- Rent YoY
- ▲ 4.22%
- Metro
- Cincinnati, OH-KY-IN
- State GDP YoY
- ▲ 1.81%
- F500 in state
- 4
Industry mix (Fortune 500 HQ in KY)
| Industry | F500 HQs | Revenue |
|---|---|---|
| Healthcare | 1 | $118B |
|
||
| Food / Beverage | 1 | $7B |
|
||
Price history
+212.0% since first listed8 events — show timeline
- 2026-05-25 Listed $195,000 FSBO.com
- 2018-06-18 Sold (Public Records) $112,000 Public Records
- 2018-05-29 Sold (MLS) $112,000 NKMLS
- 2018-03-02 Listed $112,000 NKMLS
- 2017-08-25 Sold (Public Records) $101,000 Public Records
- 2017-06-19 Sold (Public Records) $55,000 Public Records
- 2017-06-14 Sold (MLS) $55,000 NKMLS
- 2017-03-03 Listed $62,500 NKMLS
Property tax history
+10.2%/yrLatest (2025): $1,332 · +1.6% YoY. Source: county tax records.
Cash-flow waterfall
monthlySold comps — $/sqft
last 12 mo · ≤1 miLoading sold comps…