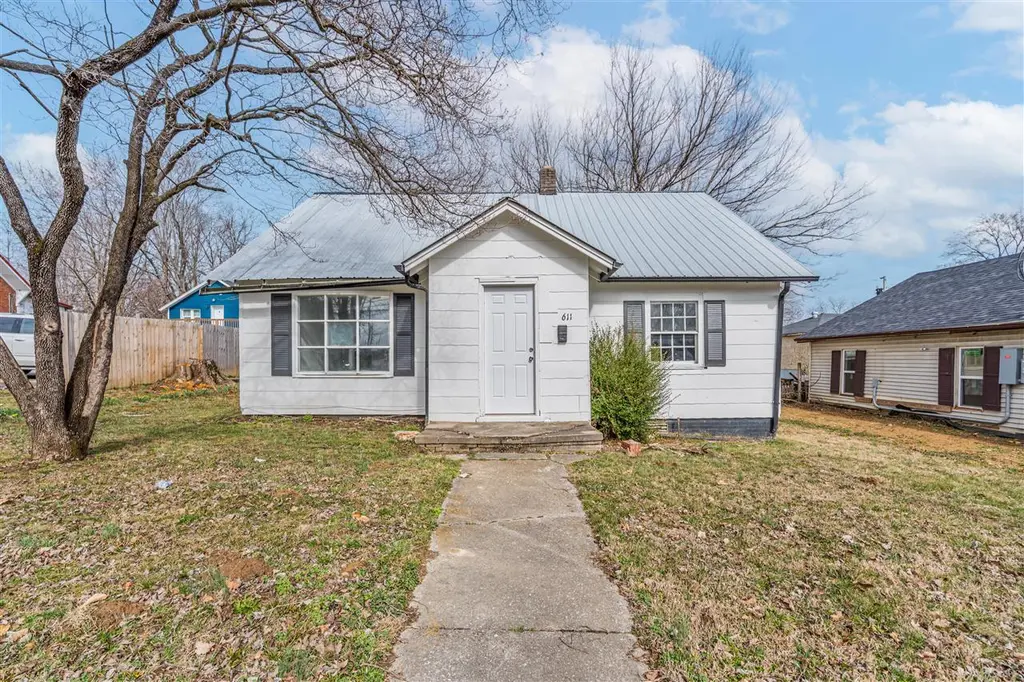
611 E Main St · Glasgow, KY
Flood risk 1/10 · Minimal
- FEMA flood zone
- X (unshaded)
- Chance of flooding over 30 yrs
- 0.0%
- Est. flood insurance / yr
- $507 – $1,088
Fire risk 1/10 · Minimal
- Est. fire insurance / yr
- $839 – $1,559
Heat risk 5/10 · Moderate
- Hot days now (above 107°F)
- 7 days/yr
- Hot days in 30 yrs
- 19 days/yr
Wind risk 3/10 · Minor
- Chance of severe wind over 30 yrs
- 5.0%
Air-quality risk 2/10 · Minimal
- Unhealthy air days now
- 0 days/yr
- Unhealthy air days in 30 yrs
- 2 days/yr
Risk factors via First Street. Map © Google.
Why this score? — see what drove the C+ grade
The composite is a weighted blend of 9 inputs, each scored 0–100. Each bar is that input's sub-score; the figure is the points it added to the 100-point composite (weight × sub-score).
- Cash flow +25.5/30.0
- ARV discount +11.5/15.0
- DSCR +8.5/10.0
- 1% rule +5.4/10.0
- Livability +3.8/5.0
- Schools +2.9/10.0
- Rent growth +2.5/5.0
- Condition / age +2.5/5.0
- Appreciation +0.0/10.0
$124,900
🖨 Deal sheet 📄 Offer letter ✓ Due diligence
Listing remarks
This 3-bedroom, 1-bath home in the heart of downtown Glasgow offers plenty of space and potential, including a large bonus room upstairs that could serve as a 4th bedroom, office, or flex space. Conveniently located just 0.1 miles from Gorin Park, less than a mile from the downtown square, and only minutes from local shopping and dining. With its location and layout, this property also offers strong rental and investment potential. This home also qualifies for our Lease with Option to Purchase program, making it a great opportunity for buyers working on credit or looking for alternative financing options. Parking available behind the home. Property is being sold as is, but seller is open to
Key facts
- Rental potential
- Large bonus room
- Parking available
Tags
Property features AI
Exterior
- Security: Smoke detector(s)
- Utilities: Public water; Public sewer
- Home design: Single-family residential property
- Construction: Masonite exterior
- Exterior features: Metal roof; Lot approximately 0.16 acres; Subdivision: T L Humble
Interior
- Kitchen: Eat-in layout
- Flooring: Vinyl flooring
- Bathrooms: 1 full bathroom (main level)
- Heating & cooling: Natural gas heating; Window unit(s) for cooling
- Interior features: Eat-in kitchen; Electric water heater
- Laundry & utility: Laundry room
Neighborhood map
What this means for you Summary
Snapshot
- This is a 3-bed/1.0-bath single-family listed at $125k.
Deal economics
- At list price, monthly cash flow is $292 ($4k/yr) — positive.
- The deal already cash-flows at list — no discount required.
- Meets the 1% rule at list price ($1k rent vs $125k).
- Recommended offer: $121k (3.0% below list) — sets the bar for market timing.
- Cap rate 9.1% vs local median 3.3% in Glasgow — top-decile yield for the area; either an underpriced asset or a hidden risk that comps aren't pricing in. Stress-test before assuming the spread holds.
Location & tenants
- Location reads 76/100 on livability (#92 in KY, #3,738 nationally) — a middle-class / working-renter tenant base. Strengths: cost of living A+, housing A+, health & safety A+; Watch: amenities F, commute F, employment F.
- Glasgow Independent (town): math 32% / reading 40% proficiency, ranked #69 of 165 in KY (top 42%) — families likely to look elsewhere, expect single-tenant / working-renter base with shorter leases.
- Zoned schools: Highland Elementary School (math 35% / reading 37%, grade F, #287 of 676 statewide, top 43%, 740 students, 63% FRL); Glasgow Middle School (math 29% / reading 43%, grade F, #91 of 217 statewide, top 43%, 539 students, 61% FRL); Glasgow High School (math 42% / reading 47%, grade F, #21 of 254 statewide, top 10%, 589 students, 53% FRL).
- Market conditions: 293 active listings in the ZIP; 1 comparable units currently listed for rent nearby; 283 units permitted in Barren County in 2024 (64 in 5+ unit buildings).
Forward outlook
- Local home prices are declining (-3.0%/yr); year-one equity from $864 of loan paydown is wiped out by about $4k of value loss. Plan a longer hold.
- Barren County population projected at +13% by 2050 — modest demand growth; plan on rents tracking national, not racing it.
Negotiation context
- It's been on market 38 days — a 3% lower offer ($121k) is reasonable based on typical stale-listing flexibility.
- 7 sale attempts with the ask held roughly flat each time — persistent listings suggest the price (not the market) is what's stuck; bring a comps-based counter.
- Current owner paid $39k; list at $125k implies a 220% gain — meaningful room to come down on a strong offer.
Risks & watch-outs
- Watch-outs: built in 1950 — expect roof / HVAC / electrical / plumbing capex.
- Climate carrying-cost: extreme-heat days projected 7→19/yr by 2055 (HVAC capex compounding) — expect insurance premiums to compound above CPI over the hold.
Questions for the listing agent
- It's been on market 38 days. Have you received any prior offers? Is the seller open to a 3% concession, seller financing, or rate buy-down credit?
- Built in 1950 — when were the roof, HVAC, electrical panel, plumbing, and water heater last replaced?
- Is there a deadline driving the sale (1031 exchange, divorce, estate, relocation)? That informs how much negotiation room exists.
- What's the average days-on-market for RENTAL listings here right now (not sales)? A rising rental-DOM trend means longer vacancies and softer asking-rent achievability than the comps imply.
- What's the recent tenant-quality profile in this submarket — average credit score on applications, eviction rate, late-payment / NSF rate, and stable-employment percentage? A property-management company in the area should have these aggregated.
- How much new for-sale + rental construction is in the pipeline within 1–3 miles? Heavy new supply typically softens prices + rents 12–24 months out; constrained supply supports both.
Investment metrics
- 1% rule
- 1.04% ✓
- Cap rate
- 9.10%
- Cash-on-cash
- 10.03%
- DSCR
- 1.45
- GRM
- 8.0
CMA / ARV
- ARV (on-the-fly)
- $136,928
- Comps found
- 10
Show comp detail 10 sales within ~0.75 mi
| Address | Dist | Beds/Ba | Sqft | Sold | Price | $/sf | Match |
|---|---|---|---|---|---|---|---|
| 300 S Franklin St | 0.24mi | 3/2.0 | 1,575 (+1%) | 3mo | $130,000 | $83 | 80 |
| 109 Humble Ave | 0.04mi | 3/2.0 | 1,388 (-11%) | 8mo | $100,000 | $72 | 70 |
| 403 E College St | 0.32mi | 3/1.0 | 1,568 (+1%) | 20mo | $90,000 | $57 | 67 |
| 400 E Washington St | 0.30mi | 3/2.5 | 1,644 (+6%) | 5mo | $90,000 | $55 | 66 |
| 417 N Green St | 0.58mi | 3/1.0 | 1,511 (-3%) | 6mo | $176,000 | $116 | 63 |
| 311 E Front St | 0.35mi | 3/1.0 | 1,661 (+7%) | 14mo | $145,000 | $87 | 61 |
| 132 Harwood St | 0.35mi | 3/2.0 | 1,662 (+7%) | 10mo | $153,500 | $92 | 60 |
| 1016 Woodlawn St | 0.61mi | 3/2.0 | 1,540 (-1%) | 10mo | $135,000 | $88 | 58 |
| 438 N Green St | 0.60mi | 3/2.0 | 1,567 (+1%) | 13mo | $219,000 | $140 | 56 |
| 1028 Woodlawn St | 0.69mi | 3/1.5 | 1,338 (-14%) | 3mo | $194,900 | $146 | 40 |
Match score weights: distance 35% · size 25% · config 20% · recency 20%. Top-matched comps best support the ARV.
Projected returns pro-forma
-3.0% appreciation · 3.0% rent growth · sell at horizon
- IRR
- -1.3%
- Equity multiple
- 0.95×
- Total profit
- $-1,690
- Equity at exit
- $18,623
- IRR
- 8.4%
- Equity multiple
- 1.64×
- Total profit
- $22,249
- Equity at exit
- $10,799
Cash invested: $34,972 (down + closing). Projections, not guarantees.
Landlord ↔ Tenant lean methodology
- Overall (STATE)
- 83 Strongly Landlord-Friendly
- State Kentucky
- 83 Strongly Landlord-Friendly · R+16
- County
- — inherits STATE
- City
- — inherits STATE
ZIP-level market 42141
- Home prices YoY
- -20.6%
- Active inventory
- 293
- Price-to-rent
- 8.0×
Monthly cashflow live
- Estimated rent
- $1,300 medium interval (Pro) →
- Mortgage (P&I)
- −$655
- Tax from tax record
- −$28 /mo · $334/yr
- Insurance
- −$52
- HOA
- −$0
- Vacancy / Maint / Mgmt
- −$273
- Net cashflow
- $292
Break-even live
UW: 25.0% down · 7.5% · 30yr · 1.5% tax · 5.0% vac · 8.0% maint · 8.0% mgmt
Financing live
Cash to close
- Down payment
- $31,225
- Closing costs
- $3,747
- Reserves months
- —
- Total cash needed
- —
Loan-product check · same deal, 3 products live
Conventional
25% down · 7.5% · 30yr
- Down + closing
- —
- Monthly P&I
- —
- Monthly cashflow
- —
- DSCR
- —
- Eligible?
- —
Personal DTI + credit; lowest rate.
DSCR
20% down · 8.5% · 30yr
- Down + closing
- —
- Monthly P&I
- —
- Monthly cashflow
- —
- DSCR
- —
- Eligible?
- —
No personal income docs; deal must DSCR.
Hard money
10% down · 12.0% · 12mo
- Down + closing
- —
- Monthly P&I
- —
- Monthly cashflow
- —
- DSCR
- —
- Eligible?
- —
Short-term bridge; refi at stabilization.
Rent comps 1 comps
| Address | Beds | Baths | Sqft | Rent | $/sqft | DOM | Units | Dist |
|---|---|---|---|---|---|---|---|---|
| 203 New Salem Rd Unit Main House Glasgow, KY | 4.0 | 2.0 | 1300 | $1,300 | $1.00 | 43d | 1 | 0.78mi |
Listing history 31 events
-
2026-06-18days on market $124,900 Active 38 DOM
-
2026-06-17days on market $124,900 Active 37 DOM
-
2026-06-16days on market $124,900 Active 36 DOM
-
2026-06-15days on market $124,900 Active 35 DOM
-
2026-06-13days on market $124,900 Active 33 DOM
-
2026-06-12days on market $124,900 Active 32 DOM
-
2026-06-09days on market $124,900 Active 29 DOM
-
2026-06-08days on market $124,900 Active 28 DOM
-
2026-06-07days on market $124,900 Active 27 DOM
-
2026-06-07days on market $124,900 Active 26 DOM
-
2026-06-04days on market $124,900 Active 23 DOM
-
2026-06-02days on market $124,900 Active 22 DOM
-
2026-06-01days on market $124,900 Active 21 DOM
-
2026-05-31days on market $124,900 Active 20 DOM
-
2026-05-31days on market $124,900 Active 19 DOM
-
2026-05-11$124,900 Active
-
2026-05-03$1,050
-
2026-04-29status Active
-
2026-04-18historical $1,050
-
2026-04-13historical Active Under Contract
-
2026-04-02status Active
-
2026-03-29$1,050
-
2026-03-06historical $1,050
-
2026-03-03historical Active Under Contract
-
2026-02-13$1,050
-
2026-02-10price $124,900
-
2026-01-02price $129,900
-
2025-12-08price $134,900
-
2025-11-18price $139,900
-
2025-11-06$144,900 Active
-
2008-01-14soldstatus $39,000
ⓘ Source: listings_history table (triggers on properties + properties_extension) + one-shot
backfill from property_details.listing_events for pre-trigger history.
Tax reassessment forecast KY · Resets to sale price
- Current annual tax
- $334 · $28/mo
- Projected year-2 tax
- $1,074 · $90/mo
- Expected delta
- +$741/yr (+$62/mo · 222.0%)
ⓘ Screening estimate from a state-policy table — verify with the county assessor before closing.
Climate risk First Street
- Flood 1/10 Low FEMA zone X (unshaded) · 0% chance over 30 yrs
- Wildfire 1/10 Low
- Heat 5/10 Major 7 d/yr ≥107°F today · 19 d/yr by 30 yrs out
- Wind 3/10 Moderate 5% chance of damaging wind over 30 yrs
- Air quality 2/10 Low 0 unhealthy d/yr today · 2 by 30 yrs out
Nearby sold comps map
Loading sold comps map…
Walkable amenities ~0.75 mi
Loading nearby amenities…
Taxation est. · year 1
- Rental income
- $15,600
- − Mortgage interest
- −$6,996
- − Property taxes
- −$334
- − Insurance
- −$624
- − Repairs & maintenance
- −$1,248
- − Management
- −$1,248
- − Depreciation
- −$3,633
- Taxable income
- $1,516
- Est. tax owed @ 24.0%
- −$364
- After-tax cash flow
- $3,142/yr
For passive investors: Depreciation is non-cash, so a rental often shows a tax loss while cash-flowing — sheltering income. Rental losses are passive: they offset passive income freely, and up to $25,000/yr can offset ordinary (W-2) income if you actively participate and your MAGI is under $100k (phasing out to $0 by $150k); unused losses carry forward. On sale, claimed depreciation is recaptured at up to 25%, and gains may owe capital-gains tax (a 1031 exchange can defer both). Figures are a year-1 estimate at your 24.0% rate — not tax advice; consult a CPA.
Schools (NCES district)
- District
- Glasgow Independent
- NCES district ID
- 2102220
- Math proficiency
- 32% ▼ -21.00%
- Reading proficiency
- 40% ▼ -16.00%
- Median HH income
- $27,729
- Composite
- 29.02/100
- National rank
- #6610
- State rank
- #69 of 165 in KY
Livability — Glasgow
- Score
- 76/100
- State rank
- #92
- US rank
- #3738
Category grades
Schools grade is shown separately in the Schools card above.
Census & demographics
- Census place
- Glasgow, KY
- Population (ZIP)
- 32,133
Population outlook (Barren County) Hauer SSP2
- Today (2025)
- 46,858 people
- By 2030
- 48,311 · +3.1%
- By 2040
- 50,931 · +8.7%
- By 2050
- 52,820 · +12.7%
- By 2075
- 56,499 · +20.6%
- By 2100
- 55,831 · +19.1%
Race, ethnicity, and origin ACS 2023
- Neighborhood character
- Predominantly White (87%)
- Race & ethnicity
- White 87% Two or more races 6% Hispanic / Latino 5% Black 4%
- Common ancestry
- Slovak 2% Lithuanian 2% Serbian 1%
- Foreign-born
- 3% · Canada
- Languages at home
- 95% English-only · Spanish 3%
Political lean MEDSL · Barren
- 2024 margin
- Solid R (+52.8) · D 23.1% · R 75.9% · Other 1.1%
- 2008→2024 swing
- -18.9pp toward R · 2008: -33.9pp · 2024: -52.8pp
- All cycles
- 2024: R+52.8 2020: R+47.5 2016: R+49.9 2012: R+33.3 2008: R+33.9
Not yet ingested
- Civics
- —
Market trends
- HPI YoY
- ▼ -72.48%
- Current HPI
- 278.8778
- Rent YoY
- —
- Metro
- —
- State GDP YoY
- ▲ 1.81%
- F500 in state
- 4
Industry mix (Fortune 500 HQ in KY)
| Industry | F500 HQs | Revenue |
|---|---|---|
| Healthcare | 1 | $118B |
|
||
| Food / Beverage | 1 | $7B |
|
||
Price history
+220.3% since first listed16 events — show timeline
- 2026-05-11 Listed $124,900 RASKMLS
- 2026-05-03 Listed for Rent $1,050 TENANTCLOUD
- 2026-04-29 Relisted — RASKMLS
- 2026-04-18 Rental Removed $1,050 TENANTCLOUD
- 2026-04-13 Contingent — RASKMLS
- 2026-04-02 Relisted — RASKMLS
- 2026-03-29 Listed for Rent $1,050 TENANTCLOUD
- 2026-03-06 Rental Removed $1,050 TENANTCLOUD
- 2026-03-03 Contingent — RASKMLS
- 2026-02-13 Listed for Rent $1,050 TENANTCLOUD
- 2026-02-10 Price Changed $124,900 RASKMLS
- 2026-01-02 Price Changed $129,900 RASKMLS
- 2025-12-08 Price Changed $134,900 RASKMLS
- 2025-11-18 Price Changed $139,900 RASKMLS
- 2025-11-06 Listed $144,900 RASKMLS
- 2008-01-14 Sold (Public Records) $39,000 Public Records
Property tax history
-1.7%/yrLatest (2025): $334 · -26.6% YoY. Source: county tax records.
Cash-flow waterfall
monthlySold comps — $/sqft
last 12 mo · ≤1 miLoading sold comps…