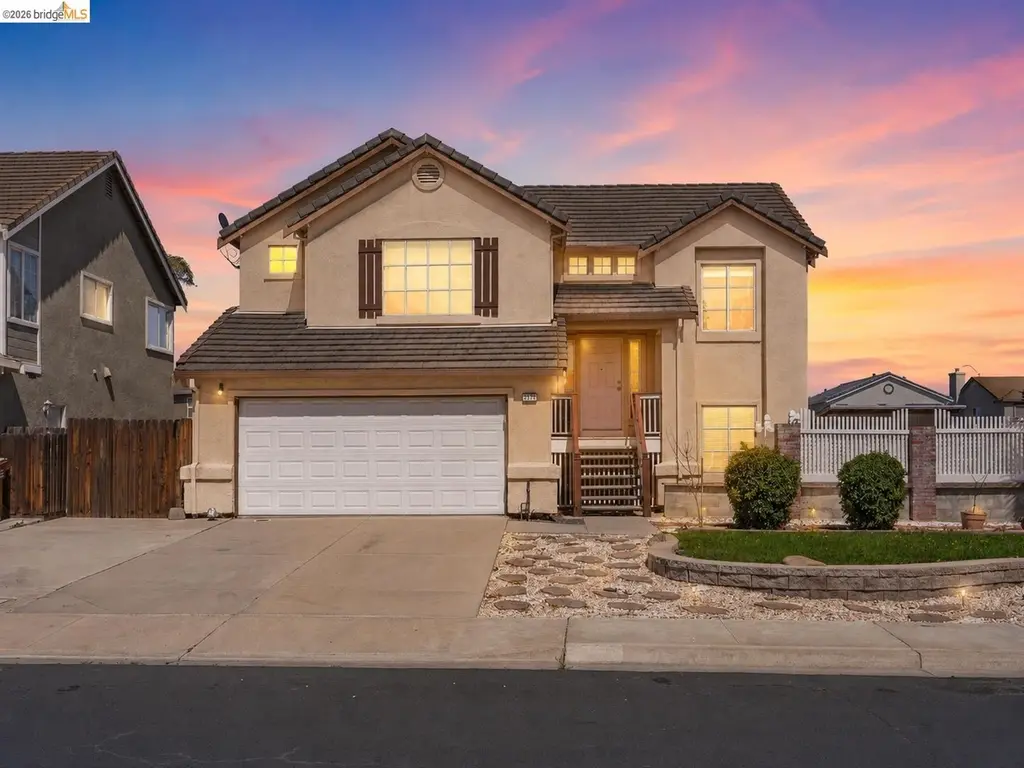
2413 Halyard Way · Discovery Bay, CA
Flood risk 4/10 · Minor
- FEMA flood zone
- X (unshaded)
- Chance of flooding over 30 yrs
- 0.22%
- Est. flood insurance / yr
- $507 – $1,088
Fire risk 6/10 · Moderate
- Est. fire insurance / yr
- $659 – $1,223
Heat risk 6/10 · Moderate
- Hot days now (above 103°F)
- 7 days/yr
- Hot days in 30 yrs
- 15 days/yr
Wind risk 1/10 · Minimal
- Chance of severe wind over 30 yrs
- —
Air-quality risk 9/10 · Severe
- Unhealthy air days now
- 20 days/yr
- Unhealthy air days in 30 yrs
- 21 days/yr
Risk factors via First Street. Map © Google.
Why this score? — see what drove the C- grade
The composite is a weighted blend of 9 inputs, each scored 0–100. Each bar is that input's sub-score; the figure is the points it added to the 100-point composite (weight × sub-score).
- Cash flow +20.7/30.0
- ARV discount +9.4/15.0
- DSCR +6.6/10.0
- Schools +5.0/10.0
- 1% rule +4.7/10.0
- Livability +3.0/5.0
- Rent growth +2.5/5.0
- Condition / age +2.5/5.0
- Appreciation +0.0/10.0
$650,000
🖨 Deal sheet 📄 Offer letter ✓ Due diligence
Listing remarks MLS
This home has 5 bedrooms!! 2.5 baths,living room with wood burning fireplace, seperate family room on a corner lot, within walking distance to the grocery store. Needs some TLC, needs paint and carpet. Close to delta for swimming,fishing and boating.This is a bank owned home sold as is
Key facts
- Corner-lot home
- Island bar seating
- Eat-in dining area
Tags
Property features AI
Exterior
- Parking: Attached garage; 2 covered spaces; 2 garage spaces
- Utilities: Public water; Public sewer
- Home design: Single-family residence; Residential property; Built in 1995; Corner lot
- Construction: Stucco construction
- Exterior features: Front, side and back yard; Yard space with storage; Deck; Fenced yard; Shed(s)
Interior
- Kitchen: Dishwasher; Microwave; Refrigerator; Eat-in kitchen
- Bedrooms: 3 bedrooms on street level
- Flooring: Laminate; Tile; Carpet
- Bathrooms: 3 bathrooms total (2 full, 1 partial)
- Heating & cooling: Natural gas heating; Central air; Ceiling fans; Whole house fan
- Interior features: Family room; Breakfast bar; Solid surface counters; Wood-burning fireplace in the family room
- Laundry & utility: Laundry room with washer and dryer
Neighborhood map
What this means for you Summary
Snapshot
- This is a 5-bed/3.0-bath single-family listed at $650k.
Deal economics
- At list price, monthly cash flow is $885 ($11k/yr) — positive.
- The deal already cash-flows at list — no discount required.
- To meet the 1% rule (rent ≥ 1% of price), the offer needs to be $630k (3.2% below list).
- Recommended offer: $630k (3.2% below list) — sets the bar for 1% rule.
- Cap rate 7.9% vs local median 2.5% in Discovery Bay — top-decile yield for the area; either an underpriced asset or a hidden risk that comps aren't pricing in. Stress-test before assuming the spread holds.
Location & tenants
- Location reads 59/100 on livability (#619 in CA) — a working-class tenant base; expect higher turnover. Strengths: employment A+, housing A+, crime A-; Watch: amenities F, commute F, cost of living F.
- Liberty Union High (suburban): math 36% / reading 69% proficiency, ranked #320 of 1,400 in CA (top 23%) — acceptable for families but not a draw, mixed tenant base, ~2y average lease.
- Market conditions: 173 active listings in the ZIP; 1 comparable units currently listed for rent nearby; 2,169 units permitted in Contra Costa County in 2024 (896 in 5+ unit buildings).
Forward outlook
- Local home prices are declining (-3.0%/yr); year-one equity from $4k of loan paydown is wiped out by about $20k of value loss. Plan a longer hold.
- Contra Costa County population projected at +26% by 2050 — long-run rental-demand tailwind backs the buy-and-hold thesis.
Negotiation context
- Only 12 days on market — expect competitive offers; lowballing is unlikely to land.
- 2 sale attempts since 15y ago with the ask held roughly flat each time — persistent listings suggest the price (not the market) is what's stuck; bring a comps-based counter.
- Current owner paid $186k; list at $650k implies a 249% gain — meaningful room to come down on a strong offer.
Risks & watch-outs
- Climate carrying-cost: major wildfire risk; extreme-heat days projected 7→15/yr by 2055 (HVAC capex compounding) — expect insurance premiums to compound above CPI over the hold.
Questions for the listing agent
- Is there a deadline driving the sale (1031 exchange, divorce, estate, relocation)? That informs how much negotiation room exists.
- Schools are B-rated — typically a magnet for longer-tenancy family renters. What's the average tenant stay here, and is there a school-zone premium baked into asking?
- What's the average days-on-market for RENTAL listings here right now (not sales)? A rising rental-DOM trend means longer vacancies and softer asking-rent achievability than the comps imply.
- What's the recent tenant-quality profile in this submarket — average credit score on applications, eviction rate, late-payment / NSF rate, and stable-employment percentage? A property-management company in the area should have these aggregated.
- How much new for-sale + rental construction is in the pipeline within 1–3 miles? Heavy new supply typically softens prices + rents 12–24 months out; constrained supply supports both.
Investment metrics
- 1% rule
- 0.97% ✗
- Cap rate
- 7.93%
- Cash-on-cash
- 5.83%
- DSCR
- 1.26
- GRM
- 8.6
CMA / ARV
- ARV (on-the-fly)
- $679,350
- Comps found
- 12
Show comp detail 12 sales within ~0.75 mi
| Address | Dist | Beds/Ba | Sqft | Sold | Price | $/sf | Match |
|---|---|---|---|---|---|---|---|
| 3749 Sailboat Dr | 0.05mi | 4/3.0 (-1) | 2,042 (+5%) | 2mo | $639,000 | $313 | 82 |
| 3965 Regatta Dr | 0.30mi | 5/3.0 | 2,043 (+5%) | 6mo | $715,000 | $350 | 72 |
| 4014 N Coral Ct | 0.41mi | 5/3.5 | 2,043 (+5%) | 2mo | $640,000 | $313 | 69 |
| 4033 Nautical Ct | 0.39mi | 4/2.5 (-1) | 1,906 (-2%) | 9mo | $685,000 | $359 | 65 |
| 4043 Regatta Dr | 0.15mi | 4/2.5 (-1) | 1,713 (-12%) | 3mo | $629,800 | $368 | 64 |
| 3985 S Coral Ct | 0.45mi | 4/2.5 (-1) | 1,945 (+0%) | 9mo | $600,000 | $308 | 64 |
| 4010 Goleta Pl | 0.40mi | 5/2.5 | 2,136 (+10%) | 2mo | $675,000 | $316 | 61 |
| 2522 Foghorn Way | 0.12mi | 4/2.5 (-1) | 1,713 (-12%) | 17mo | $600,000 | $350 | 54 |
| 3977 Seagull Ct | 0.37mi | 4/2.0 (-1) | 1,856 (-4%) | 16mo | $635,000 | $342 | 53 |
| 2224 Newport Ct | 0.37mi | 4/2.5 (-1) | 2,136 (+10%) | 11mo | $755,000 | $353 | 50 |
| 2072 Windward Pt | 0.57mi | 4/2.5 (-1) | 2,136 (+10%) | 8mo | $900,000 | $421 | 43 |
| 2427 Imperial Ct | 0.62mi | 4/2.0 (-1) | 1,760 (-9%) | 19mo | $785,000 | $446 | 31 |
Match score weights: distance 35% · size 25% · config 20% · recency 20%. Top-matched comps best support the ARV.
Projected returns pro-forma
-3.0% appreciation · 3.0% rent growth · sell at horizon
- IRR
- -7.3%
- Equity multiple
- 0.73×
- Total profit
- $-49,125
- Equity at exit
- $96,917
- IRR
- 2.2%
- Equity multiple
- 1.16×
- Total profit
- $29,169
- Equity at exit
- $56,200
Cash invested: $182,000 (down + closing). Projections, not guarantees.
Landlord ↔ Tenant lean methodology
- Overall (STATE)
- 18 Strongly Tenant-Friendly
- State California
- 18 Strongly Tenant-Friendly · D+13
- County
- — inherits STATE
- City
- — inherits STATE
ZIP-level market 94505
- Active inventory
- 173
- Price-to-rent
- 8.6×
Monthly cashflow live
- Estimated rent
- $6,295 medium interval (Pro) →
- Mortgage (P&I)
- −$3,409
- Tax from tax record
- −$409 /mo · $4,904/yr
- Insurance
- −$271
- HOA
- −$0
- Vacancy / Maint / Mgmt
- −$1,322
- Net cashflow
- $885
Break-even live
UW: 25.0% down · 7.5% · 30yr · 1.5% tax · 5.0% vac · 8.0% maint · 8.0% mgmt
Financing live
Cash to close
- Down payment
- $162,500
- Closing costs
- $19,500
- Reserves months
- —
- Total cash needed
- —
Loan-product check · same deal, 3 products live
Conventional
25% down · 7.5% · 30yr
- Down + closing
- —
- Monthly P&I
- —
- Monthly cashflow
- —
- DSCR
- —
- Eligible?
- —
Personal DTI + credit; lowest rate.
DSCR
20% down · 8.5% · 30yr
- Down + closing
- —
- Monthly P&I
- —
- Monthly cashflow
- —
- DSCR
- —
- Eligible?
- —
No personal income docs; deal must DSCR.
Hard money
10% down · 12.0% · 12mo
- Down + closing
- —
- Monthly P&I
- —
- Monthly cashflow
- —
- DSCR
- —
- Eligible?
- —
Short-term bridge; refi at stabilization.
Rent comps 1 comps
| Address | Beds | Baths | Sqft | Rent | $/sqft | DOM | Units | Dist |
|---|---|---|---|---|---|---|---|---|
| 4050 Pier Pt Discovery Bay, CA | 4.0 | 2.0 | 2065 | $6,295 | $3.05 | 1d | 1 | 0.46mi |
Listing history 11 events
-
2026-06-18status $650,000 Pending 12 DOM
-
2026-06-17days on market $650,000 Active 12 DOM
-
2026-06-16days on market $650,000 Active 11 DOM
-
2026-06-15days on market $650,000 Active 10 DOM
-
2026-06-13days on market $650,000 Active 8 DOM
-
2026-06-13days on market $650,000 Active 7 DOM
-
2026-06-10days on market $650,000 Active 5 DOM
-
2026-06-09days on market $650,000 Active 4 DOM
-
2026-06-08days on market $650,000 Active 3 DOM
-
2026-06-07remarks 699-char remark
-
2026-06-07$650,000 Active 2 DOM
ⓘ Source: listings_history table (triggers on properties + properties_extension) + one-shot
backfill from property_details.listing_events for pre-trigger history.
Tax reassessment forecast CA · Resets to sale price
- Current annual tax
- $4,904 · $409/mo
- Projected year-2 tax
- $4,940 · $412/mo
- Expected delta
- +$36/yr (+$3/mo · 0.7%)
ⓘ Screening estimate from a state-policy table — verify with the county assessor before closing.
Climate risk First Street
- Flood 4/10 Moderate FEMA zone X (unshaded) · 22% chance over 30 yrs
- Wildfire 6/10 Major
- Heat 6/10 Major 7 d/yr ≥103°F today · 15 d/yr by 30 yrs out
- Wind 1/10 Low
- Air quality 9/10 Extreme 20 unhealthy d/yr today · 21 by 30 yrs out
Nearby sold comps map
Loading sold comps map…
Walkable amenities ~0.75 mi
Loading nearby amenities…
Taxation est. · year 1
- Rental income
- $75,540
- − Mortgage interest
- −$36,410
- − Property taxes
- −$4,904
- − Insurance
- −$3,250
- − Repairs & maintenance
- −$6,043
- − Management
- −$6,043
- − Depreciation
- −$18,909
- Taxable loss
- −$20
- Est. tax savings @ 24.0%
- +$5
- After-tax cash flow
- $10,623/yr
For passive investors: Depreciation is non-cash, so a rental often shows a tax loss while cash-flowing — sheltering income. Rental losses are passive: they offset passive income freely, and up to $25,000/yr can offset ordinary (W-2) income if you actively participate and your MAGI is under $100k (phasing out to $0 by $150k); unused losses carry forward. On sale, claimed depreciation is recaptured at up to 25%, and gains may owe capital-gains tax (a 1031 exchange can defer both). Figures are a year-1 estimate at your 24.0% rate — not tax advice; consult a CPA.
Schools (NCES district)
- District
- Liberty Union High
- NCES district ID
- 0621600
- Math proficiency
- 36% ▲ 5.00%
- Reading proficiency
- 69% ▲ 12.00%
- Median HH income
- $87,001
- Composite
- 50.24/100
- National rank
- #4065
- State rank
- #320 of 1400 in CA
Livability — Discovery Bay
- Score
- 59/100
- State rank
- #619
- US rank
- #19689
Category grades
Schools grade is shown separately in the Schools card above.
Census & demographics
- Census place
- Discovery Bay, CA
- Population (ZIP)
- 15,316
Population outlook (Contra Costa County) Hauer SSP2
- Today (2025)
- 1,287,720 people
- By 2030
- 1,364,937 · +6.0%
- By 2040
- 1,506,209 · +17.0%
- By 2050
- 1,624,373 · +26.1%
- By 2075
- 1,853,193 · +43.9%
- By 2100
- 1,901,231 · +47.6%
Race, ethnicity, and origin ACS 2023
- Neighborhood character
- Diverse neighborhood (Simpson 0.58)
- Race & ethnicity
- White 62% Hispanic / Latino 18% Two or more races 13% Black 6% Asian 5%
- Hispanic origin (detail)
- Mexican 12% Puerto Rican 1%
- Common ancestry
- Lithuanian 3% Italian 3% Russian 3%
- Foreign-born
- 11% · Canada, China, Guatemala
- Languages at home
- 85% English-only · Spanish 8% French/Haitian/Cajun 2% Other Indo-European 2%
Political lean MEDSL · Contra Costa
- 2024 margin
- Solid D (+38.0) · D 67.3% · R 29.4% · Other 3.3%
- 2008→2024 swing
- +0.2pp no change · 2008: 37.8pp · 2024: 38.0pp
- All cycles
- 2024: D+38.0 2020: D+45.3 2016: D+43.5 2012: D+33.7 2008: D+37.8
Not yet ingested
- Civics
- —
Market trends
- HPI YoY
- ▼ -270.46%
- Current HPI
- 184.2678
- Rent YoY
- —
- Metro
- —
- State GDP YoY
- ▲ 3.21%
- F500 in state
- 116
Industry mix (Fortune 500 HQ in CA)
| Industry | F500 HQs | Revenue |
|---|---|---|
| Technology | 27 | $1,492B |
|
||
| Financial Services | 3 | $174B |
|
||
| Retail | 3 | $44B |
|
||
| Insurance | 3 | $26B |
|
||
| Media / Entertainment | 2 | $115B |
|
||
| Pharmaceuticals / Biotech | 2 | $62B |
|
||
Price history
+233.3% since first listed7 events — show timeline
- 2026-06-05 Listed $650,000 bridgeMLS, Bay East AOR, or Contra Costa AOR
- 2011-07-02 Sold (MLS) $186,000 bridgeMLS, Bay East AOR, or Contra Costa AOR
- 2011-06-07 Pending — bridgeMLS, Bay East AOR, or Contra Costa AOR
- 2011-05-19 Price Changed $194,900 bridgeMLS, Bay East AOR, or Contra Costa AOR
- 2011-04-20 Price Changed $202,500 bridgeMLS, Bay East AOR, or Contra Costa AOR
- 2011-03-19 Listed $215,900 bridgeMLS, Bay East AOR, or Contra Costa AOR
- 1995-05-04 Sold (Public Records) $195,000 Public Records
Property tax history
+1.3%/yrLatest (2025): $4,904 · +6.4% YoY. Source: county tax records.
Cash-flow waterfall
monthlySold comps — $/sqft
last 12 mo · ≤1 miLoading sold comps…