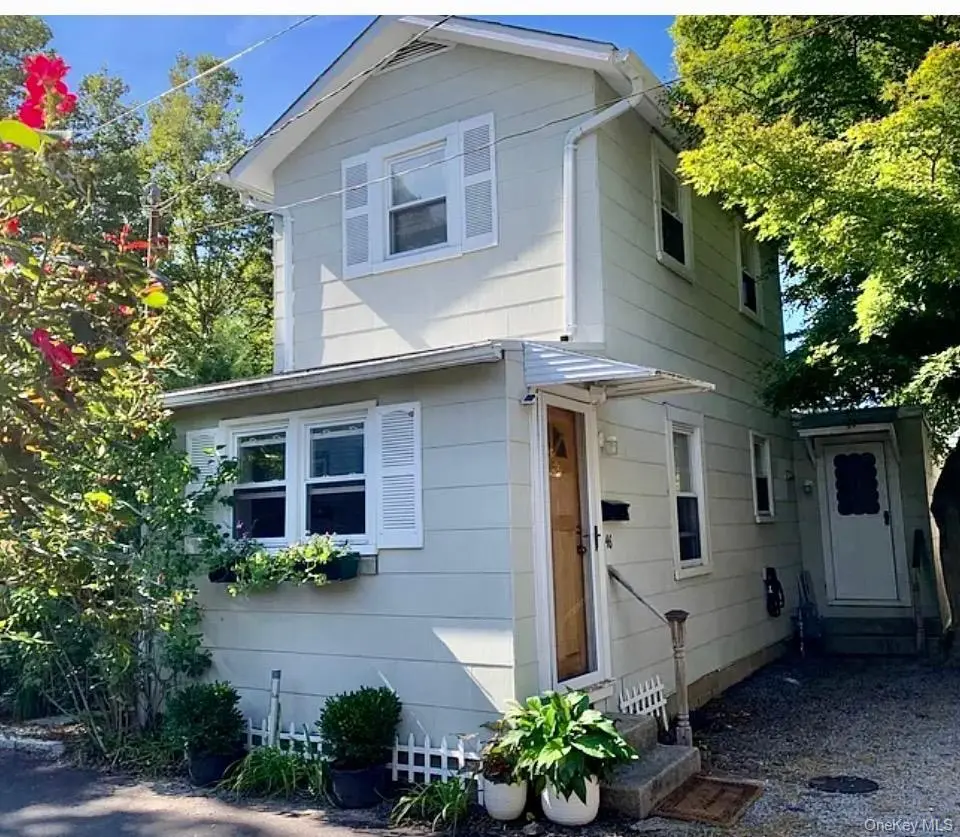
46 Brown St · Sea Cliff, NY
Flood risk 1/10 · Minimal
- FEMA flood zone
- X (unshaded)
- Chance of flooding over 30 yrs
- 0.0%
- Est. flood insurance / yr
- $507 – $1,088
Fire risk 1/10 · Minimal
- Est. fire insurance / yr
- $691 – $1,283
Heat risk 6/10 · Moderate
- Hot days now (above 97°F)
- 7 days/yr
- Hot days in 30 yrs
- 16 days/yr
Wind risk 6/10 · Moderate
- Chance of severe wind over 30 yrs
- 62.0%
Air-quality risk 4/10 · Minor
- Unhealthy air days now
- 4 days/yr
- Unhealthy air days in 30 yrs
- 5 days/yr
Risk factors via First Street. Map © Google.
Why this score? — see what drove the D grade
The composite is a weighted blend of 9 inputs, each scored 0–100. Each bar is that input's sub-score; the figure is the points it added to the 100-point composite (weight × sub-score).
- ARV discount +15.0/15.0
- Schools +7.9/10.0
- Cash flow +7.1/30.0
- Livability +4.0/5.0
- Rent growth +2.5/5.0
- Condition / age +2.5/5.0
- 1% rule +2.0/10.0
- DSCR +1.2/10.0
- Appreciation +0.0/10.0
$499,000
🖨 Deal sheet 📄 Offer letter ✓ Due diligence
Listing remarks
Adorable Sea Cliff cottage overlooking Roslyn Park. Lots of updates. Cute, private backyard with parking around the corner. Stroll to everything!
Key facts
- Private backyard
- 1,200 sq ft lot
- Built 1919
Tags
Property features AI
Exterior
- Parking: No carport
- Utilities: PSEG electric; Cesspool sewer; Cable available; Electricity available; Natural gas available
- Home design: Single family residence; Two-story
- Construction: Frame construction; Batts insulation; Block foundation
- Exterior features: Back yard; Near shops; Back yard fencing
Interior
- Kitchen: Gas range; Microwave; Refrigerator
- Bedrooms: Total rooms: 4; Two levels
- Flooring: Ceramic tile; Hardwood
- Bathrooms: 1 full bathroom
- Heating & cooling: Baseboard heating; Hot water heating; Natural gas heating; Wall/window air conditioning units
- Interior features: First-floor bedroom; First-floor full bathroom; Double pane windows; Deck
Neighborhood map
What this means for you Summary
Snapshot
- This is a 2-bed/1.0-bath single-family listed at $499k.
Deal economics
- At list price, monthly cash flow is $-720 ($-9k/yr) — negative.
- To cash-flow at today's rent, offer at most $372k (25.5% below list).
- To meet the 1% rule (rent ≥ 1% of price), the offer needs to be $348k (30.3% below list).
- Recommended offer: $348k (30.3% below list) — sets the bar for 1% rule.
Location & tenants
- Location reads 79/100 on livability (#133 in NY, #2,125 nationally) — a middle-class / working-renter tenant base. Strengths: crime A+, commute A+, employment A+; Watch: amenities C-, cost of living F.
- North Shore Central School District (suburban): math 88% / reading 84% proficiency, ranked #24 of 590 in NY (top 4%) — strong family-tenant draw, lease renewals of 3-5y typical; only 5% free/reduced lunch — higher-income household profile.
- Zoned schools: Sea Cliff Elementary School (math 92% / reading 92%, grade A+, #21 of 2,108 statewide, top 1%, 343 students, 0% FRL) — zoned schools at 0% FRL track the district average.
- Market conditions: 29 active listings in the ZIP; 11 comparable units currently listed for rent nearby; rentals at typical pace (median 19d on market — plan ~3-4 weeks tenant-placement turnaround); 824 units permitted in Nassau County in 2024 (153 in 5+ unit buildings).
Forward outlook
- Local home prices are declining (-3.0%/yr); year-one equity from $3k of loan paydown is wiped out by about $15k of value loss. Plan a longer hold.
- Nassau County population projected at +7% by 2050 — modest demand growth; plan on rents tracking national, not racing it.
Negotiation context
- It's been on market 19 days — a 2% lower offer ($492k) is reasonable based on typical stale-listing flexibility.
- 5 sale attempts since 15y ago with the ask held roughly flat each time — persistent listings suggest the price (not the market) is what's stuck; bring a comps-based counter.
- Current owner paid $162k; list at $499k implies a 208% gain — meaningful room to come down on a strong offer.
Risks & watch-outs
- Watch-outs: built in 1919 — expect roof / HVAC / electrical / plumbing capex.
- Climate carrying-cost: major wind risk, 62% chance of damaging wind over 30y; extreme-heat days projected 7→16/yr by 2055 (HVAC capex compounding) — expect insurance premiums to compound above CPI over the hold.
Questions for the listing agent
- What do current leases actually rent for vs. the listed asking? Can we see a recent rent roll and the last 12 months of T-12 income?
- Built in 1919 — when were the roof, HVAC, electrical panel, plumbing, and water heater last replaced?
- Is there a deadline driving the sale (1031 exchange, divorce, estate, relocation)? That informs how much negotiation room exists.
- Schools are A-rated — typically a magnet for longer-tenancy family renters. What's the average tenant stay here, and is there a school-zone premium baked into asking?
- The area grade is low — what's the realistic commute time and amenity access for the typical tenant pool here? Any planned neighborhood developments (good or bad) we should know about?
- What's the average days-on-market for RENTAL listings here right now (not sales)? A rising rental-DOM trend means longer vacancies and softer asking-rent achievability than the comps imply.
- What's the recent tenant-quality profile in this submarket — average credit score on applications, eviction rate, late-payment / NSF rate, and stable-employment percentage? A property-management company in the area should have these aggregated.
- How much new for-sale + rental construction is in the pipeline within 1–3 miles? Heavy new supply typically softens prices + rents 12–24 months out; constrained supply supports both.
Investment metrics
- 1% rule
- 0.70% ✗
- Cap rate
- 4.56%
- Cash-on-cash
- -6.18%
- DSCR
- 0.72
- GRM
- 12.0
CMA / ARV
- ARV (median comp)
- $701,378
- List price
- $499,000
- Delta
- -28.85%
- Verdict
- UNDERPRICED
- Comps
- 11 within 1.0 mi
Show comp detail 2 sales within ~0.75 mi
| Address | Dist | Beds/Ba | Sqft | Sold | Price | $/sf | Match |
|---|---|---|---|---|---|---|---|
| 31 9th Ave | 0.23mi | 2/1.0 | 780 (+2%) | 8mo | $760,000 | $974 | 79 |
| 79 15th Ave | 0.15mi | 1/1.0 (-1) | 832 (+9%) | 13mo | $549,250 | $660 | 62 |
Match score weights: distance 35% · size 25% · config 20% · recency 20%. Top-matched comps best support the ARV.
Projected returns pro-forma
-3.0% appreciation · 3.0% rent growth · sell at horizon
- IRR
- -26.9%
- Equity multiple
- 0.09×
- Total profit
- $-126,632
- Equity at exit
- $74,403
- IRR
- -24.5%
- Equity multiple
- -0.21×
- Total profit
- $-169,028
- Equity at exit
- $43,144
Cash invested: $139,720 (down + closing). Projections, not guarantees.
Landlord ↔ Tenant lean methodology
- Overall (STATE)
- 15 Strongly Tenant-Friendly
- State New York
- 15 Strongly Tenant-Friendly · D+10
- County
- — inherits STATE
- City
- — inherits STATE
ZIP-level market 11579
- Home prices YoY
- -25.7%
- Active inventory
- 29
- Price-to-rent
- 12.0×
Monthly cashflow live
- Estimated rent
- $3,479 high interval (Pro) →
- Mortgage (P&I)
- −$2,617
- Tax from tax record
- −$643 /mo · $7,721/yr
- Insurance
- −$208
- HOA
- −$0
- Vacancy / Maint / Mgmt
- −$731
- Net cashflow
- $-720
Break-even live
UW: 25.0% down · 7.5% · 30yr · 1.5% tax · 5.0% vac · 8.0% maint · 8.0% mgmt
Financing live
Cash to close
- Down payment
- $124,750
- Closing costs
- $14,970
- Reserves months
- —
- Total cash needed
- —
Loan-product check · same deal, 3 products live
Conventional
25% down · 7.5% · 30yr
- Down + closing
- —
- Monthly P&I
- —
- Monthly cashflow
- —
- DSCR
- —
- Eligible?
- —
Personal DTI + credit; lowest rate.
DSCR
20% down · 8.5% · 30yr
- Down + closing
- —
- Monthly P&I
- —
- Monthly cashflow
- —
- DSCR
- —
- Eligible?
- —
No personal income docs; deal must DSCR.
Hard money
10% down · 12.0% · 12mo
- Down + closing
- —
- Monthly P&I
- —
- Monthly cashflow
- —
- DSCR
- —
- Eligible?
- —
Short-term bridge; refi at stabilization.
Rent comps 11 comps
| Address | Beds | Baths | Sqft | Rent | $/sqft | DOM | Units | Dist |
|---|---|---|---|---|---|---|---|---|
| 378 Sea Cliff Ave Unit 3 Sea Cliff, NY | 1.0 | 1.0 | 800 | $2,900 | $3.62 | 19d | 1 | 0.37mi |
| 55 Sea Cliff Ave Sea Cliff, NY | 1.0 | 1.0 | 700 | $3,200 | $4.57 | 25d | 1 | 0.38mi |
| 226 Glen Cove Ave Unit 2nd floor Glen Cove, NY | 3.0 | 1.5 | 1074 | $3,200 | $2.98 | 21d | 1 | 0.44mi |
| 350 Herb Hill Rd Glen Cove, NY | 2.0 | 1.0–2.0 | 918 | $5,726 | $6.24 | 1d | 5 | 1.03mi |
| 86 McLoughlin St Unit D Glen Cove, NY | 2.0 | 1.0 | 722 | $2,700 | $3.74 | 44d | 1 | 1.18mi |
| 400 Carney St Unit 403 Glen Cove, NY | 1.0 | 1.0 | 900 | $2,700 | $3.00 | 19d | 1 | 1.25mi |
| 1100 Avalon Sq Glen Cove, NY | 2.0 | 1.0–2.0 | 952 | $4,485 | $4.71 | 1d | 1 | 1.28mi |
| 100 Village Sq Glen Cove, NY | 2.0 | 1.0–2.0 | 924 | $4,761 | $5.15 | 1d | 4 | 1.33mi |
| 13 Prospect St Glen Head, NY | 2.0 | 1.0 | 909 | $3,950 | $4.35 | 44d | 1 | 1.45mi |
| 1 Alvin St Unit 1 Glen Cove, NY | 2.0 | 1.0 | 950 | $3,350 | $3.53 | 3d | 1 | 1.47mi |
| 14 1st St Glen Cove, NY | 3.0 | 2.0 | 1120 | $4,200 | $3.75 | 44d | 1 | 1.48mi |
Listing history 20 events
-
2026-06-03status $499,000 Pending 19 DOM
-
2026-06-02days on market $499,000 Active 19 DOM
-
2026-06-01days on market $499,000 Active 18 DOM
-
2026-05-31days on market $499,000 Active 17 DOM
-
2026-05-14$499,000 Active 148-char remark
-
2026-02-05historical
-
2026-01-03price $515,000
-
2025-11-10price $545,000
-
2025-10-20price $569,000
-
2025-10-08$619,000 Active
-
2013-12-09historical
-
2013-09-19$279,000
-
2013-04-05soldstatus $162,000
-
2013-03-29soldstatus $162,000
-
2013-01-16historical
-
2012-03-07$199,000
-
2011-07-15status Under Contract
-
2011-04-27$199,000 New
-
1981-01-01soldstatus $42,000
-
1979-08-01soldstatus $28,000
ⓘ Source: listings_history table (triggers on properties + properties_extension) + one-shot
backfill from property_details.listing_events for pre-trigger history.
Tax reassessment forecast NY · Partial reset (capped growth)
- Current annual tax
- $7,721 · $643/mo
- Projected year-2 tax
- $8,077 · $673/mo
- Expected delta
- +$356/yr (+$30/mo · 4.6%)
ⓘ Screening estimate from a state-policy table — verify with the county assessor before closing.
Climate risk First Street
- Flood 1/10 Low FEMA zone X (unshaded) · 0% chance over 30 yrs
- Wildfire 1/10 Low
- Heat 6/10 Major 7 d/yr ≥97°F today · 16 d/yr by 30 yrs out
- Wind 6/10 Major 62% chance of damaging wind over 30 yrs
- Air quality 4/10 Moderate 4 unhealthy d/yr today · 5 by 30 yrs out
Nearby sold comps map
Loading sold comps map…
Walkable amenities ~0.75 mi
Loading nearby amenities…
Taxation est. · year 1
- Rental income
- $41,748
- − Mortgage interest
- −$27,952
- − Property taxes
- −$7,721
- − Insurance
- −$2,495
- − Repairs & maintenance
- −$3,340
- − Management
- −$3,340
- − Depreciation
- −$14,516
- Taxable loss
- −$17,615
- Est. tax savings @ 24.0%
- +$4,228
- After-tax cash flow
- $-4,409/yr
For passive investors: Depreciation is non-cash, so a rental often shows a tax loss while cash-flowing — sheltering income. Rental losses are passive: they offset passive income freely, and up to $25,000/yr can offset ordinary (W-2) income if you actively participate and your MAGI is under $100k (phasing out to $0 by $150k); unused losses carry forward. On sale, claimed depreciation is recaptured at up to 25%, and gains may owe capital-gains tax (a 1031 exchange can defer both). Figures are a year-1 estimate at your 24.0% rate — not tax advice; consult a CPA.
Schools (NCES district)
- District
- North Shore Central School District
- NCES district ID
- 3626370
- Math proficiency
- 88% ▼ -3.00%
- Reading proficiency
- 84% ▼ -2.00%
- Median HH income
- $113,973
- Composite
- 78.77/100
- National rank
- #69
- State rank
- #24 of 590 in NY
Livability — Sea Cliff
- Score
- 79/100
- State rank
- #133
- US rank
- #2125
Category grades
Schools grade is shown separately in the Schools card above.
Census & demographics
- Census place
- Sea Cliff, NY
- City population
- 5,037
- Population (ZIP)
- 5,037
Population outlook (Nassau County) Hauer SSP2
- Today (2025)
- 1,409,302 people
- By 2030
- 1,431,482 · +1.6%
- By 2040
- 1,471,607 · +4.4%
- By 2050
- 1,502,845 · +6.6%
- By 2075
- 1,575,403 · +11.8%
- By 2100
- 1,554,356 · +10.3%
Race, ethnicity, and origin ACS 2023
- Neighborhood character
- Predominantly White (87%)
- Race & ethnicity
- White 87% Hispanic / Latino 7% Two or more races 7% Asian 1%
- Hispanic origin (detail)
- Puerto Rican 1% Cuban 2%
- Common ancestry
- Romanian 5% Scotch-Irish 4% Lithuanian 2%
- Foreign-born
- 10% · Canada, China
- Languages at home
- 89% English-only · Other Indo-European 2% Russian/Polish/Slavic 2% Spanish 2%
Political lean MEDSL · Nassau
- 2024 margin
- Toss-up / Even · D 47.9% · R 52.1%
- 2008→2024 swing
- -12.6pp toward R · 2008: 8.4pp · 2024: -4.2pp
- All cycles
- 2024: R+4.2 2020: D+9.5 2016: D+5.3 2012: D+6.7 2008: D+8.4
Not yet ingested
- Civics
- —
Market trends
- HPI YoY
- ▼ -101.71%
- Current HPI
- 294.4493
- Rent YoY
- —
- Metro
- —
- State GDP YoY
- ▲ 2.60%
- F500 in state
- 92
Industry mix (Fortune 500 HQ in NY)
| Industry | F500 HQs | Revenue |
|---|---|---|
| Financial Services | 10 | $950B |
|
||
| Consumer Goods | 9 | $162B |
|
||
| Insurance | 4 | $225B |
|
||
| Telecommunications | 2 | $144B |
|
||
| Pharmaceuticals | 2 | $112B |
|
||
| Media / Entertainment | 2 | $69B |
|
||
Price history
+1682.1% since first listed17 events — show timeline
- 2026-06-02 Pending — OneKey® MLS as Distributed by MLS Grid
- 2026-05-14 Listed $499,000 OneKey® MLS as Distributed by MLS Grid
- 2026-02-05 Listing Removed — OneKey® MLS as Distributed by MLS Grid
- 2026-01-03 Price Changed $515,000 OneKey® MLS as Distributed by MLS Grid
- 2025-11-10 Price Changed $545,000 OneKey® MLS as Distributed by MLS Grid
- 2025-10-20 Price Changed $569,000 OneKey® MLS as Distributed by MLS Grid
- 2025-10-08 Listed $619,000 OneKey® MLS as Distributed by MLS Grid
- 2013-12-09 Listing Removed — OneKey® MLS as Distributed by MLS Grid
- 2013-09-19 Listed $279,000 OneKey® MLS as Distributed by MLS Grid
- 2013-04-05 Sold (Public Records) $162,000 Public Records
- 2013-03-29 Sold (MLS) $162,000 OneKey® MLS as Distributed by MLS Grid
- 2013-01-16 Listing Removed — OneKey® MLS as Distributed by MLS Grid
- 2012-03-07 Listed $199,000 OneKey® MLS as Distributed by MLS Grid
- 2011-07-15 Pending — OneKey® MLS as Distributed by MLS Grid
- 2011-04-27 Listed $199,000 OneKey® MLS as Distributed by MLS Grid
- 1981-01-01 Sold (Public Records) $42,000 Public Records
- 1979-08-01 Sold (Public Records) $28,000 Public Records
Property tax history
+4.0%/yrLatest (2024): $7,721 · -1.0% YoY. Source: county tax records.
Cash-flow waterfall
monthlySold comps — $/sqft
last 12 mo · ≤1 miLoading sold comps…