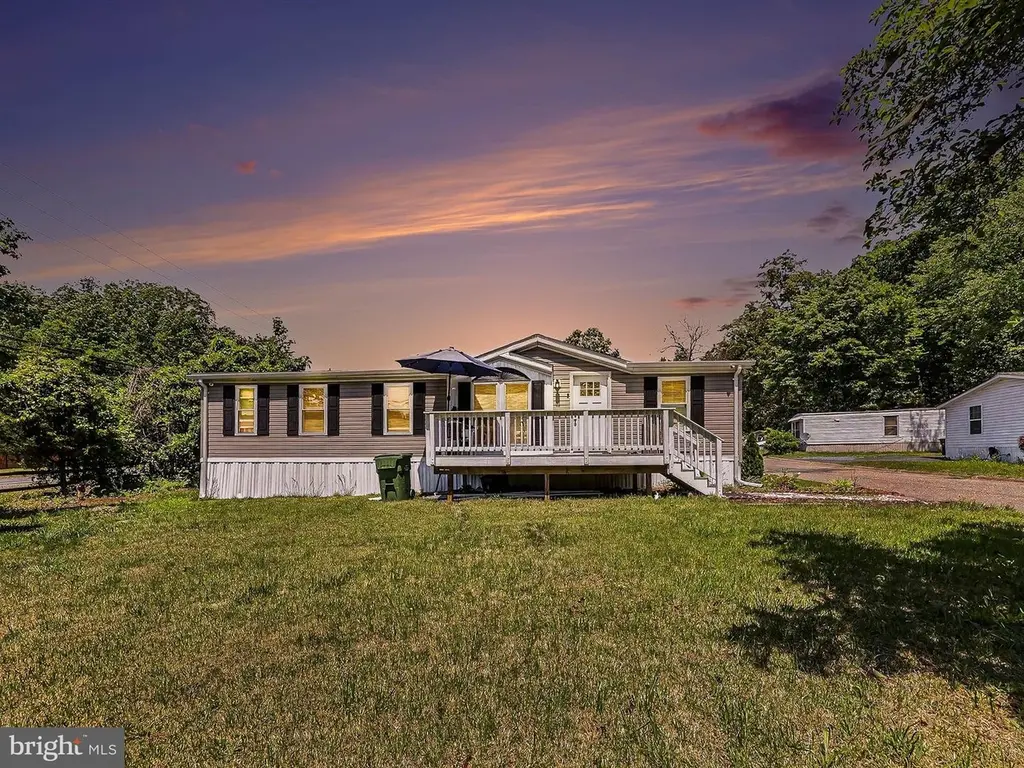
28 Castle Ct · Boswell's Corner, VA
Flood risk No data
- FEMA flood zone
- —
- Chance of flooding over 30 yrs
- —
- Est. flood insurance / yr
- —
Fire risk No data
- Est. fire insurance / yr
- —
Heat risk No data
- Hot days now (above threshold)
- —
- Hot days in 30 yrs
- —
Wind risk No data
- Chance of severe wind over 30 yrs
- —
Air-quality risk No data
- Unhealthy air days now
- —
- Unhealthy air days in 30 yrs
- —
Risk factors via First Street. Map © Google.
Why this score? — see what drove the B grade
The composite is a weighted blend of 9 inputs, each scored 0–100. Each bar is that input's sub-score; the figure is the points it added to the 100-point composite (weight × sub-score).
- Cash flow +30.0/30.0
- DSCR +10.0/10.0
- 1% rule +9.2/10.0
- ARV discount +7.5/15.0
- Schools +5.5/10.0
- Condition / age +4.0/5.0
- Rent growth +2.8/5.0
- Livability +2.5/5.0
- Appreciation +0.0/10.0
$158,000
🖨 Deal sheet (PDF) 📄 Offer letter ✓ Due diligence
Listing remarks
Beautifully renovated and move-in ready, 28 Castle Court offers affordable, stylish living in a convenient location! This updated 3-bedroom, 2-bath home features modern upgrades throughout, including gorgeous new quartz countertops, and a spacious open feel perfect for everyday living and entertaining. Step inside to a bright and welcoming layout with a large living room, dedicated dining area, and an updated kitchen complete with appliances included, LVP Flooring thought. The main-level laundry with washer and dryer adds extra convenience, making this home truly turn-key. Enjoy outdoor living on the spacious deck — perfect for relaxing, grilling, or entertaining friends and family. L
Key facts
- Move-in ready
- Quartz countertops
- Renovated
Tags
Property features AI
Finance
- Other: Property manager present; Pets allowed on a case-by-case basis; Not in a federal flood zone; Additional parcel(s) associated with the property
- Financial info: Monthly land lease: $850; Land lease has 100 years remaining; Annual ground rent listed in income/expense information
Exterior
- Parking: Four driveway parking spaces (total of 4 garage/parking spaces)
- Utilities: Community water; Community septic tank; Municipal trash service available; Water available; Electric utilities for heating, cooling, and hot water
- Home design: Manufactured double-wide home; Land lease ownership; Building not winterized; Effective/major remodel year 2025 (estimated)
- Construction: Mixed construction materials; Above-grade structures present
- Exterior features: Paved driveway; Shed on the property; Ground rent applies (paid annually)
Interior
- Kitchen: Cooktop; Dishwasher; Refrigerator
- Bedrooms: Three bedrooms on the main level
- Bathrooms: Two full bathrooms (both on the main level)
- Heating & cooling: Central heating (electric); Central air conditioning (electric)
- Interior features: Estimated living area; Two or more access exits
- Laundry & utility: Washer; Dryer; Electric hot water
Neighborhood map
What this means for you Summary
Snapshot
- This is a 3-bed/2.0-bath single-family listed at $158k. Condition is rated good.
Deal economics
- At list price, monthly cash flow is $686 ($8k/yr) — positive.
- The deal already cash-flows at list — no discount required.
- Meets the 1% rule at list price ($2k rent vs $158k).
- Recommended offer: $153k (3.0% below list) — sets the bar for market timing.
Location & tenants
- Location reads: area grade B — affects rentability + tenant quality, not the cash-flow math above.
- Stafford County Public School District (suburban): math 50% / reading 68% proficiency, ranked #42 of 131 in VA (top 32%) — acceptable for families but not a draw, mixed tenant base, ~2y average lease.
- Zoned schools: Widewater Elementary (math 41% / reading 57%, grade D, #782 of 1,108 statewide, top 71%, 626 students, 76% FRL); Shirley C. Heim Middle (math 26% / reading 50%, grade F, #313 of 342 statewide, top 92%, 980 students, 57% FRL); Brooke Point High (math 44% / reading 82%, grade B-, #223 of 319 statewide, top 70%, 2,150 students, 36% FRL) — zoned schools average 56% FRL vs 22% district-wide (35 pts higher); higher-poverty schools than district average — tighter screening recommended.
- Market conditions: Rents rising (+1.2%/yr); 344 active listings in the ZIP; 3 comparable units currently listed for rent nearby; rentals lingering (median 46d on market — plan ~5-8 weeks vacancy on turnover, expect pricing pressure); 67% of comp listings sitting > 30 days — soft ceiling on asking rent; high-income renter base; 361 units permitted in Stafford County in 2024 (0 in 5+ unit buildings).
- This rent is only 18% of the median local income ($151k/yr) — well below the 30% rent-burden line; pricing power to push rent on renewal without tenant pushback.
Forward outlook
- Local home prices are declining (-3.0%/yr); year-one equity from $1k of loan paydown is wiped out by about $5k of value loss. Plan a longer hold.
- Stafford County population projected at +39% by 2050 — long-run rental-demand tailwind backs the buy-and-hold thesis.
- At projected returns (-3.0% appreciation + 1.2% rent growth), your $44k cash investment doubles in ~8 years — after that, you're playing with house money.
Negotiation context
- It's been on market 33 days — a 3% lower offer ($153k) is reasonable based on typical stale-listing flexibility.
Questions for the listing agent
- It's been on market 33 days. Have you received any prior offers? Is the seller open to a 3% concession, seller financing, or rate buy-down credit?
- Is there a deadline driving the sale (1031 exchange, divorce, estate, relocation)? That informs how much negotiation room exists.
- What's the average days-on-market for RENTAL listings here right now (not sales)? A rising rental-DOM trend means longer vacancies and softer asking-rent achievability than the comps imply.
- What's the recent tenant-quality profile in this submarket — average credit score on applications, eviction rate, late-payment / NSF rate, and stable-employment percentage? A property-management company in the area should have these aggregated.
- How much new for-sale + rental construction is in the pipeline within 1–3 miles? Heavy new supply typically softens prices + rents 12–24 months out; constrained supply supports both.
Investment metrics
- 1% rule
- 1.42% ✓
- Cap rate
- 11.50%
- Cash-on-cash
- 18.60%
- DSCR
- 1.83
- GRM
- 5.9
CMA / ARV
- ARV (on-the-fly)
- $98,496
- Comps found
- 3
Show comp detail 3 sales within ~0.75 mi
| Address | Dist | Beds/Ba | Sqft | Sold | Price | $/sf | Match |
|---|---|---|---|---|---|---|---|
| 14 Robert St | 0.13mi | 3/2.0 | 1,300 (+7%) | 2mo | $90,000 | $69 | 81 |
| 22 Tracey St | 0.19mi | 3/2.0 | 1,232 (+1%) | 18mo | $100,000 | $81 | 74 |
| 27 Castle Ct | 0.02mi | 3/2.0 | 1,372 (+13%) | 15mo | $132,000 | $96 | 66 |
Match score weights: distance 35% · size 25% · config 20% · recency 20%. Top-matched comps best support the ARV.
Projected returns pro-forma
-3.0% appreciation · 1.21% rent growth · sell at horizon
- IRR
- 8.3%
- Equity multiple
- 1.32×
- Total profit
- $14,131
- Equity at exit
- $23,558
- IRR
- 16.0%
- Equity multiple
- 2.20×
- Total profit
- $52,927
- Equity at exit
- $13,661
Cash invested: $44,240 (down + closing). Projections, not guarantees.
Landlord ↔ Tenant lean methodology
- Overall (STATE)
- 55 Moderately Landlord-Leaning
- State Virginia
- 55 Moderately Landlord-Leaning · D+2
- County
- — inherits STATE
- City
- — inherits STATE
ZIP-level market 22554
- Rents YoY
- 1.2%
- Active inventory
- 344
- Price-to-rent
- 5.9×
Monthly cashflow live
- Estimated rent
- $2,250 medium interval (Pro) →
- Mortgage (P&I)
- −$829
- Tax est. 1.5%
- −$198 /mo · $2,370/yr
- Insurance
- −$66
- HOA
- −$0
- Vacancy / Maint / Mgmt
- −$473
- Net cashflow
- $686
Break-even live
Sensitivity live
| Price | -10% $795 | -5% $740 | +0% $686 | +5% $631 | +10% $577 |
|---|---|---|---|---|---|
| Rent | -10% $508 | -5% $597 | +0% $686 | +5% $775 | +10% $864 |
| Rate | -1.0pp $765 | -0.5pp $726 | base $686 | +0.5pp $645 | +1.0pp $603 |
UW: 25.0% down · 7.5% · 30yr · 1.5% tax · 5.0% vac · 8.0% maint · 8.0% mgmt
Financing live
Cash to close
- Down payment
- $39,500
- Closing costs
- $4,740
- Reserves months
- —
- Total cash needed
- —
Loan-product check · same deal, 3 products live
Conventional
25% down · 7.5% · 30yr
- Down + closing
- —
- Monthly P&I
- —
- Monthly cashflow
- —
- DSCR
- —
- Eligible?
- —
Personal DTI + credit; lowest rate.
DSCR
20% down · 8.5% · 30yr
- Down + closing
- —
- Monthly P&I
- —
- Monthly cashflow
- —
- DSCR
- —
- Eligible?
- —
No personal income docs; deal must DSCR.
Hard money
10% down · 12.0% · 12mo
- Down + closing
- —
- Monthly P&I
- —
- Monthly cashflow
- —
- DSCR
- —
- Eligible?
- —
Short-term bridge; refi at stabilization.
Rent comps 3 comps
| Address | Beds | Baths | Sqft | Rent | $/sqft | DOM | Units | Dist |
|---|---|---|---|---|---|---|---|---|
| 703 Kings Crest Dr Stafford, VA | 3.0 | 2.5 | 1280 | $2,100 | $1.64 | 45d | 1 | 0.78mi |
| 106 Wind Ridge Dr Stafford, VA | 2.0 | 1.5 | 902 | $1,700 | $1.88 | 22d | 1 | 0.91mi |
| 3354 Richmond Hwy Stafford, VA | 3.0 | 1.0 | 872 | $2,400 | $2.75 | 45d | 1 | 1.05mi |
Listing history 16 events
-
2026-06-21days on market $158,000 Active 33 DOM
-
2026-06-18days on market $158,000 Active 30 DOM
-
2026-06-17days on market $158,000 Active 29 DOM
-
2026-06-16days on market $158,000 Active 28 DOM
-
2026-06-15days on market $158,000 Active 27 DOM
-
2026-06-13days on market $158,000 Active 25 DOM
-
2026-06-13days on market $158,000 Active 24 DOM
-
2026-06-09days on market $158,000 Active 21 DOM
-
2026-06-08days on market $158,000 Active 20 DOM
-
2026-06-07days on market $158,000 Active 19 DOM
-
2026-06-04days on market $158,000 Active 16 DOM
-
2026-06-03days on market $158,000 Active 15 DOM
-
2026-06-02days on market $158,000 Active 14 DOM
-
2026-06-01days on market $158,000 Active 13 DOM
-
2026-05-31days on market $158,000 Active 12 DOM
-
2026-05-19$158,000 Active
ⓘ Source: listings_history table (triggers on properties + properties_extension) + one-shot
backfill from property_details.listing_events for pre-trigger history.
Nearby sold comps map
Loading sold comps map…
Walkable amenities ~0.75 mi
Loading nearby amenities…
Taxation est. · year 1
- Rental income
- $27,004
- − Mortgage interest
- −$8,850
- − Property taxes
- −$2,370
- − Insurance
- −$790
- − Repairs & maintenance
- −$2,160
- − Management
- −$2,160
- − Depreciation
- −$4,596
- Taxable income
- $6,076
- Est. tax owed @ 24.0%
- −$1,458
- After-tax cash flow
- $6,772/yr
For passive investors: Depreciation is non-cash, so a rental often shows a tax loss while cash-flowing — sheltering income. Rental losses are passive: they offset passive income freely, and up to $25,000/yr can offset ordinary (W-2) income if you actively participate and your MAGI is under $100k (phasing out to $0 by $150k); unused losses carry forward. On sale, claimed depreciation is recaptured at up to 25%, and gains may owe capital-gains tax (a 1031 exchange can defer both). Figures are a year-1 estimate at your 24.0% rate — not tax advice; consult a CPA.
Condition & rehab AI · 24 photos
This move-in ready home offers modern updates and a spacious layout, perfect for both resale and rental.
Value-add opportunities
- Resale Paint exterior trim — Enhances curb appeal and home value
- Rental Replace outdoor light fixtures — Improves property presentation for potential tenants
Renovation cost estimate screening
Value-add ROI direction
- Resale Paint exterior trim — Enhances curb appeal and home value ↑
- Rental Replace outdoor light fixtures — Improves property presentation for potential tenants ↑
ⓘ Cost ranges are severity-bucket heuristics (US national rule-of-thumb). Get contractor quotes + a written scope before underwriting a rehab budget.
Schools (NCES district)
- District
- Stafford County Public School District
- NCES district ID
- 5103660
- Math proficiency
- 50% ▼ -34.00%
- Reading proficiency
- 68% ▼ -11.00%
- Median HH income
- $96,389
- Composite
- 54.61/100
- National rank
- #1336
- State rank
- #42 of 131 in VA
Livability — Boswell's Corner
No livability data for this city. (Only ~50 U.S. cities are tracked.)
Census & demographics
- Census place
- Boswell's Corner, VA
- County
- Stafford County · 161,536 people
- Metro
- Washington-Arlington-Alexandria, DC-VA-MD-WV
- Population (ZIP)
- 65,494
- Household income
- $151,480
- Rent vs Own
- Severe rent burden
- 781.0
Population outlook (Stafford County) Hauer SSP2
- Today (2025)
- 169,882 people
- By 2030
- 183,934 · +8.3%
- By 2040
- 211,031 · +24.2%
- By 2050
- 235,391 · +38.6%
- By 2075
- 297,080 · +74.9%
- By 2100
- 334,680 · +97.0%
Race, ethnicity, and origin ACS 2023
- Neighborhood character
- Highly diverse neighborhood (Simpson 0.71)
- Race & ethnicity
- White 44% Black 26% Hispanic / Latino 17% Two or more races 12% Asian 5%
- Hispanic origin (detail)
- Mexican 4% Puerto Rican 2%
- Common ancestry
- Italian 3% Slovak 2% Lithuanian 2%
- Foreign-born
- 15% · Canada, South Korea, Jamaica
- Languages at home
- 80% English-only · Spanish 12% Other Indo-European 2% French/Haitian/Cajun 1%
Political lean MEDSL · Stafford
- 2024 margin
- Toss-up / Even · D 49.6% · R 48.8% · Other 1.5%
- 2008→2024 swing
- +7.1pp toward D · 2008: -6.3pp · 2024: 0.8pp
- All cycles
- 2024: D+0.8 2020: D+3.3 2016: R+9.1 2012: R+8.8 2008: R+6.3
Not yet ingested
- Civics
- —
Market trends
- HPI YoY
- ▼ -205.68%
- Current HPI
- 280.621
- Rent YoY
- ▲ 1.21%
- Metro
- Washington-Arlington-Alexandria, DC-VA-MD-WV
- State GDP YoY
- ▲ 2.40%
- F500 in state
- 50
Industry mix (Fortune 500 HQ in VA)
| Industry | F500 HQs | Revenue |
|---|---|---|
| Aerospace / Defense | 4 | $236B |
|
||
| Technology / Defense | 3 | $32B |
|
||
| Financial Services | 2 | $176B |
|
||
| Utilities | 2 | $27B |
|
||
| Insurance | 2 | $25B |
|
||
| Technology | 2 | $15B |
|
||
Price history
1 event — show timeline
- 2026-05-19 Listed $158,000 BRIGHT MLS
Cash-flow waterfall
monthlySold comps — $/sqft
last 12 mo · ≤1 miLoading sold comps…