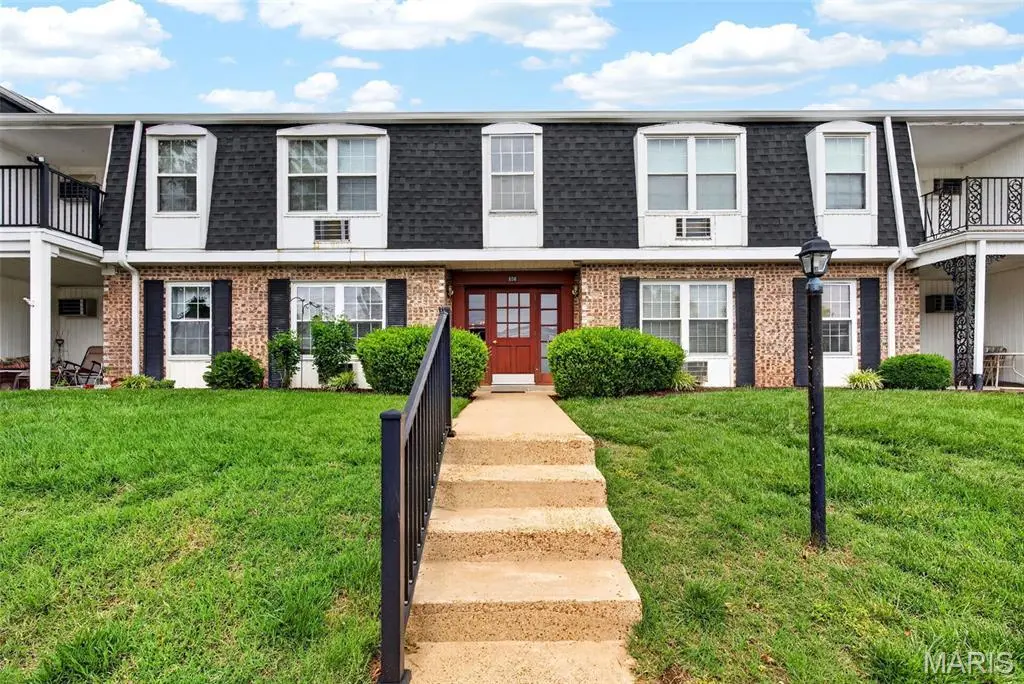
808 Dumont Pl Unit E · Lemay, MO
Flood risk 1/10 · Minimal
- FEMA flood zone
- X (unshaded)
- Chance of flooding over 30 yrs
- 0.0%
- Est. flood insurance / yr
- $507 – $1,088
Fire risk 1/10 · Minimal
- Est. fire insurance / yr
- $1,054 – $1,958
Heat risk 5/10 · Moderate
- Hot days now (above 108°F)
- 7 days/yr
- Hot days in 30 yrs
- 21 days/yr
Wind risk 2/10 · Minimal
- Chance of severe wind over 30 yrs
- 1.0%
Air-quality risk 3/10 · Minor
- Unhealthy air days now
- 2 days/yr
- Unhealthy air days in 30 yrs
- 3 days/yr
Risk factors via First Street. Map © Google.
Why this score? — see what drove the D grade
The composite is a weighted blend of 9 inputs, each scored 0–100. Each bar is that input's sub-score; the figure is the points it added to the 100-point composite (weight × sub-score).
- Cash flow +10.2/30.0
- 1% rule +9.2/10.0
- ARV discount +7.5/15.0
- Condition / age +3.8/5.0
- Schools +3.5/10.0
- Livability +3.4/5.0
- DSCR +2.9/10.0
- Rent growth +2.5/5.0
- Appreciation +0.0/10.0
$65,000
🖨 Deal sheet 📄 Offer letter ✓ Due diligence
Listing remarks
Beautifully updated condo for sale in the beautifully maintained Parc Lorraine community, featuring a private covered composite balcony, abundant storage, and a spacious open-concept layout designed for modern living. This move-in ready home offers oversized closets, updated electrical, a brand new roof, and a bright living and dining area perfect for relaxing or entertaining. Enjoy seamless indoor-outdoor living with balcony access from both the bedroom and kitchen, filling the spaces with natural light and fresh air. The updated kitchen features a convenient breakfast bar, ample cabinet storage, and generous counter space ideal for everyday living and hosting guests. Additional highlights
Key facts
- $315 HOA
- Parking
- Community pool
Property features AI
Finance
- Other: In-ground outdoor pool available in the community
- HOA & community: HOA: Parc Lorraine; Monthly HOA fee; Community clubhouse; Community pool; HOA covers clubhouse, grounds maintenance, parking/road maintenance, pool, sewer, snow removal, trash, and water
Exterior
- Parking: Assigned parking (1 space)
- Utilities: Public water; Public sewer; Electric service (other)
- Home design: Residential condominium; One level
- Construction: Brick construction
- Exterior features: Composite covered porch/patio; Panel doors; Level lot
Interior
- Kitchen: Electric oven and range; Dishwasher; Garbage disposal; Refrigerator
- Bedrooms: One bedroom on the main level
- Flooring: Carpet; Ceramic tile
- Bathrooms: One full bathroom on the main level
- Heating & cooling: Baseboard heating (electric); Wall/window air conditioner(s)
- Interior features: Dishwasher; Disposal; Electric oven; Electric range; Refrigerator; Carpet flooring; Ceramic tile flooring; Wall/window air conditioning unit(s)
Neighborhood map
What this means for you Summary
Snapshot
- This is a 1-bed/1.0-bath condo listed at $65k. Condition is rated good.
Deal economics
- At list price, monthly cash flow is $-37 ($-448/yr) — negative.
- To cash-flow at today's rent, offer at most $60k (8.3% below list).
- Meets the 1% rule at list price ($920 rent vs $65k).
- Recommended offer: $60k (8.3% below list) — sets the bar for cash-flow.
Location & tenants
- Location reads 67/100 on livability (#213 in MO) — a middle-class / working-renter tenant base. Strengths: cost of living A+, housing A+; Watch: employment C-, health & safety C-, crime F.
- Mehlville R-IX (suburban): math 31% / reading 48% proficiency, ranked #126 of 324 in MO (top 39%) — families likely to look elsewhere, expect single-tenant / working-renter base with shorter leases.
- Zoned schools: Forder Elem. (math 22% / reading 27%, grade F, #879 of 1,115 statewide, top 81%, 363 students, 52% FRL); Mehlville High School (math 26% / reading 54%, grade F, #243 of 521 statewide, top 47%, 1,440 students, 43% FRL) — zoned schools average 47% FRL vs 22% district-wide (25 pts higher); higher-poverty schools than district average — tighter screening recommended.
- Market conditions: 146 active listings in the ZIP; 9 comparable units currently listed for rent nearby; rentals at typical pace (median 18d on market — plan ~3-4 weeks tenant-placement turnaround); 920 units permitted in St. Louis County in 2024 (250 in 5+ unit buildings).
- This rent is only 18% of the median local income ($62k/yr) — well below the 30% rent-burden line; pricing power to push rent on renewal without tenant pushback.
Forward outlook
- Local home prices are declining (-3.0%/yr); year-one equity from $449 of loan paydown is wiped out by about $2k of value loss. Plan a longer hold.
Negotiation context
- It's been on market 22 days — a 2% lower offer ($64k) is reasonable based on typical stale-listing flexibility.
- 2 sale attempts; this cycle's ask has dropped $5k (7%) from the opening price — seller is motivated, your offer sets the floor, not the list.
Risks & watch-outs
- Watch-outs: HOA is 34% of rent.
- Climate carrying-cost: extreme-heat days projected 7→21/yr by 2055 (HVAC capex compounding) — expect insurance premiums to compound above CPI over the hold.
Questions for the listing agent
- What do current leases actually rent for vs. the listed asking? Can we see a recent rent roll and the last 12 months of T-12 income?
- Built in 1968 — when were the roof, HVAC, electrical panel, plumbing, and water heater last replaced?
- What does the HOA fee cover, when was the last increase, and are there any pending special assessments or reserve-fund shortfalls?
- Any open or pending special assessments — roof, HVAC, plumbing, elevator, façade? What's the per-unit balance and payoff schedule, and is the seller paying it off at close or rolling it to the buyer?
- Is there a deadline driving the sale (1031 exchange, divorce, estate, relocation)? That informs how much negotiation room exists.
- Schools are D-rated, which usually means shorter tenancies and higher turnover. Who's the typical renter profile here, and what's been the actual vacancy rate?
- Crime grade is F in this area — have there been break-ins, vandalism, or insurance claims at this property in the last 3 years? What carrier currently insures it and at what premium?
- The area grade is low — what's the realistic commute time and amenity access for the typical tenant pool here? Any planned neighborhood developments (good or bad) we should know about?
- What's the average days-on-market for RENTAL listings here right now (not sales)? A rising rental-DOM trend means longer vacancies and softer asking-rent achievability than the comps imply.
- What's the recent tenant-quality profile in this submarket — average credit score on applications, eviction rate, late-payment / NSF rate, and stable-employment percentage? A property-management company in the area should have these aggregated.
- How much new apartment / multifamily construction is in the pipeline within 1–3 miles? Heavy new supply (>2% of stock underway) typically softens rents 12–24 months out; light construction supports rent growth.
Investment metrics
- 1% rule
- 1.42% ✓
- Cap rate
- 5.60%
- Cash-on-cash
- -2.46%
- DSCR
- 0.89
- GRM
- 5.9
CMA / ARV
No comps found within radius.
Projected returns pro-forma
-3.0% appreciation · 3.0% rent growth · sell at horizon
- IRR
- -19.9%
- Equity multiple
- 0.30×
- Total profit
- $-12,701
- Equity at exit
- $9,692
- IRR
- -12.1%
- Equity multiple
- 0.27×
- Total profit
- $-13,276
- Equity at exit
- $5,620
Cash invested: $18,200 (down + closing). Projections, not guarantees.
Landlord ↔ Tenant lean methodology
- Overall (STATE)
- 81 Strongly Landlord-Friendly
- State Missouri
- 81 Strongly Landlord-Friendly · R+10
- County
- — inherits STATE
- City
- — inherits STATE
ZIP-level market 63125
- Active inventory
- 146
- Price-to-rent
- 5.9×
Monthly cashflow live
- Estimated rent
- $920 high interval (Pro) →
- Mortgage (P&I)
- −$341
- Tax est. 1.5%
- −$81 /mo · $975/yr
- Insurance
- −$27
- HOA
- −$315
- Vacancy / Maint / Mgmt
- −$193
- Net cashflow
- $-37
Break-even live
UW: 25.0% down · 7.5% · 30yr · 1.5% tax · 5.0% vac · 8.0% maint · 8.0% mgmt
Financing live
Cash to close
- Down payment
- $16,250
- Closing costs
- $1,950
- Reserves months
- —
- Total cash needed
- —
Loan-product check · same deal, 3 products live
Conventional
25% down · 7.5% · 30yr
- Down + closing
- —
- Monthly P&I
- —
- Monthly cashflow
- —
- DSCR
- —
- Eligible?
- —
Personal DTI + credit; lowest rate.
DSCR
20% down · 8.5% · 30yr
- Down + closing
- —
- Monthly P&I
- —
- Monthly cashflow
- —
- DSCR
- —
- Eligible?
- —
No personal income docs; deal must DSCR.
Hard money
10% down · 12.0% · 12mo
- Down + closing
- —
- Monthly P&I
- —
- Monthly cashflow
- —
- DSCR
- —
- Eligible?
- —
Short-term bridge; refi at stabilization.
Rent comps 9 comps
| Address | Beds | Baths | Sqft | Rent | $/sqft | DOM | Units | Dist |
|---|---|---|---|---|---|---|---|---|
| 274 Kingston Dr St. Louis, MO | 2.0 | 1.0 | 522 | $999 | $1.91 | 1d | 4 | 0.80mi |
| 9982 S Broadway Unit 4R St. Louis, MO | — | 1.0 | 500 | $675 | $1.35 | 43d | 1 | 0.82mi |
| 9982 S Broadway Unit 5R St. Louis, MO | — | 1.0 | 500 | $650 | $1.30 | 23d | 1 | 0.82mi |
| 9982 S Broadway Unit 3L St. Louis, MO | — | 1.0 | 500 | $650 | $1.30 | 16d | 1 | 0.82mi |
| 9982 S Broadway Unit 2R St. Louis, MO | — | 1.0 | 500 | $685 | $1.37 | 43d | 1 | 0.82mi |
| 315 Sigsbee Ave Saint Louis, MO | 2.0 | 1.0 | 700 | $850 | $1.21 | 21d | 1 | 0.93mi |
| 1908 Via Veneto Dr St. Louis, MO | 1.0–2.0 | 1.0 | 800 | $929 | $1.16 | 2d | 3 | 1.15mi |
| 2819 Lemay Ferry Rd Unit B St. Louis, MO | 1.0 | 1.0 | 650 | $950 | $1.46 | 17d | 1 | 1.32mi |
| 2819 Lemay Ferry Rd Apt E St. Louis, MO | 1.0 | 1.0 | 700 | $925 | $1.32 | 17d | 1 | 1.32mi |
HOA detail condo
- Monthly dues
- $315 · $3,780/yr
- Likely covers
- electric
- Assessments
- None detected in remarks — confirm with the listing agent.
Listing history 18 events
-
2026-06-19price $65,000 Active 22 DOM
-
2026-06-18days on market $69,900 Active 22 DOM
-
2026-06-17days on market $69,900 Active 21 DOM
-
2026-06-16days on market $69,900 Active 20 DOM
-
2026-06-15days on market $69,900 Active 19 DOM
-
2026-06-13days on market $69,900 Active 17 DOM
-
2026-06-09days on market $69,900 Active 13 DOM
-
2026-06-08days on market $69,900 Active 12 DOM
-
2026-06-07days on market $69,900 Active 11 DOM
-
2026-06-03days on market $69,900 Active 7 DOM
-
2026-06-02days on market $69,900 Active 6 DOM
-
2026-06-01days on market $69,900 Active 5 DOM
-
2026-05-31days on market $69,900 Active 4 DOM
-
2026-05-28$69,900 Active
-
2026-05-28historical $69,900
-
2025-07-18price $69,900
-
2025-06-03$74,500 Active
-
2025-05-30historical
ⓘ Source: listings_history table (triggers on properties + properties_extension) + one-shot
backfill from property_details.listing_events for pre-trigger history.
Climate risk First Street
- Flood 1/10 Low FEMA zone X (unshaded) · 0% chance over 30 yrs
- Wildfire 1/10 Low
- Heat 5/10 Major 7 d/yr ≥108°F today · 21 d/yr by 30 yrs out
- Wind 2/10 Low 100% chance of damaging wind over 30 yrs
- Air quality 3/10 Moderate 2 unhealthy d/yr today · 3 by 30 yrs out
Nearby sold comps map
Loading sold comps map…
Walkable amenities ~0.75 mi
Loading nearby amenities…
Taxation est. · year 1
- Rental income
- $11,042
- − Mortgage interest
- −$3,641
- − Property taxes
- −$975
- − Insurance
- −$325
- − Repairs & maintenance
- −$883
- − Management
- −$883
- − HOA
- −$3,780
- − Depreciation
- −$1,891
- Taxable loss
- −$1,337
- Est. tax savings @ 24.0%
- +$321
- After-tax cash flow
- $-127/yr
For passive investors: Depreciation is non-cash, so a rental often shows a tax loss while cash-flowing — sheltering income. Rental losses are passive: they offset passive income freely, and up to $25,000/yr can offset ordinary (W-2) income if you actively participate and your MAGI is under $100k (phasing out to $0 by $150k); unused losses carry forward. On sale, claimed depreciation is recaptured at up to 25%, and gains may owe capital-gains tax (a 1031 exchange can defer both). Figures are a year-1 estimate at your 24.0% rate — not tax advice; consult a CPA.
Condition & rehab AI · 12 photos
This move-in ready condo in Parc Lorraine community offers a good condition with minor cosmetic updates needed, particularly in the kitchen and exterior. The property's location and amenities make it a solid investment opportunity.
Repairs flagged
- Minor kitchen cabinets — can be replaced with modern ones
- Minor kitchen backsplash — can be updated with a more modern design
Value-add opportunities
- Both kitchen renovation — modernizing the kitchen can increase both resale and rental value
- Both exterior paint — fresh paint can enhance curb appeal and property value
- Both landscaping — improved landscaping can increase both resale and rental value
Renovation cost estimate screening
| Repair item | Severity | Est. cost |
|---|---|---|
| kitchen cabinets · can be replaced with modern ones | Minor | $500–3,000 |
| kitchen backsplash · can be updated with a more modern design | Minor | $500–3,000 |
| Total estimated repair cost · 2 items | $1,000–6,000 |
Value-add ROI direction
- Both kitchen renovation — modernizing the kitchen can increase both resale and rental value ↑
- Both exterior paint — fresh paint can enhance curb appeal and property value ↑
- Both landscaping — improved landscaping can increase both resale and rental value ↑
ⓘ Cost ranges are severity-bucket heuristics (US national rule-of-thumb). Get contractor quotes + a written scope before underwriting a rehab budget.
Schools (NCES district)
- District
- Mehlville R-IX
- NCES district ID
- 2920670
- Math proficiency
- 31% ▼ -14.00%
- Reading proficiency
- 48% ▼ -5.00%
- Median HH income
- $62,254
- Composite
- 35.19/100
- National rank
- #4995
- State rank
- #126 of 324 in MO
Livability — Lemay
- Score
- 67/100
- State rank
- #213
- US rank
- #10652
Category grades
Schools grade is shown separately in the Schools card above.
Census & demographics
- Census place
- Lemay, MO
- County
- Saint Louis County · 888,823 people
- City population
- 33,294
- Metro
- St. Louis, MO-IL
- Population (ZIP)
- 33,294
- Household income
- $61,624
- Rent vs Own
- Severe rent burden
- 631.0
Population outlook (St. Louis County) Hauer SSP2
- Today (2025)
- 1,025,227 people
- By 2030
- 1,028,023 · +0.3%
- By 2040
- 1,020,940 · -0.4%
- By 2050
- 1,007,280 · -1.8%
- By 2075
- 987,277 · -3.7%
- By 2100
- 921,984 · -10.1%
Race, ethnicity, and origin ACS 2023
- Neighborhood character
- Predominantly White (86%)
- Race & ethnicity
- White 86% Two or more races 5% Black 4% Hispanic / Latino 4% Asian 2%
- Common ancestry
- American 9% Romanian 3% Lithuanian 3%
- Foreign-born
- 14% · Canada, Vietnam
- Languages at home
- 83% English-only · Russian/Polish/Slavic 11% Spanish 3% Vietnamese 1%
Political lean MEDSL · St. Louis
- 2024 margin
- Strong D (+23.4) · D 60.8% · R 37.4% · Other 1.7%
- 2008→2024 swing
- +3.5pp toward D · 2008: 19.9pp · 2024: 23.4pp
- All cycles
- 2024: D+23.4 2020: D+24.0 2016: D+16.2 2012: D+13.7 2008: D+19.9
Not yet ingested
- Civics
- —
Market trends
- HPI YoY
- ▼ -173.27%
- Current HPI
- 234.3792
- Rent YoY
- —
- Metro
- St. Louis, MO-IL
- State GDP YoY
- ▲ 1.84%
- F500 in state
- 20
Industry mix (Fortune 500 HQ in MO)
| Industry | F500 HQs | Revenue |
|---|---|---|
| Healthcare | 1 | $163B |
|
||
| Insurance | 1 | $21B |
|
||
| Industrial Technology | 1 | $17B |
|
||
| Retail | 1 | $16B |
|
||
| Industrial Distribution | 1 | $10B |
|
||
| Utilities | 1 | $9B |
|
||
Price history
-6.2% since first listed5 events — show timeline
- 2026-05-28 Listed $69,900 MARIS as Distributed by MLS Grid
- 2026-05-28 Coming Soon $69,900 MARIS as Distributed by MLS Grid
- 2025-07-18 Price Changed $69,900 MARIS as Distributed by MLS Grid
- 2025-06-03 Listed $74,500 MARIS as Distributed by MLS Grid
- 2025-05-30 Coming Soon — MARIS as Distributed by MLS Grid
Cash-flow waterfall
monthlySold comps — $/sqft
last 12 mo · ≤1 miLoading sold comps…