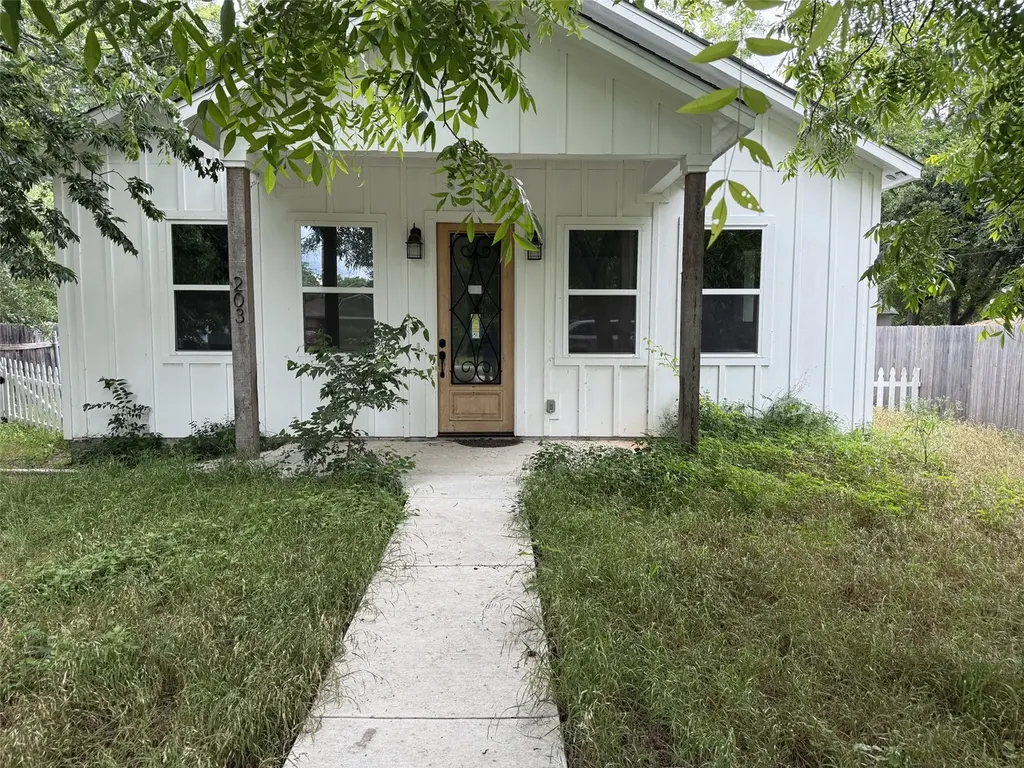
203 Vernon St Unit A · Thrall, TX
Flood risk 1/10 · Minimal
- FEMA flood zone
- X (unshaded)
- Chance of flooding over 30 yrs
- 0.0%
- Est. flood insurance / yr
- $507 – $1,088
Fire risk 3/10 · Minor
- Est. fire insurance / yr
- $1,222 – $2,270
Heat risk 8/10 · Major
- Hot days now (above 108°F)
- 6 days/yr
- Hot days in 30 yrs
- 20 days/yr
Wind risk 8/10 · Major
- Chance of severe wind over 30 yrs
- 80.0%
Air-quality risk 1/10 · Minimal
- Unhealthy air days now
- 0 days/yr
- Unhealthy air days in 30 yrs
- 0 days/yr
Risk factors via First Street. Map © Google.
Why this score? — see what drove the B- grade
The composite is a weighted blend of 9 inputs, each scored 0–100. Each bar is that input's sub-score; the figure is the points it added to the 100-point composite (weight × sub-score).
- Cash flow +20.9/30.0
- ARV discount +15.0/15.0
- 1% rule +7.4/10.0
- DSCR +6.7/10.0
- Appreciation +6.3/10.0
- Schools +4.9/10.0
- Livability +3.4/5.0
- Rent growth +2.5/5.0
- Condition / age +2.5/5.0
$153,000
🖨 Deal sheet (PDF) 📄 Offer letter ✓ Due diligence
Listing remarks
The list price is not indicative of seller's final reserve amount. This property is part of an online bidding event; please visit Auction.com to place bids. Inspections of this property and contact with occupants are strictly prohibited. Property is sold "as is" and no for sale sign allowed. List price is minimum starting bid amount. Seller, listing agent and broker have no firsthand knowledge about any features or condition of the property. Available information was gathered from other sources. No existing survey. No Sellers Disclosure. Auction dates 06/21 - 06/23
Key facts
- 6,359 sq ft lot
- 2 parking spots
- Built 2021
Property features AI
Finance
- Other: Solar panels with photovoltaic power production; Insulation (energy efficient features)
- HOA & community: Playground in the community
Exterior
- Parking: Gravel parking; 2 parking spaces
- Utilities: Electricity connected; Public water; Public sewer
- Home design: Single-story home; Resale property; Faces west; Slab foundation
- Construction: HardiPlank exterior; Composition roof; Built according to public records
- Exterior features: Deck; Exterior steps; Exterior lighting; RV hookup; Shed(s) and storage; Wood fencing in back yard; Landscaped yard with few large trees; Alley access; Front and back yard, level lot
Interior
- Kitchen: Dishwasher; Electric oven; Electric range; Disposal; Microwave
- Bedrooms: 2 main-level bedrooms
- Flooring: Concrete
- Bathrooms: 2 full bathrooms
- Heating & cooling: Central heating (electric); Central air; Ceiling fans
- Interior features: Breakfast bar; Ceiling fan(s); High ceilings; Kitchen island; No interior steps; Pantry; Quartz counters; Vaulted ceiling(s); Walk-in closet(s); Double pane vinyl windows; Concrete flooring; Main level primary bedroom
- Laundry & utility: Inside laundry room on main level; Washer hookup; Electric dryer hookup
Neighborhood map
What this means for you Summary
Snapshot
- This is a 2-bed/2.0-bath single-family listed at $153k.
Deal economics
- At list price, monthly cash flow is $214 ($3k/yr) — positive.
- The deal already cash-flows at list — no discount required.
- Meets the 1% rule at list price ($2k rent vs $153k).
Location & tenants
- Location reads 68/100 on livability (#492 in TX) — a middle-class / working-renter tenant base. Strengths: crime A+, cost of living A+, housing A+; Watch: amenities F, commute F, health & safety F.
- Thrall ISD (rural): math 57% / reading 56% proficiency, ranked #89 of 826 in TX (top 11%) — acceptable for families but not a draw, mixed tenant base, ~2y average lease.
- Zoned schools: Thrall El (math 47% / reading 57%, grade C-, #742 of 4,322 statewide, top 19%, 322 students, 46% FRL); Thrall Middle (math 63% / reading 57%, grade B, #158 of 1,662 statewide, top 10%, 243 students, 32% FRL); Thrall H S (math 52% / reading 57%, grade C-, #379 of 1,632 statewide, top 26%, 254 students, 29% FRL) — zoned schools at 36% FRL track the district average.
- Market conditions: 58 active listings in the ZIP; 1 comparable units currently listed for rent nearby; 7,543 units permitted in Williamson County in 2024 (1,425 in 5+ unit buildings).
Forward outlook
- In year one you build about $5k of equity ($1k loan paydown + $4k appreciation (2.6% local appreciation)).
- Williamson County population projected at +69% by 2050 — long-run rental-demand tailwind backs the buy-and-hold thesis.
- At projected returns (2.6% appreciation + 3.0% rent growth), your $43k cash investment doubles in ~5 years — after that, you're playing with house money.
- By year 7, paydown + projected appreciation supports a ~$32k cash-out refi (75% LTV) — recoverable capital for the next deal without selling this one.
Negotiation context
- Only 10 days on market — expect competitive offers; lowballing is unlikely to land.
- 4 sale attempts since 4y ago with the ask held roughly flat each time — persistent listings suggest the price (not the market) is what's stuck; bring a comps-based counter.
Risks & watch-outs
- Watch-outs: property tax is 3.3% of price.
- Climate carrying-cost: severe wind risk, 80% chance of damaging wind over 30y; extreme-heat days projected 6→20/yr by 2055 (HVAC capex compounding) — expect insurance premiums to compound above CPI over the hold.
Questions for the listing agent
- Property tax is high relative to price — has the assessment been appealed recently, and will the sale trigger a re-assessment?
- Is there a deadline driving the sale (1031 exchange, divorce, estate, relocation)? That informs how much negotiation room exists.
- What's the average days-on-market for RENTAL listings here right now (not sales)? A rising rental-DOM trend means longer vacancies and softer asking-rent achievability than the comps imply.
- What's the recent tenant-quality profile in this submarket — average credit score on applications, eviction rate, late-payment / NSF rate, and stable-employment percentage? A property-management company in the area should have these aggregated.
- How much new for-sale + rental construction is in the pipeline within 1–3 miles? Heavy new supply typically softens prices + rents 12–24 months out; constrained supply supports both.
Investment metrics
- 1% rule
- 1.24% ✓
- Cap rate
- 7.97%
- Cash-on-cash
- 5.99%
- DSCR
- 1.27
- GRM
- 6.7
CMA / ARV
- ARV (on-the-fly)
- $244,650
- Comps found
- 1
Show comp detail 1 sale within ~0.75 mi
| Address | Dist | Beds/Ba | Sqft | Sold | Price | $/sf | Match |
|---|---|---|---|---|---|---|---|
| 506 S Main St | 0.22mi | 2/1.0 | 964 (-8%) | 12mo | $224,500 | $233 | 62 |
Match score weights: distance 35% · size 25% · config 20% · recency 20%. Top-matched comps best support the ARV.
Projected returns pro-forma
2.65% appreciation · 3.0% rent growth · sell at horizon
- IRR
- 12.2%
- Equity multiple
- 1.69×
- Total profit
- $29,401
- Equity at exit
- $65,802
- IRR
- 14.6%
- Equity multiple
- 3.09×
- Total profit
- $89,392
- Equity at exit
- $99,141
Cash invested: $42,840 (down + closing). Projections, not guarantees.
Landlord ↔ Tenant lean methodology
- Overall (STATE)
- 87 Strongly Landlord-Friendly
- State Texas
- 87 Strongly Landlord-Friendly · R+5
- County
- — inherits STATE
- City
- — inherits STATE
ZIP-level market 76578
- Home prices YoY
- 1.2%
- Active inventory
- 58
- Price-to-rent
- 6.7×
Monthly cashflow live
- Estimated rent
- $1,900 medium interval (Pro) →
- Mortgage (P&I)
- −$802
- Tax from tax record
- −$421 /mo · $5,054/yr
- Insurance
- −$64
- HOA
- −$0
- Vacancy / Maint / Mgmt
- −$399
- Net cashflow
- $214
Break-even live
Sensitivity live
| Price | -10% $300 | -5% $257 | +0% $214 | +5% $170 | +10% $127 |
|---|---|---|---|---|---|
| Rent | -10% $64 | -5% $139 | +0% $214 | +5% $289 | +10% $364 |
| Rate | -1.0pp $291 | -0.5pp $253 | base $214 | +0.5pp $174 | +1.0pp $134 |
UW: 25.0% down · 7.5% · 30yr · 1.5% tax · 5.0% vac · 8.0% maint · 8.0% mgmt
Financing live
Cash to close
- Down payment
- $38,250
- Closing costs
- $4,590
- Reserves months
- —
- Total cash needed
- —
Loan-product check · same deal, 3 products live
Conventional
25% down · 7.5% · 30yr
- Down + closing
- —
- Monthly P&I
- —
- Monthly cashflow
- —
- DSCR
- —
- Eligible?
- —
Personal DTI + credit; lowest rate.
DSCR
20% down · 8.5% · 30yr
- Down + closing
- —
- Monthly P&I
- —
- Monthly cashflow
- —
- DSCR
- —
- Eligible?
- —
No personal income docs; deal must DSCR.
Hard money
10% down · 12.0% · 12mo
- Down + closing
- —
- Monthly P&I
- —
- Monthly cashflow
- —
- DSCR
- —
- Eligible?
- —
Short-term bridge; refi at stabilization.
Rent comps 1 comps
| Address | Beds | Baths | Sqft | Rent | $/sqft | DOM | Units | Dist |
|---|---|---|---|---|---|---|---|---|
| 308 Lydia Ln Thrall, TX | 3.0 | 2.0 | 1355 | $1,900 | $1.40 | 0d | 1 | 0.24mi |
Listing history 7 events
-
2026-06-21days on market $153,000 Active 10 DOM
-
2026-06-18days on market $153,000 Active 7 DOM
-
2026-06-17days on market $153,000 Active 6 DOM
-
2026-06-16days on market $153,000 Active 5 DOM
-
2026-06-15days on market $153,000 Active 4 DOM
-
2026-06-13remarks 571-char remark
-
2026-06-13$153,000 Active 2 DOM
ⓘ Source: listings_history table (triggers on properties + properties_extension) + one-shot
backfill from property_details.listing_events for pre-trigger history.
Tax reassessment forecast TX · Resets to sale price
- Current annual tax
- $5,054 · $421/mo
- Projected year-2 tax
- $5,054 · $421/mo
- Expected delta
- $0/yr ($0/mo · 0.0%)
ⓘ Screening estimate from a state-policy table — verify with the county assessor before closing.
Climate risk First Street
- Flood 1/10 Low FEMA zone X (unshaded) · 0% chance over 30 yrs
- Wildfire 3/10 Moderate
- Heat 8/10 Severe 6 d/yr ≥108°F today · 20 d/yr by 30 yrs out
- Wind 8/10 Severe 80% chance of damaging wind over 30 yrs
- Air quality 1/10 Low 0 unhealthy d/yr today · 0 by 30 yrs out
Nearby sold comps map
Loading sold comps map…
Walkable amenities ~0.75 mi
Loading nearby amenities…
Taxation est. · year 1
- Rental income
- $22,800
- − Mortgage interest
- −$8,570
- − Property taxes
- −$5,054
- − Insurance
- −$765
- − Repairs & maintenance
- −$1,824
- − Management
- −$1,824
- − Depreciation
- −$4,451
- Taxable income
- $312
- Est. tax owed @ 24.0%
- −$75
- After-tax cash flow
- $2,490/yr
For passive investors: Depreciation is non-cash, so a rental often shows a tax loss while cash-flowing — sheltering income. Rental losses are passive: they offset passive income freely, and up to $25,000/yr can offset ordinary (W-2) income if you actively participate and your MAGI is under $100k (phasing out to $0 by $150k); unused losses carry forward. On sale, claimed depreciation is recaptured at up to 25%, and gains may owe capital-gains tax (a 1031 exchange can defer both). Figures are a year-1 estimate at your 24.0% rate — not tax advice; consult a CPA.
Schools (NCES district)
- District
- Thrall ISD
- NCES district ID
- 4842660
- Math proficiency
- 57% ▼ -3.00%
- Reading proficiency
- 56% ▼ -1.00%
- Median HH income
- $54,801
- Composite
- 48.64/100
- National rank
- #2107
- State rank
- #89 of 826 in TX
Livability — Thrall
- Score
- 68/100
- State rank
- #492
- US rank
- #9735
Category grades
Schools grade is shown separately in the Schools card above.
Census & demographics
- Census place
- Thrall, TX
- Population (ZIP)
- 1,561
Population outlook (Williamson County) Hauer SSP2
- Today (2025)
- 699,027 people
- By 2030
- 795,537 · +13.8%
- By 2040
- 990,683 · +41.7%
- By 2050
- 1,184,292 · +69.4%
- By 2075
- 1,623,825 · +132.3%
- By 2100
- 1,924,153 · +175.3%
Race, ethnicity, and origin ACS 2023
- Neighborhood character
- Diverse neighborhood (Simpson 0.59)
- Race & ethnicity
- White 51% Hispanic / Latino 38% Two or more races 24% Native American 9% Black 1%
- Hispanic origin (detail)
- Mexican 36%
- Common ancestry
- Iranian 6% Serbian 5% Portuguese 2%
- Foreign-born
- 4% · Canada
- Languages at home
- 77% English-only · Spanish 22%
Political lean MEDSL · Williamson
- 2024 margin
- Toss-up / Even · D 48.0% · R 50.4% · Other 1.6%
- 2008→2024 swing
- +10.6pp toward D · 2008: -13.0pp · 2024: -2.5pp
- All cycles
- 2024: R+2.5 2020: D+1.4 2016: R+9.9 2012: R+21.5 2008: R+13.0
Not yet ingested
- Civics
- —
Market trends
- HPI YoY
- ▲ 2.65%
- Current HPI
- 227.9035
- Rent YoY
- —
- Metro
- —
- State GDP YoY
- ▲ 3.95%
- F500 in state
- 110
Industry mix (Fortune 500 HQ in TX)
| Industry | F500 HQs | Revenue |
|---|---|---|
| Energy | 16 | $1,198B |
|
||
| Technology | 5 | $198B |
|
||
| Engineering / Construction | 4 | $72B |
|
||
| Energy Services | 3 | $60B |
|
||
| Utilities | 3 | $41B |
|
||
| Healthcare | 2 | $330B |
|
||
Price history
-56.0% since first listed13 events — show timeline
- 2026-06-11 Listed $153,000 Unlock MLS
- 2024-11-17 Price Changed — Unlock MLS
- 2024-10-24 Price Changed — Unlock MLS
- 2024-09-09 Listed — Unlock MLS
- 2024-06-23 Price Changed — Unlock MLS
- 2024-06-01 Listed — Unlock MLS
- 2023-03-10 Sold (Public Records) — Public Records
- 2023-03-10 Sold (MLS) — Unlock MLS
- 2023-01-29 Contingent — Unlock MLS
- 2022-12-22 Price Changed $310,000 Unlock MLS
- 2022-11-28 Price Changed $320,000 Unlock MLS
- 2022-10-16 Listed $348,000 Unlock MLS
- 2018-10-09 Sold (Public Records) — Public Records
Property tax history
+11.7%/yrLatest (2026): $5,054 · -2.3% YoY. Source: county tax records.
Cash-flow waterfall
monthlySold comps — $/sqft
last 12 mo · ≤1 miLoading sold comps…