773 Eastern Pkwy Unit 1A · New York, NY
Flood risk 1/10 · Minimal
- FEMA flood zone
- X (unshaded)
- Chance of flooding over 30 yrs
- 0.0%
- Est. flood insurance / yr
- $507 – $1,088
Fire risk 1/10 · Minimal
- Est. fire insurance / yr
- $691 – $1,283
Heat risk 6/10 · Moderate
- Hot days now (above 99°F)
- 7 days/yr
- Hot days in 30 yrs
- 14 days/yr
Wind risk 6/10 · Moderate
- Chance of severe wind over 30 yrs
- 64.0%
Air-quality risk 5/10 · Moderate
- Unhealthy air days now
- 6 days/yr
- Unhealthy air days in 30 yrs
- 8 days/yr
Risk factors via First Street. Map © Google.
Why this score? — see what drove the C grade
The composite is a weighted blend of 9 inputs, each scored 0–100. Each bar is that input's sub-score; the figure is the points it added to the 100-point composite (weight × sub-score).
- Cash flow +13.2/30.0
- Appreciation +10.0/10.0
- ARV discount +7.5/15.0
- 1% rule +6.1/10.0
- Schools +5.0/10.0
- DSCR +4.0/10.0
- Rent growth +4.0/5.0
- Livability +3.8/5.0
- Condition / age +2.5/5.0
$300,000
🖨 Deal sheet (PDF) 📄 Offer letter ✓ Due diligence
Listing remarks
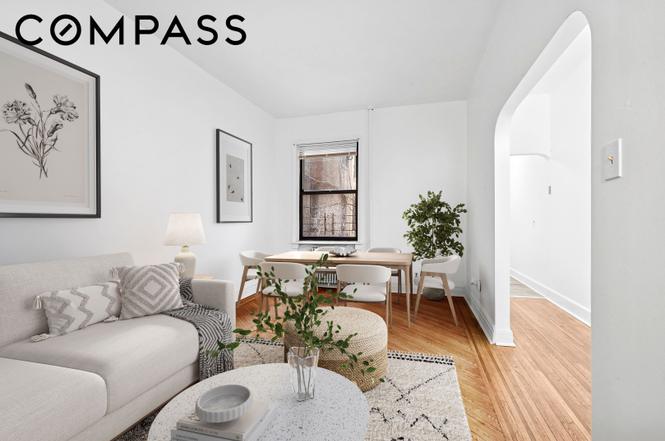
Welcome to 773 Eastern Parkway #1A — a true buyer’s paradise in the heart of Crown Heights, set along one of Brooklyn’s most iconic, tree-lined boulevards. This spacious, 1-bedroom, 1-bath first-floor residence offers the perfect balance of classic charm and everyday functionality with great storage. A gracious entry hallway welcomes you into a beautifully connected layout featuring large, well-proportioned rooms, hardwood floors, and large windows that fill the home with natural light. The apartment's layout creates distinct yet open living and dining areas, ideal for both entertaining and comfortable daily living. There’s also an A/C option for added comfort and th
Key facts
- Large windows
- Natural light
- A/c option
Tags
Property features AI
Finance
- Other: Building contains 16 total units; Pets allowed: cats and dogs permitted
- HOA & community: Monthly association fee of $569
Exterior
- Home design: 4-story building; Entry at level 1
- Exterior features: East and west exposures
Interior
- Bedrooms: 3 total rooms (includes bedrooms and living spaces)
- Flooring: Hardwood flooring
- Bathrooms: 1 full bathroom
- Heating & cooling: Wall furnace heating; Wall unit cooling
- Interior features: Unfurnished; High ceilings; Intercom
- Laundry & utility: Common laundry on the floor in a shared common area
Neighborhood map
What this means for you Summary
Snapshot
- This is a 1-bed/1.0-bath condo listed at $300k.
Deal economics
- At list price, monthly cash flow is $-4 ($-52/yr) — negative.
- To cash-flow at today's rent, offer at most $299k (0.2% below list).
- Meets the 1% rule at list price ($3k rent vs $300k).
- Recommended offer: $264k (12.0% below list) — sets the bar for market timing.
- Cap rate 6.3% vs local median 2.6% in New York — top-decile yield for the area; either an underpriced asset or a hidden risk that comps aren't pricing in. Stress-test before assuming the spread holds.
Location & tenants
- Location reads 75/100 on livability (#268 in NY, #4,188 nationally) — a middle-class / working-renter tenant base. Strengths: amenities A+, commute A+, health & safety A; Watch: crime F, cost of living F.
- Zoned schools: Elm Tree Elementary School (math 27% / reading 52%, grade F, #1,444 of 2,108 statewide, top 71%, 806 students, 94% FRL); Jhs 383 Philippa Schuyler (math 32% / reading 67%, grade C, #280 of 729 statewide, top 40%, 822 students, 85% FRL); Midwood High School (math 94% / reading 96%, grade A+, #83 of 1,100 statewide, top 8%, 4,062 students, 73% FRL).
- Market conditions: Rents rising fast (+6.0%/yr); 74 active listings in the ZIP; 40 comparable units currently listed for rent nearby; rentals at typical pace (median 27d on market — plan ~3-4 weeks tenant-placement turnaround); 10,063 units permitted in Kings County in 2024 (9,789 in 5+ unit buildings).
- At $3,339/mo this rent would consume 62% of the median local household income ($65k/yr) (locally 6603% of renters already pay >50% of income on rent) — very limited rent-growth headroom before tenants either downsize or default.
Forward outlook
- In year one you build about $32k of equity ($2k loan paydown + $30k appreciation (10.0% local appreciation)).
- Kings County population projected at +13% by 2050 — modest demand growth; plan on rents tracking national, not racing it.
- At projected returns (10.0% appreciation + 6.0% rent growth), your $84k cash investment doubles in ~3 years — after that, you're playing with house money.
- By year 2, paydown + projected appreciation supports a ~$52k cash-out refi (75% LTV) — recoverable capital for the next deal without selling this one.
Negotiation context
- It's been on market 127 days — a 12% lower offer ($264k) is reasonable based on typical stale-listing flexibility.
- 10 sale attempts since 2y ago; this cycle's ask is 13% above the opening price — seller raised mid-cycle; expect resistance to lowballs.
Risks & watch-outs
- Watch-outs: built in 1905 — expect roof / HVAC / electrical / plumbing capex.
- Climate carrying-cost: major wind risk, 64% chance of damaging wind over 30y; extreme-heat days projected 7→14/yr by 2055 (HVAC capex compounding) — expect insurance premiums to compound above CPI over the hold.
Questions for the listing agent
- What do current leases actually rent for vs. the listed asking? Can we see a recent rent roll and the last 12 months of T-12 income?
- It's been on market 127 days. Have you received any prior offers? Is the seller open to a 12% concession, seller financing, or rate buy-down credit?
- Built in 1905 — when were the roof, HVAC, electrical panel, plumbing, and water heater last replaced?
- What does the HOA fee cover, when was the last increase, and are there any pending special assessments or reserve-fund shortfalls?
- Any open or pending special assessments — roof, HVAC, plumbing, elevator, façade? What's the per-unit balance and payoff schedule, and is the seller paying it off at close or rolling it to the buyer?
- Why hasn't it sold? Are there any deal-killer items the seller is aware of (foundation, flood, title, zoning, code violations)?
- Is there a deadline driving the sale (1031 exchange, divorce, estate, relocation)? That informs how much negotiation room exists.
- Schools are B-rated — typically a magnet for longer-tenancy family renters. What's the average tenant stay here, and is there a school-zone premium baked into asking?
- Crime grade is F in this area — have there been break-ins, vandalism, or insurance claims at this property in the last 3 years? What carrier currently insures it and at what premium?
- What's the average days-on-market for RENTAL listings here right now (not sales)? A rising rental-DOM trend means longer vacancies and softer asking-rent achievability than the comps imply.
- What's the recent tenant-quality profile in this submarket — average credit score on applications, eviction rate, late-payment / NSF rate, and stable-employment percentage? A property-management company in the area should have these aggregated.
- How much new apartment / multifamily construction is in the pipeline within 1–3 miles? Heavy new supply (>2% of stock underway) typically softens rents 12–24 months out; light construction supports rent growth.
Investment metrics
- 1% rule
- 1.11% ✓
- Cap rate
- 6.28%
- Cash-on-cash
- -0.06%
- DSCR
- 1.00
- GRM
- 7.5
CMA / ARV
No comps found within radius.
Projected returns pro-forma
10.0% appreciation · 5.95% rent growth · sell at horizon
- IRR
- 25.6%
- Equity multiple
- 3.07×
- Total profit
- $173,714
- Equity at exit
- $270,264
- IRR
- 23.5%
- Equity multiple
- 7.38×
- Total profit
- $535,896
- Equity at exit
- $582,834
Cash invested: $84,000 (down + closing). Projections, not guarantees.
Landlord ↔ Tenant lean methodology
- Overall (CITY)
- 0 Strongly Tenant-Friendly
- State New York
- 15 Strongly Tenant-Friendly · D+10
- County
- — inherits STATE
- City New York
- 0 Strongly Tenant-Friendly · D+34
ZIP-level market 11213
- Home prices YoY
- 4.3%
- Rents YoY
- 6.0%
- Active inventory
- 74
- Price-to-rent
- 7.5×
Monthly cashflow live
- Estimated rent
- $3,339 high interval (Pro) →
- Mortgage (P&I)
- −$1,573
- Tax est. 1.5%
- −$375 /mo · $4,500/yr
- Insurance
- −$125
- HOA
- −$569
- Vacancy / Maint / Mgmt
- −$701
- Net cashflow
- $-4
Break-even live
Sensitivity live
| Price | -10% $203 | -5% $99 | +0% $-4 | +5% $-108 | +10% $-212 |
|---|---|---|---|---|---|
| Rent | -10% $-268 | -5% $-136 | +0% $-4 | +5% $128 | +10% $259 |
| Rate | -1.0pp $147 | -0.5pp $72 | base $-4 | +0.5pp $-82 | +1.0pp $-161 |
UW: 25.0% down · 7.5% · 30yr · 1.5% tax · 5.0% vac · 8.0% maint · 8.0% mgmt
Financing live
Cash to close
- Down payment
- $75,000
- Closing costs
- $9,000
- Reserves months
- —
- Total cash needed
- —
Loan-product check · same deal, 3 products live
Conventional
25% down · 7.5% · 30yr
- Down + closing
- —
- Monthly P&I
- —
- Monthly cashflow
- —
- DSCR
- —
- Eligible?
- —
Personal DTI + credit; lowest rate.
DSCR
20% down · 8.5% · 30yr
- Down + closing
- —
- Monthly P&I
- —
- Monthly cashflow
- —
- DSCR
- —
- Eligible?
- —
No personal income docs; deal must DSCR.
Hard money
10% down · 12.0% · 12mo
- Down + closing
- —
- Monthly P&I
- —
- Monthly cashflow
- —
- DSCR
- —
- Eligible?
- —
Short-term bridge; refi at stabilization.
Rent comps 40 comps
| Address | Beds | Baths | Sqft | Rent | $/sqft | DOM | Units | Dist |
|---|---|---|---|---|---|---|---|---|
| 1166 Saint Johns Pl Brooklyn, NY | 2.0 | 1.0 | — | $3,799 | — | 26d | 1 | 0.18mi |
| 1159 Saint Johns Pl Brooklyn, NY | 2.0 | 1.0 | — | $3,500 | — | 1d | 1 | 0.19mi |
| 1159 Saint Johns Pl Brooklyn, NY | 2.0 | 1.0 | — | $3,200 | — | 23d | 1 | 0.19mi |
| 1159 St Johns Pl Unit 2A Brooklyn, NY | 2.0 | 1.0 | — | $3,200 | — | 26d | 1 | 0.19mi |
| 330 Albany Ave Brooklyn, NY | 2.0 | 1.0 | — | $3,300 | — | 22d | 1 | 0.20mi |
| 330 Albany Ave Unit 3 Brooklyn, NY | 2.0 | 1.0 | — | $3,300 | — | 24d | 1 | 0.20mi |
| 15 Hampton Pl Brooklyn, NY | 2.0 | 2.0 | — | $4,000 | — | 7d | 1 | 0.21mi |
| 955 Sterling Pl Unit 511 Brooklyn, NY | 1.0 | 1.0 | — | $3,650 | — | 26d | 1 | 0.25mi |
| 955 Sterling Pl #1936 Brooklyn, NY | 1.0 | 1.0 | 540 | $3,170 | $5.87 | 23d | 1 | 0.25mi |
| 955 Sterling Pl Brooklyn, NY | 1.0 | 1.0 | — | $3,853 | — | 26d | 1 | 0.27mi |
| 955 Sterling Pl Unit 415 Brooklyn, NY | 2.0 | 1.0 | 680 | $5,150 | $7.57 | 26d | 1 | 0.27mi |
| 840 Lincoln Pl Unit 1 Brooklyn, NY | — | 1.0 | — | $2,200 | — | 21d | 1 | 0.30mi |
| 1578 Union St Brooklyn, NY | 2.0 | 1.0 | — | $3,500 | — | 17d | 1 | 0.35mi |
| 833 Saint Johns Pl Unit 3F Brooklyn, NY | 1.0 | 1.0 | — | $2,500 | — | 26d | 1 | 0.42mi |
| 833 St Johns Pl Brooklyn, NY | 1.0 | 1.0 | — | $2,500 | — | 23d | 1 | 0.43mi |
| 1266 Park Pl Unit 1A Brooklyn, NY | 2.0 | 1.5 | 886 | $3,250 | $3.67 | 26d | 1 | 0.43mi |
| 827 Sterling Pl Unit 3A Brooklyn, NY | 1.0 | 1.0 | — | $3,800 | — | 26d | 1 | 0.46mi |
| 1401 Dean St Brooklyn, NY | 1.0 | 1.0 | — | $2,950 | — | 26d | 1 | 0.46mi |
| 827 Sterling Pl Brooklyn, NY | — | 1.0 | — | $3,150 | — | 26d | 1 | 0.46mi |
| 800 Park Pl Unit 3R Brooklyn, NY | 2.0 | 2.0 | 1300 | $6,995 | $5.38 | 26d | 1 | 0.49mi |
| 950 Nostrand Ave Brooklyn, NY | 1.0 | 1.0 | — | $3,150 | — | 26d | 1 | 0.52mi |
| 950 Nostrand Ave Unit 2R Brooklyn, NY | 2.0 | 1.0 | — | $3,250 | — | 10d | 1 | 0.52mi |
| 1356 Pacific St Brooklyn, NY | 1.0 | 1.0 | — | $2,600 | — | 26d | 1 | 0.52mi |
| 950 Nostrand Ave Unit 3F Brooklyn, NY | 1.0 | 1.0 | — | $3,150 | — | 10d | 1 | 0.52mi |
| 1437 Pacific St Brooklyn, NY | 2.0 | 1.0 | 1000 | $3,200 | $3.20 | 26d | 1 | 0.52mi |
| 668 Nostrand Ave #1 Brooklyn, NY | 1.0 | 1.0 | 611 | $4,200 | $6.87 | 21d | 1 | 0.54mi |
| 1331 Park Pl Unit 1 Brooklyn, NY | 2.0 | 2.0 | — | $6,250 | — | 21d | 1 | 0.55mi |
| 609 Nostrand Ave Brooklyn, NY | 2.0 | 1.0 | — | $3,495 | — | 26d | 1 | 0.56mi |
| 609 Nostrand Ave Brooklyn, NY | 2.0 | 1.0 | — | $3,450 | — | 1d | 1 | 0.56mi |
| 609 Nostrand Ave Unit 7 Brooklyn, NY | 2.0 | 1.0 | — | $3,450 | — | 26d | 1 | 0.56mi |
| 609 Nostrand Ave Unit 5 Brooklyn, NY | 2.0 | 1.0 | — | $3,495 | — | 10d | 1 | 0.56mi |
| 105 Rogers Ave Brooklyn, NY | 2.0 | 2.0 | — | $5,000 | — | 26d | 1 | 0.58mi |
| 1619 Pacific St Brooklyn, NY | 2.0 | 2.0 | 1300 | $3,300 | $2.54 | 4d | 1 | 0.59mi |
| 1069 Bergen St Brooklyn, NY | 2.0 | 1.0 | — | $2,928 | — | 10d | 2 | 0.59mi |
| 1627 Pacific St Unit 3B Brooklyn, NY | 2.0 | 1.0 | — | $3,099 | — | 26d | 1 | 0.60mi |
| 409 Eastern Pkwy Unit 323 Brooklyn, NY | 1.0 | 1.0 | — | $3,299 | — | 26d | 1 | 0.60mi |
| 409 Eastern Pkwy Unit 212 Brooklyn, NY | — | 1.0 | — | $2,862 | — | 26d | 1 | 0.60mi |
| 409 Eastern Pkwy Unit 710 Brooklyn, NY | 1.0 | 1.0 | — | $4,360 | — | 26d | 1 | 0.60mi |
| 409 Eastern Pkwy Unit 902 Brooklyn, NY | 1.0 | 1.0 | — | $4,300 | — | 26d | 1 | 0.60mi |
| 409 Eastern Pkwy Unit 402 Brooklyn, NY | 1.0 | 1.0 | — | $3,776 | — | 26d | 1 | 0.60mi |
HOA detail condo
- Monthly dues
- $569 · $6,828/yr
- Assessments
- None detected in remarks — confirm with the listing agent.
Listing history 31 events
-
2026-06-21days on market $300,000 Active 127 DOM
-
2026-06-18days on market $300,000 Active 124 DOM
-
2026-06-17days on market $300,000 Active 123 DOM
-
2026-06-15pricedays on market $300,000 Active 121 DOM
-
2026-06-04days on market $265,000 Active 119 DOM
-
2026-06-03days on market $265,000 Active 118 DOM
-
2026-06-01days on market $265,000 Active 116 DOM
-
2026-05-31days on market $265,000 Active 115 DOM
-
2026-02-05$265,000 Active
-
2025-12-12price $275,000
-
2025-10-13price $285,000
-
2025-09-05price $292,000
-
2025-06-03historical $2,100
-
2025-05-31price $2,100
-
2025-05-28$2,000
-
2025-04-24historical $2,300
-
2025-02-03$2,300
-
2024-11-16historical $2,300
-
2024-10-24$2,300
-
2024-08-31historical $2,400
-
2024-07-19$2,400
-
2024-06-22historical $2,400
-
2024-06-18$2,400
-
2024-06-18historical $2,400
-
2024-06-17$2,400
-
2024-05-17historical $2,400
-
2024-05-15$2,400
-
2024-05-03historical $2,400
-
2024-03-05$2,400
-
2024-03-05historical $2,400
-
2024-02-07$2,400
ⓘ Source: listings_history table (triggers on properties + properties_extension) + one-shot
backfill from property_details.listing_events for pre-trigger history.
Climate risk First Street
- Flood 1/10 Low FEMA zone X (unshaded) · 0% chance over 30 yrs
- Wildfire 1/10 Low
- Heat 6/10 Major 7 d/yr ≥99°F today · 14 d/yr by 30 yrs out
- Wind 6/10 Major 64% chance of damaging wind over 30 yrs
- Air quality 5/10 Major 6 unhealthy d/yr today · 8 by 30 yrs out
Nearby sold comps map
Loading sold comps map…
Walkable amenities ~0.75 mi
Loading nearby amenities…
Taxation est. · year 1
- Rental income
- $40,069
- − Mortgage interest
- −$16,805
- − Property taxes
- −$4,500
- − Insurance
- −$1,500
- − Repairs & maintenance
- −$3,206
- − Management
- −$3,206
- − HOA
- −$6,828
- − Depreciation
- −$8,727
- Taxable loss
- −$4,702
- Est. tax savings @ 24.0%
- +$1,128
- After-tax cash flow
- $1,076/yr
For passive investors: Depreciation is non-cash, so a rental often shows a tax loss while cash-flowing — sheltering income. Rental losses are passive: they offset passive income freely, and up to $25,000/yr can offset ordinary (W-2) income if you actively participate and your MAGI is under $100k (phasing out to $0 by $150k); unused losses carry forward. On sale, claimed depreciation is recaptured at up to 25%, and gains may owe capital-gains tax (a 1031 exchange can defer both). Figures are a year-1 estimate at your 24.0% rate — not tax advice; consult a CPA.
Schools (NCES district)
No district data.
Livability — New York
- Score
- 75/100
- State rank
- #268
- US rank
- #4188
Category grades
Schools grade is shown separately in the Schools card above.
Census & demographics
- Census place
- New York, NY
- County
- Kings County · 2,614,986 people
- City population
- 7,731,280
- Metro
- New York-Newark-Jersey City, NY-NJ-PA
- Population (ZIP)
- 68,846
- Household income
- $65,127
- Rent vs Own
- Severe rent burden
- 6603.0
Population outlook (Kings County) Hauer SSP2
- Today (2025)
- 2,847,441 people
- By 2030
- 2,937,006 · +3.1%
- By 2040
- 3,095,491 · +8.7%
- By 2050
- 3,228,968 · +13.4%
- By 2075
- 3,321,723 · +16.7%
- By 2100
- 3,111,387 · +9.3%
Race, ethnicity, and origin ACS 2023
- Neighborhood character
- Diverse neighborhood (Simpson 0.61)
- Race & ethnicity
- Black 56% White 23% Hispanic / Latino 13% Two or more races 8% Asian 2%
- Hispanic origin (detail)
- Mexican 1% Puerto Rican 3% Dominican 4%
- Common ancestry
- Hispanic 5% Scotch-Irish 2% Romanian 1%
- Foreign-born
- 32% · Canada, Mexico, China
- Languages at home
- 76% English-only · Spanish 9% French/Haitian/Cajun 6% German/W. Germanic 2%
Political lean MEDSL · Kings
- 2024 margin
- Solid D (+44.0) · D 72.0% · R 28.0%
- 2008→2024 swing
- -15.5pp toward R · 2008: 59.4pp · 2024: 44.0pp
- All cycles
- 2024: D+44.0 2020: D+54.8 2016: D+61.8 2012: D+63.9 2008: D+59.4
Not yet ingested
- Civics
- —
Market trends
- HPI YoY
- ▲ 23.71%
- Current HPI
- 577.3841
- Rent YoY
- ▲ 5.95%
- Metro
- New York-Newark-Jersey City, NY-NJ-PA
- State GDP YoY
- ▲ 2.60%
- F500 in state
- 92
Industry mix (Fortune 500 HQ in NY)
| Industry | F500 HQs | Revenue |
|---|---|---|
| Financial Services | 10 | $950B |
|
||
| Consumer Goods | 9 | $162B |
|
||
| Insurance | 4 | $225B |
|
||
| Telecommunications | 2 | $144B |
|
||
| Pharmaceuticals | 2 | $112B |
|
||
| Media / Entertainment | 2 | $69B |
|
||
Price history
+10941.7% since first listed23 events — show timeline
- 2026-02-05 Listed $265,000 RLS at REBNY
- 2025-12-12 Price Changed $275,000 RLS at REBNY
- 2025-10-13 Price Changed $285,000 RLS at REBNY
- 2025-09-05 Price Changed $292,000 RLS at REBNY
- 2025-06-03 Rental Removed $2,100 REBNY
- 2025-05-31 Price Changed $2,100 REBNY
- 2025-05-28 Listed for Rent $2,000 REBNY
- 2025-04-24 Rental Removed $2,300 REBNY
- 2025-02-03 Listed for Rent $2,300 REBNY
- 2024-11-16 Rental Removed $2,300 REBNY
- 2024-10-24 Listed for Rent $2,300 REBNY
- 2024-08-31 Rental Removed $2,400 REBNY
- 2024-07-19 Listed for Rent $2,400 REBNY
- 2024-06-22 Rental Removed $2,400 ONEKEY
- 2024-06-18 Listed for Rent $2,400 ONEKEY
- 2024-06-18 Rental Removed $2,400 REBNY
- 2024-06-17 Listed for Rent $2,400 REBNY
- 2024-05-17 Rental Removed $2,400 ONEKEY
- 2024-05-15 Listed for Rent $2,400 ONEKEY
- 2024-05-03 Rental Removed $2,400 REBNY
- 2024-03-05 Listed for Rent $2,400 REBNY
- 2024-03-05 Rental Removed $2,400 ONEKEY
- 2024-02-07 Listed for Rent $2,400 ONEKEY
Cash-flow waterfall
monthlySold comps — $/sqft
last 12 mo · ≤1 miLoading sold comps…