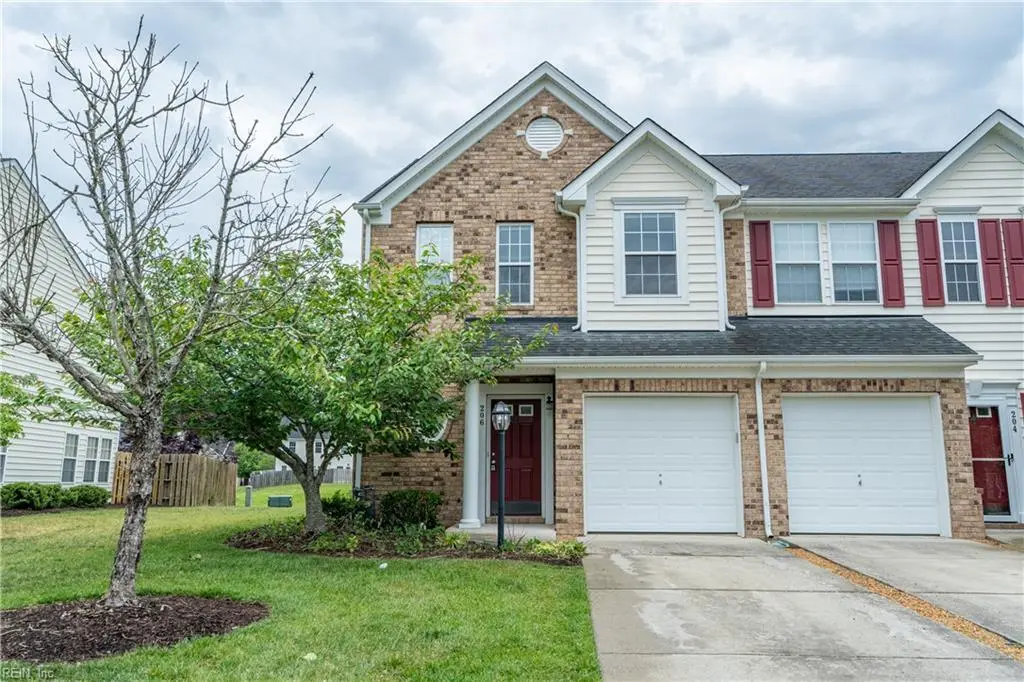
206 Ashton Dr · Yorktown, VA
Flood risk 1/10 · Minimal
- FEMA flood zone
- X (unshaded)
- Chance of flooding over 30 yrs
- 0.0%
- Est. flood insurance / yr
- $507 – $1,088
Fire risk 4/10 · Minor
- Est. fire insurance / yr
- $666 – $1,236
Heat risk 9/10 · Severe
- Hot days now (above 105°F)
- 7 days/yr
- Hot days in 30 yrs
- 18 days/yr
Wind risk 8/10 · Major
- Chance of severe wind over 30 yrs
- 80.0%
Air-quality risk 2/10 · Minimal
- Unhealthy air days now
- 1 days/yr
- Unhealthy air days in 30 yrs
- 1 days/yr
Risk factors via First Street. Map © Google.
Why this score? — see what drove the D grade
The composite is a weighted blend of 9 inputs, each scored 0–100. Each bar is that input's sub-score; the figure is the points it added to the 100-point composite (weight × sub-score).
- Cash flow +11.5/30.0
- Schools +7.2/10.0
- Appreciation +5.2/10.0
- Livability +3.6/5.0
- DSCR +3.4/10.0
- 1% rule +3.2/10.0
- Rent growth +2.5/5.0
- Condition / age +2.5/5.0
- ARV discount +1.2/15.0
$350,000
🖨 Deal sheet (PDF) 📄 Offer letter ✓ Due diligence
Listing remarks
Beautifully updated end-unit townhome in an established Yorktown community offering carefree living with 3 bedrooms and 2.5 baths. Freshly painted in neutral tones with new carpet upstairs and new LVP flooring throughout the main living areas. Features include tray ceilings, spacious rooms, 2nd floor laundry, and a large primary suite with soaking tub and separate shower. The kitchen shines with high-end appliances, while the privacy-fenced backyard with patio is perfect for relaxing or entertaining. Attached one-car garage. Community amenities include pool, clubhouse, fitness center, trash service, and ground maintenance. Conveniently located near historic Yorktown Beach, Coast Guard Stati
Key facts
- Community amenities
- End-unit townhome
- Updated kitchen
Tags
Property features AI
Finance
- HOA & community: HOA with monthly fee of $190; Community clubhouse; Exercise room; Ground maintenance; Pool; Trash pickup
Exterior
- Parking: Attached 1-car garage; Driveway parking spaces
- Utilities: City/County water; City/County sewer; Gas water heater; Electric service (standard)
- Home design: Attached property; Townhouse, transitional style; End unit; Two stories; Slab foundation
- Construction: Asphalt shingle roof
- Exterior features: Vinyl siding; Back privacy wood fence; Fenced yard
Interior
- Kitchen: Dishwasher; Microwave; Gas range; Refrigerator; Breakfast area
- Bedrooms: Primary bedroom with ensuite; Master bedroom on 2nd floor; Additional bedroom(s) on 2nd floor
- Flooring: Carpet; Laminate
- Bathrooms: Two full bathrooms; One half bathroom
- Heating & cooling: Natural gas heating; Central air conditioning
- Interior features: Ceiling fan; Garage door opener; Bar; Gas fireplace; Double primary sink; Walk-in closet; Window treatments
- Laundry & utility: Washer hookup; Dryer hookup; Utility room on 2nd floor
Neighborhood map
What this means for you Summary
Snapshot
- This is a 3-bed/2.5-bath townhouse listed at $350k.
Deal economics
- At list price, monthly cash flow is $-118 ($-1k/yr) — negative.
- To cash-flow at today's rent, offer at most $329k (6.0% below list).
- To meet the 1% rule (rent ≥ 1% of price), the offer needs to be $286k (18.2% below list).
- Recommended offer: $286k (18.2% below list) — sets the bar for 1% rule.
- Cap rate 5.9% vs local median 3.6% in Yorktown — top-decile yield for the area; either an underpriced asset or a hidden risk that comps aren't pricing in. Stress-test before assuming the spread holds.
Location & tenants
- Location reads 72/100 on livability (#189 in VA) — a middle-class / working-renter tenant base. Strengths: crime A+, employment A+, housing B; Watch: amenities F, commute D-, cost of living F.
- York County Public School District (suburban): math 77% / reading 87% proficiency, ranked #3 of 131 in VA (top 2%) — strong family-tenant draw, lease renewals of 3-5y typical; only 15% free/reduced lunch — higher-income household profile.
- Zoned schools: Yorktown Elementary (math 64% / reading 74%, grade A-, #351 of 1,108 statewide, top 32%, 613 students, 60% FRL); Yorktown Middle (math 66% / reading 83%, grade A, #50 of 342 statewide, top 16%, 644 students, 45% FRL); York High (math 69% / reading 92%, grade A, #57 of 319 statewide, top 18%, 1,050 students, 40% FRL) — zoned schools average 48% FRL vs 15% district-wide (33 pts higher); higher-poverty schools than district average — tighter screening recommended.
- Market conditions: 44 active listings in the ZIP; 4 comparable units currently listed for rent nearby; rentals lingering (median 46d on market — plan ~5-8 weeks vacancy on turnover, expect pricing pressure); 50% of comp listings sitting > 30 days — soft ceiling on asking rent; 187 units permitted in York County in 2024 (0 in 5+ unit buildings).
Forward outlook
- In year one you build about $4k of equity ($2k loan paydown + $1k appreciation (0.4% local appreciation)).
- York County population projected at +16% by 2050 — long-run rental-demand tailwind backs the buy-and-hold thesis.
- By year 8, paydown + projected appreciation supports a ~$34k cash-out refi (75% LTV) — recoverable capital for the next deal without selling this one.
Negotiation context
- It's been on market 35 days — a 3% lower offer ($340k) is reasonable based on typical stale-listing flexibility.
- 3 sale attempts since 6y ago with the ask held roughly flat each time — persistent listings suggest the price (not the market) is what's stuck; bring a comps-based counter.
- Current owner paid $240k; 46% above their basis — modest negotiation headroom, anchor on the comps not their cost.
Risks & watch-outs
- Climate carrying-cost: severe wind risk, 80% chance of damaging wind over 30y; extreme-heat days projected 7→18/yr by 2055 (HVAC capex compounding) — expect insurance premiums to compound above CPI over the hold.
Questions for the listing agent
- What do current leases actually rent for vs. the listed asking? Can we see a recent rent roll and the last 12 months of T-12 income?
- It's been on market 35 days. Have you received any prior offers? Is the seller open to a 18% concession, seller financing, or rate buy-down credit?
- What does the HOA fee cover, when was the last increase, and are there any pending special assessments or reserve-fund shortfalls?
- Is there a deadline driving the sale (1031 exchange, divorce, estate, relocation)? That informs how much negotiation room exists.
- Schools are A-rated — typically a magnet for longer-tenancy family renters. What's the average tenant stay here, and is there a school-zone premium baked into asking?
- The area grade is low — what's the realistic commute time and amenity access for the typical tenant pool here? Any planned neighborhood developments (good or bad) we should know about?
- What's the average days-on-market for RENTAL listings here right now (not sales)? A rising rental-DOM trend means longer vacancies and softer asking-rent achievability than the comps imply.
- What's the recent tenant-quality profile in this submarket — average credit score on applications, eviction rate, late-payment / NSF rate, and stable-employment percentage? A property-management company in the area should have these aggregated.
- How much new for-sale + rental construction is in the pipeline within 1–3 miles? Heavy new supply typically softens prices + rents 12–24 months out; constrained supply supports both.
Investment metrics
- 1% rule
- 0.82% ✗
- Cap rate
- 5.89%
- Cash-on-cash
- -1.45%
- DSCR
- 0.94
- GRM
- 10.2
CMA / ARV
- ARV (median comp)
- $306,911
- List price
- $350,000
- Delta
- 14.04%
- Verdict
- OVERPRICED
- Comps
- 20 within 1.0 mi
Show comp detail 9 sales within ~0.75 mi
| Address | Dist | Beds/Ba | Sqft | Sold | Price | $/sf | Match |
|---|---|---|---|---|---|---|---|
| 216 Ashton Dr | 0.02mi | 3/2.5 | 1,796 (-2%) | 1mo | $337,000 | $188 | 95 |
| 411 Alexia Ln | 0.13mi | 3/2.5 | 1,835 (+0%) | 9mo | $350,500 | $191 | 86 |
| 503 Alexia Ln | 0.16mi | 3/2.5 | 1,781 (-2%) | 4mo | $335,000 | $188 | 86 |
| 204 Ashton Dr | 0.00mi | 3/2.5 | 1,790 (-2%) | 14mo | $320,000 | $179 | 85 |
| 419 Alexia Ln | 0.15mi | 3/2.5 | 1,797 (-2%) | 16mo | $335,000 | $186 | 77 |
| 107 Daniels Dr | 0.20mi | 3/2.5 | 1,959 (+7%) | 9mo | $317,000 | $162 | 72 |
| 212 Daniels Dr | 0.10mi | 3/2.5 | 2,090 (+14%) | 10mo | $341,000 | $163 | 62 |
| 119 Daniels Dr | 0.18mi | 3/2.5 | 2,090 (+14%) | 9mo | $345,000 | $165 | 60 |
| 200 Daniels Dr | 0.14mi | 3/2.5 | 2,090 (+14%) | 24mo | $341,050 | $163 | 50 |
Match score weights: distance 35% · size 25% · config 20% · recency 20%. Top-matched comps best support the ARV.
Projected returns pro-forma
0.39% appreciation · 3.0% rent growth · sell at horizon
- IRR
- -2.4%
- Equity multiple
- 0.89×
- Total profit
- $-11,221
- Equity at exit
- $108,572
- IRR
- 3.1%
- Equity multiple
- 1.35×
- Total profit
- $34,031
- Equity at exit
- $136,186
Cash invested: $98,000 (down + closing). Projections, not guarantees.
Landlord ↔ Tenant lean methodology
- Overall (STATE)
- 55 Moderately Landlord-Leaning
- State Virginia
- 55 Moderately Landlord-Leaning · D+2
- County
- — inherits STATE
- City
- — inherits STATE
ZIP-level market 23690
- Home prices YoY
- 0.2%
- Active inventory
- 44
- Price-to-rent
- 10.2×
Monthly cashflow live
- Estimated rent
- $2,864 medium interval (Pro) →
- Mortgage (P&I)
- −$1,835
- Tax from tax record
- −$209 /mo · $2,514/yr
- Insurance
- −$146
- HOA
- −$190
- Vacancy / Maint / Mgmt
- −$601
- Net cashflow
- $-118
Break-even live
Sensitivity live
| Price | -10% $80 | -5% $-19 | +0% $-118 | +5% $-217 | +10% $-316 |
|---|---|---|---|---|---|
| Rent | -10% $-344 | -5% $-231 | +0% $-118 | +5% $-5 | +10% $108 |
| Rate | -1.0pp $58 | -0.5pp $-29 | base $-118 | +0.5pp $-209 | +1.0pp $-301 |
UW: 25.0% down · 7.5% · 30yr · 1.5% tax · 5.0% vac · 8.0% maint · 8.0% mgmt
Financing live
Cash to close
- Down payment
- $87,500
- Closing costs
- $10,500
- Reserves months
- —
- Total cash needed
- —
Loan-product check · same deal, 3 products live
Conventional
25% down · 7.5% · 30yr
- Down + closing
- —
- Monthly P&I
- —
- Monthly cashflow
- —
- DSCR
- —
- Eligible?
- —
Personal DTI + credit; lowest rate.
DSCR
20% down · 8.5% · 30yr
- Down + closing
- —
- Monthly P&I
- —
- Monthly cashflow
- —
- DSCR
- —
- Eligible?
- —
No personal income docs; deal must DSCR.
Hard money
10% down · 12.0% · 12mo
- Down + closing
- —
- Monthly P&I
- —
- Monthly cashflow
- —
- DSCR
- —
- Eligible?
- —
Short-term bridge; refi at stabilization.
Rent comps 4 comps
| Address | Beds | Baths | Sqft | Rent | $/sqft | DOM | Units | Dist |
|---|---|---|---|---|---|---|---|---|
| 405 Baptist Rd Yorktown, VA | 3.0 | 2.0 | 1470 | $2,250 | $1.53 | 45d | 1 | 1.00mi |
| 101 Pulaski St Yorktown, VA | 4.0 | 2.0 | 1900 | $2,450 | $1.29 | 16d | 1 | 1.20mi |
| 103 Chischiak Watch Yorktown, VA | 3.0 | 3.0 | 2382 | $3,600 | $1.51 | 45d | 1 | 1.37mi |
| 103 Chischiak Watch Yorktown, VA | 3.0 | 3.0 | 2384 | $3,600 | $1.51 | 25d | 1 | 1.37mi |
HOA detail
- Monthly dues
- $190 · $2,280/yr
- Likely covers
- trashpoolgym
Listing history 16 events
-
2026-06-13statusdays on market $350,000 Under Contract 35 DOM
-
2026-06-09days on market $350,000 Active Under Contract 33 DOM
-
2026-06-08days on market $350,000 Active Under Contract 32 DOM
-
2026-06-07days on market $350,000 Active Under Contract 31 DOM
-
2026-06-03days on market $350,000 Active Under Contract 27 DOM
-
2026-06-02days on market $350,000 Active Under Contract 26 DOM
-
2026-06-02status $350,000 Active Under Contract 25 DOM
-
2026-06-01days on market $350,000 Active 25 DOM
-
2026-05-31days on market $350,000 Active 24 DOM
-
2026-05-12historical Active Under Contract 770-char remark
-
2026-05-07$350,000 Active 770-char remark
-
2020-07-31soldstatus $240,000
-
2020-07-08status Under Contract
-
2020-07-02historical Active Under Contract
-
2020-06-17$240,000 Active
-
2008-07-08soldstatus $292,420
ⓘ Source: listings_history table (triggers on properties + properties_extension) + one-shot
backfill from property_details.listing_events for pre-trigger history.
Tax reassessment forecast VA · Resets to sale price
- Current annual tax
- $2,514 · $209/mo
- Projected year-2 tax
- $2,870 · $239/mo
- Expected delta
- +$356/yr (+$30/mo · 14.2%)
ⓘ Screening estimate from a state-policy table — verify with the county assessor before closing.
Climate risk First Street
- Flood 1/10 Low FEMA zone X (unshaded) · 0% chance over 30 yrs
- Wildfire 4/10 Moderate
- Heat 9/10 Extreme 7 d/yr ≥105°F today · 18 d/yr by 30 yrs out
- Wind 8/10 Severe 80% chance of damaging wind over 30 yrs
- Air quality 2/10 Low 1 unhealthy d/yr today · 1 by 30 yrs out
Nearby sold comps map
Loading sold comps map…
Walkable amenities ~0.75 mi
Loading nearby amenities…
Taxation est. · year 1
- Rental income
- $34,368
- − Mortgage interest
- −$19,605
- − Property taxes
- −$2,514
- − Insurance
- −$1,750
- − Repairs & maintenance
- −$2,749
- − Management
- −$2,749
- − HOA
- −$2,280
- − Depreciation
- −$10,182
- Taxable loss
- −$7,462
- Est. tax savings @ 24.0%
- +$1,791
- After-tax cash flow
- $372/yr
For passive investors: Depreciation is non-cash, so a rental often shows a tax loss while cash-flowing — sheltering income. Rental losses are passive: they offset passive income freely, and up to $25,000/yr can offset ordinary (W-2) income if you actively participate and your MAGI is under $100k (phasing out to $0 by $150k); unused losses carry forward. On sale, claimed depreciation is recaptured at up to 25%, and gains may owe capital-gains tax (a 1031 exchange can defer both). Figures are a year-1 estimate at your 24.0% rate — not tax advice; consult a CPA.
Schools (NCES district)
- District
- York County Public School District
- NCES district ID
- 5104150
- Math proficiency
- 77% ▼ -15.00%
- Reading proficiency
- 87% ▼ -1.00%
- Median HH income
- $81,985
- Composite
- 72.34/100
- National rank
- #202
- State rank
- #3 of 131 in VA
Livability — Yorktown
- Score
- 72/100
- State rank
- #189
- US rank
- #5884
Category grades
Schools grade is shown separately in the Schools card above.
Census & demographics
- City population
- 42,477
- Population (ZIP)
- 4,948
Population outlook (York County) Hauer SSP2
- Today (2025)
- 75,000 people
- By 2030
- 78,122 · +4.2%
- By 2040
- 83,329 · +11.1%
- By 2050
- 87,381 · +16.5%
- By 2075
- 99,308 · +32.4%
- By 2100
- 101,751 · +35.7%
Race, ethnicity, and origin ACS 2023
- Neighborhood character
- Diverse neighborhood (Simpson 0.68)
- Race & ethnicity
- White 48% Black 22% Hispanic / Latino 21% Two or more races 19%
- Hispanic origin (detail)
- Mexican 6% Puerto Rican 12%
- Common ancestry
- Romanian 2% Serbian 2% Lithuanian 2%
- Foreign-born
- 5% · Canada, Jamaica
- Languages at home
- 87% English-only · Spanish 10% Other Indo-European 1% Russian/Polish/Slavic 1%
Political lean MEDSL · York
- 2024 margin
- Lean R (+6.1) · D 46.3% · R 52.4% · Other 1.3%
- 2008→2024 swing
- +11.9pp toward D · 2008: -18.1pp · 2024: -6.1pp
- All cycles
- 2024: R+6.1 2020: R+6.6 2016: R+17.1 2012: R+20.7 2008: R+18.1
Not yet ingested
- Civics
- —
Market trends
- HPI YoY
- ▲ 0.39%
- Current HPI
- 244.1455
- Rent YoY
- —
- Metro
- —
- State GDP YoY
- ▲ 2.40%
- F500 in state
- 50
Industry mix (Fortune 500 HQ in VA)
| Industry | F500 HQs | Revenue |
|---|---|---|
| Aerospace / Defense | 4 | $236B |
|
||
| Technology / Defense | 3 | $32B |
|
||
| Financial Services | 2 | $176B |
|
||
| Utilities | 2 | $27B |
|
||
| Insurance | 2 | $25B |
|
||
| Technology | 2 | $15B |
|
||
Price history
+19.7% since first listed10 events — show timeline
- 2026-06-11 Pending — REINMLS
- 2026-06-01 Contingent — REINMLS
- 2026-05-21 Relisted — REINMLS
- 2026-05-12 Contingent — REINMLS
- 2026-05-07 Listed $350,000 REINMLS
- 2020-07-31 Sold (Public Records) $240,000 Public Records
- 2020-07-08 Pending — REINMLS
- 2020-07-02 Contingent — REINMLS
- 2020-06-17 Listed $240,000 REINMLS
- 2008-07-08 Sold (Public Records) $292,420 Public Records
Property tax history
+3.1%/yrLatest (2025): $2,514 · +13.5% YoY. Source: county tax records.
Cash-flow waterfall
monthlySold comps — $/sqft
last 12 mo · ≤1 miLoading sold comps…