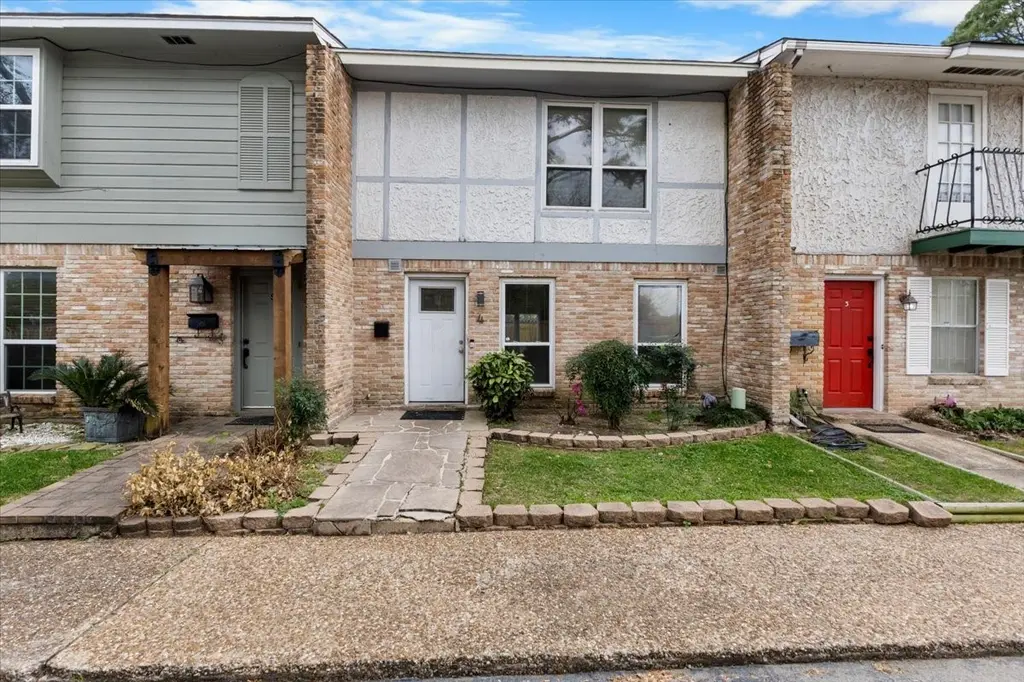
1846 Hollister St #4 · Houston, TX
Flood risk 1/10 · Minimal
- FEMA flood zone
- X (unshaded)
- Chance of flooding over 30 yrs
- 0.0%
- Est. flood insurance / yr
- $507 – $1,088
Fire risk 1/10 · Minimal
- Est. fire insurance / yr
- $1,222 – $2,270
Heat risk 9/10 · Severe
- Hot days now (above 109°F)
- 7 days/yr
- Hot days in 30 yrs
- 24 days/yr
Wind risk 9/10 · Severe
- Chance of severe wind over 30 yrs
- 99.0%
Air-quality risk 3/10 · Minor
- Unhealthy air days now
- 3 days/yr
- Unhealthy air days in 30 yrs
- 3 days/yr
Risk factors via First Street. Map © Google.
Why this score? — see what drove the C grade
The composite is a weighted blend of 9 inputs, each scored 0–100. Each bar is that input's sub-score; the figure is the points it added to the 100-point composite (weight × sub-score).
- Cash flow +22.0/30.0
- 1% rule +8.5/10.0
- ARV discount +7.5/15.0
- DSCR +7.1/10.0
- Schools +4.1/10.0
- Livability +3.7/5.0
- Condition / age +2.5/5.0
- Rent growth +2.1/5.0
- Appreciation +0.0/10.0
$140,000
🖨 Deal sheet (PDF) 📄 Offer letter ✓ Due diligence
Listing remarks
Perfectly sized 2/2 townhouse with comfort and convenience, ideal for low maintenance living. Thoughtfully designed two story layout with bedrooms tucked upstairs for added privacy and separation from living spaces. Home has many updates and ready for its new owners.
Key facts
- $142 HOA
- 2 parking spots
- Built 1975
Property features AI
Finance
- Other: Seller disclosure available
- HOA & community: Hollister Place Townhome Association; Gated community amenity; Association fee $1,700 annually
Exterior
- Parking: Carport; 2-car carport
- Security: Gated
- Utilities: Public water; Public sewer
- Home design: Residential property; 2 stories; Full ownership; Entry/foyer on first level; Family room on first level; Dining room on first level
- Construction: Built in 1975; Brick and cement siding construction; Composition roof; Pillar/Post/Pier and slab foundation
- Exterior features: Gated community; Lot approximately 2,054 square feet
Interior
- Kitchen: Kitchen on first level
- Bedrooms: Primary bedroom on second level (two primary bedrooms listed on second level)
- Flooring: Carpet; Tile
- Bathrooms: 2 full bathrooms; 1 half bathroom
- Heating & cooling: Central heating (electric); Central air conditioning; Gas cooling
- Interior features: Primary bedroom with private bath; 6 total rooms
Neighborhood map
What this means for you Summary
Snapshot
- This is a 2-bed/2.5-bath townhouse listed at $140k.
Deal economics
- At list price, monthly cash flow is $224 ($3k/yr) — positive.
- The deal already cash-flows at list — no discount required.
- Meets the 1% rule at list price ($2k rent vs $140k).
- Recommended offer: $138k (1.5% below list) — sets the bar for market timing.
- Cap rate 8.2% vs local median 3.2% in Houston — top-decile yield for the area; either an underpriced asset or a hidden risk that comps aren't pricing in. Stress-test before assuming the spread holds.
Location & tenants
- Location reads 74/100 on livability (#184 in TX, #4,771 nationally) — a middle-class / working-renter tenant base. Strengths: amenities A+, cost of living A+, housing A+; Watch: crime F.
- Spring Branch ISD (urban): math 47% / reading 46% proficiency, ranked #215 of 826 in TX (top 26%) — families likely to look elsewhere, expect single-tenant / working-renter base with shorter leases.
- Zoned schools: Cedar Brook El (math 39% / reading 37%, grade F, #1,709 of 4,322 statewide, top 40%, 657 students, 73% FRL); Spring Woods Middle (math 17% / reading 26%, grade F, #1,378 of 1,662 statewide, top 83%, 814 students, 92% FRL); Northbrook H S (math 36% / reading 30%, grade F, #1,023 of 1,632 statewide, top 63%, 2,610 students, 85% FRL) — zoned schools average 83% FRL vs 54% district-wide (29 pts higher); higher-poverty schools than district average — tighter screening recommended.
- Zoned-school proficiency averages 31% at this address vs 46% district-wide (-16 pts) — the specific schools serving this property underperform the Spring Branch ISD average; the district grade overstates school quality for this exact location.
- Market conditions: Rents soft (-1.6%/yr); 344 active listings in the ZIP; 33 comparable units currently listed for rent nearby; rentals at typical pace (median 17d on market — plan ~3-4 weeks tenant-placement turnaround); 29,883 units permitted in Harris County in 2024 (8,621 in 5+ unit buildings).
- This rent runs 36% of the median local income ($62k/yr) — at the standard rent-burdened threshold; future hikes will face affordability resistance.
Forward outlook
- Local home prices are declining (-3.0%/yr); year-one equity from $968 of loan paydown is wiped out by about $4k of value loss. Plan a longer hold.
- Harris County population projected at +47% by 2050 — long-run rental-demand tailwind backs the buy-and-hold thesis.
Negotiation context
- It's been on market 15 days — a 2% lower offer ($138k) is reasonable based on typical stale-listing flexibility.
- 3 sale attempts with the ask held roughly flat each time — persistent listings suggest the price (not the market) is what's stuck; bring a comps-based counter.
Risks & watch-outs
- Watch-outs: property tax is 2.9% of price.
- Climate carrying-cost: severe wind risk, 99% chance of damaging wind over 30y; extreme-heat days projected 7→24/yr by 2055 (HVAC capex compounding) — expect insurance premiums to compound above CPI over the hold.
Questions for the listing agent
- Built in 1975 — when were the roof, HVAC, electrical panel, plumbing, and water heater last replaced?
- Property tax is high relative to price — has the assessment been appealed recently, and will the sale trigger a re-assessment?
- What does the HOA fee cover, when was the last increase, and are there any pending special assessments or reserve-fund shortfalls?
- Is there a deadline driving the sale (1031 exchange, divorce, estate, relocation)? That informs how much negotiation room exists.
- Schools are D-rated, which usually means shorter tenancies and higher turnover. Who's the typical renter profile here, and what's been the actual vacancy rate?
- Crime grade is F in this area — have there been break-ins, vandalism, or insurance claims at this property in the last 3 years? What carrier currently insures it and at what premium?
- What's the average days-on-market for RENTAL listings here right now (not sales)? A rising rental-DOM trend means longer vacancies and softer asking-rent achievability than the comps imply.
- What's the recent tenant-quality profile in this submarket — average credit score on applications, eviction rate, late-payment / NSF rate, and stable-employment percentage? A property-management company in the area should have these aggregated.
- How much new for-sale + rental construction is in the pipeline within 1–3 miles? Heavy new supply typically softens prices + rents 12–24 months out; constrained supply supports both.
Investment metrics
- 1% rule
- 1.35% ✓
- Cap rate
- 8.21%
- Cash-on-cash
- 6.86%
- DSCR
- 1.31
- GRM
- 6.2
CMA / ARV
- ARV (median comp)
- $299,692
- List price
- $140,000
- Delta
- -46.61%
- Verdict
- UNDERPRICED
- Comps
- 20 within 1.0 mi
Show comp detail 5 sales within ~0.75 mi
| Address | Dist | Beds/Ba | Sqft | Sold | Price | $/sf | Match |
|---|---|---|---|---|---|---|---|
| 1940 Wildpacher Ln | 0.38mi | 3/2.5 (+1) | 1,395 (-10%) | 6mo | $314,990 | $226 | 55 |
| 1932 Wildpacher Ln | 0.38mi | 3/2.5 (+1) | 1,385 (-11%) | 6mo | $309,990 | $224 | 54 |
| 1938 Wildpacher Ln | 0.38mi | 3/2.5 (+1) | 1,385 (-11%) | 6mo | $299,990 | $217 | 54 |
| 1936 Wildpacher Ln | 0.38mi | 3/2.5 (+1) | 1,385 (-11%) | 7mo | $299,990 | $217 | 53 |
| 8929 Covenant Pl | 0.39mi | 3/2.5 (+1) | 1,700 (+9%) | 14mo | $427,990 | $252 | 50 |
Match score weights: distance 35% · size 25% · config 20% · recency 20%. Top-matched comps best support the ARV.
Projected returns pro-forma
-3.0% appreciation · 0.0% rent growth · sell at horizon
- IRR
- -10.0%
- Equity multiple
- 0.65×
- Total profit
- $-13,731
- Equity at exit
- $20,874
- IRR
- -6.8%
- Equity multiple
- 0.64×
- Total profit
- $-14,093
- Equity at exit
- $12,105
Cash invested: $39,200 (down + closing). Projections, not guarantees.
Landlord ↔ Tenant lean methodology
- Overall (STATE)
- 87 Strongly Landlord-Friendly
- State Texas
- 87 Strongly Landlord-Friendly · R+5
- County
- — inherits STATE
- City
- — inherits STATE
ZIP-level market 77080
- Rents YoY
- -1.6%
- Active inventory
- 344
- Price-to-rent
- 6.2×
Monthly cashflow live
- Estimated rent
- $1,888 high interval (Pro) →
- Mortgage (P&I)
- −$734
- Tax from tax record
- −$333 /mo · $3,995/yr
- Insurance
- −$58
- HOA
- −$142
- Vacancy / Maint / Mgmt
- −$396
- Net cashflow
- $224
Break-even live
Sensitivity live
| Price | -10% $303 | -5% $264 | +0% $224 | +5% $185 | +10% $145 |
|---|---|---|---|---|---|
| Rent | -10% $75 | -5% $150 | +0% $224 | +5% $299 | +10% $373 |
| Rate | -1.0pp $295 | -0.5pp $260 | base $224 | +0.5pp $188 | +1.0pp $151 |
UW: 25.0% down · 7.5% · 30yr · 1.5% tax · 5.0% vac · 8.0% maint · 8.0% mgmt
Financing live
Cash to close
- Down payment
- $35,000
- Closing costs
- $4,200
- Reserves months
- —
- Total cash needed
- —
Loan-product check · same deal, 3 products live
Conventional
25% down · 7.5% · 30yr
- Down + closing
- —
- Monthly P&I
- —
- Monthly cashflow
- —
- DSCR
- —
- Eligible?
- —
Personal DTI + credit; lowest rate.
DSCR
20% down · 8.5% · 30yr
- Down + closing
- —
- Monthly P&I
- —
- Monthly cashflow
- —
- DSCR
- —
- Eligible?
- —
No personal income docs; deal must DSCR.
Hard money
10% down · 12.0% · 12mo
- Down + closing
- —
- Monthly P&I
- —
- Monthly cashflow
- —
- DSCR
- —
- Eligible?
- —
Short-term bridge; refi at stabilization.
Rent comps 33 comps
| Address | Beds | Baths | Sqft | Rent | $/sqft | DOM | Units | Dist |
|---|---|---|---|---|---|---|---|---|
| 8850 Long Point Rd Houston, TX | 1.0–2.0 | 1.0–2.0 | 994 | $1,950 | $1.96 | 0d | 35 | 0.17mi |
| 1920 Hollister St Apt 1201 Houston, TX | 2.0 | 2.0 | 1200 | $1,295 | $1.08 | 26d | 1 | 0.24mi |
| 8701 Hammerly Blvd Houston, TX | 3.0 | 1.0–2.0 | 843 | $1,281 | $1.52 | 0d | 53 | 0.32mi |
| 9024 Wellspring Dr Houston, TX | 3.0 | 2.5 | 2000 | $2,700 | $1.35 | 23d | 1 | 0.45mi |
| 9009 Lonestar River Ln Houston, TX | 3.0 | 3.5 | 2048 | $2,780 | $1.36 | 45d | 1 | 0.46mi |
| 2008 Laverne Willow Ln Unit 2008 B* Model Houston, TX | 2.0 | 2.0 | 1200 | $2,145 | $1.79 | 45d | 1 | 0.46mi |
| 1620 Ojeman Rd Houston, TX | 3.0 | 3.5 | 1935 | $3,350 | $1.73 | 21d | 1 | 0.47mi |
| 1620 Ojeman Rd Houston, TX | 3.0 | 3.5 | 1935 | $3,080 | $1.59 | 45d | 1 | 0.47mi |
| 1620 Ojeman Rd Houston, TX | 3.0 | 3.5 | 1935 | $3,350 | $1.73 | 22d | 1 | 0.47mi |
| 9012 Lonestar Creekbend Ln Houston, TX | 3.0 | 2.5 | 1500 | $2,175 | $1.45 | 26d | 1 | 0.49mi |
| 8515 Hammerly Blvd Unit 3047 Houston, TX | 3.0 | 2.0 | 1200 | $1,330 | $1.11 | 0d | 1 | 0.52mi |
| 8515 Hammerly Blvd Unit 8548 Houston, TX | 3.0 | 2.0 | 1200 | $1,279 | $1.07 | 0d | 1 | 0.53mi |
| 1526 Ojeman Rd Unit A Houston, TX | 3.0 | 3.5 | 1943 | $3,350 | $1.72 | 45d | 1 | 0.55mi |
| 1760 Campbell Rd Houston, TX | 3.0 | 2.0 | 1354 | $1,675 | $1.24 | 45d | 1 | 0.60mi |
| 1610 Campbell Rd Houston, TX | 1.0–2.0 | 1.0–2.0 | 882 | $2,364 | $2.68 | 0d | 46 | 0.61mi |
| 2015 Peppermill Rd Houston, TX | 3.0 | 2.0 | 1756 | $2,400 | $1.37 | 45d | 1 | 0.70mi |
| 2121 Pech Rd Houston, TX | 1.0–2.0 | 1.0–2.0 | 900 | $1,680 | $1.87 | 4d | 49 | 0.76mi |
| 2308 Bingle Rd Houston, TX | 3.0 | 1.0–2.0 | 871 | $1,973 | $2.26 | 0d | 35 | 0.84mi |
| 2324 Peppermill Rd Houston, TX | 3.0 | 1.5 | 1500 | $1,800 | $1.20 | 26d | 1 | 0.97mi |
| 8370 Westview Dr Unit 3112 Houston, TX | 3.0 | 2.0 | 1125 | $1,474 | $1.31 | 0d | 1 | 1.03mi |
| 8370 Westview Dr Unit 8403 Houston, TX | 3.0 | 2.0 | 1125 | $1,514 | $1.35 | 12d | 1 | 1.03mi |
| 1550 Blalock Rd Houston, TX | 1.0–2.0 | 1.0–1.5 | 965 | $1,414 | $1.47 | 4d | 47 | 1.13mi |
| 9300 Westview Dr Houston, TX | 2.0 | 2.0 | 1171 | $1,980 | $1.69 | 13d | 1 | 1.16mi |
| 9007 Kempwood Dr Houston, TX | 3.0 | 2.0 | 1344 | $1,175 | $0.87 | 20d | 1 | 1.19mi |
| 9007 Kempwood Dr Houston, TX | 3.0 | 2.0 | 1344 | $1,175 | $0.87 | 17d | 1 | 1.19mi |
| 1855 Wirt Rd Houston, TX | 3.0 | 1.0–2.0 | 954 | $1,283 | $1.35 | 3d | 76 | 1.25mi |
| 1403 Blalock Rd Houston, TX | 2.0 | 1.5–2.0 | 1276 | $1,525 | $1.20 | 45d | 4 | 1.27mi |
| 9550 Long Point Rd Houston, TX | 2.0–4.0 | 1.0–2.0 | 1130 | $775 | $0.69 | 3d | 10 | 1.33mi |
| 7702 Westside Villas Ln Houston, TX | 3.0 | 3.0 | 2024 | $3,350 | $1.66 | 45d | 1 | 1.37mi |
| 1514 Wirt Rd Houston, TX | 2.0 | 1.0 | 1060 | $1,475 | $1.39 | 6d | 1 | 1.38mi |
| 1514 Wirt Rd Unit 4 Houston, TX | 2.0 | 1.0 | 1060 | $1,450 | $1.37 | 14d | 1 | 1.38mi |
| 1514 Wirt Rd Houston, TX | 2.0 | 1.0 | 1060 | $1,450 | $1.37 | 16d | 1 | 1.38mi |
| 1217 Blalock Rd Houston, TX | 3.0 | 1.0–2.0 | 818 | $986 | $1.20 | 0d | 14 | 1.44mi |
HOA detail
- Monthly dues
- $142 · $1,704/yr
Listing history 18 events
-
2026-06-21days on market $140,000 Pending 15 DOM
-
2026-06-18days on market $140,000 Pending 13 DOM
-
2026-06-17days on market $140,000 Pending 12 DOM
-
2026-06-16days on market $140,000 Pending 11 DOM
-
2026-06-15status $140,000 Pending 10 DOM
-
2026-06-15days on market $140,000 Active 10 DOM
-
2026-06-13days on market $140,000 Active 8 DOM
-
2026-06-09days on market $140,000 Active 4 DOM
-
2026-06-08days on market $140,000 Active 3 DOM
-
2026-06-07pricedays on market $140,000 Active 2 DOM
-
2026-06-04days on market $155,000 Active 66 DOM
-
2026-06-03days on market $155,000 Active 65 DOM
-
2026-06-02days on market $155,000 Active 64 DOM
-
2026-06-01days on market $155,000 Active 63 DOM
-
2026-05-31days on market $155,000 Active 62 DOM
-
2026-05-05price $169,999 269-char remark
-
2026-03-30$170,000 Active 269-char remark
-
1988-01-02soldstatus
ⓘ Source: listings_history table (triggers on properties + properties_extension) + one-shot
backfill from property_details.listing_events for pre-trigger history.
Tax reassessment forecast TX · Resets to sale price
- Current annual tax
- $3,995 · $333/mo
- Projected year-2 tax
- $3,995 · $333/mo
- Expected delta
- $0/yr ($0/mo · 0.0%)
ⓘ Screening estimate from a state-policy table — verify with the county assessor before closing.
Climate risk First Street
- Flood 1/10 Low FEMA zone X (unshaded) · 0% chance over 30 yrs
- Wildfire 1/10 Low
- Heat 9/10 Extreme 7 d/yr ≥109°F today · 24 d/yr by 30 yrs out
- Wind 9/10 Extreme 99% chance of damaging wind over 30 yrs
- Air quality 3/10 Moderate 3 unhealthy d/yr today · 3 by 30 yrs out
Nearby sold comps map
Loading sold comps map…
Walkable amenities ~0.75 mi
Loading nearby amenities…
Taxation est. · year 1
- Rental income
- $22,657
- − Mortgage interest
- −$7,842
- − Property taxes
- −$3,995
- − Insurance
- −$700
- − Repairs & maintenance
- −$1,813
- − Management
- −$1,813
- − HOA
- −$1,704
- − Depreciation
- −$4,073
- Taxable income
- $718
- Est. tax owed @ 24.0%
- −$172
- After-tax cash flow
- $2,517/yr
For passive investors: Depreciation is non-cash, so a rental often shows a tax loss while cash-flowing — sheltering income. Rental losses are passive: they offset passive income freely, and up to $25,000/yr can offset ordinary (W-2) income if you actively participate and your MAGI is under $100k (phasing out to $0 by $150k); unused losses carry forward. On sale, claimed depreciation is recaptured at up to 25%, and gains may owe capital-gains tax (a 1031 exchange can defer both). Figures are a year-1 estimate at your 24.0% rate — not tax advice; consult a CPA.
Schools (NCES district)
- District
- Spring Branch ISD
- NCES district ID
- 4841100
- Math proficiency
- 47% ▼ -4.00%
- Reading proficiency
- 46% ▼ -1.00%
- Median HH income
- $60,311
- Composite
- 40.88/100
- National rank
- #3624
- State rank
- #215 of 826 in TX
Livability — Houston
- Score
- 74/100
- State rank
- #184
- US rank
- #4771
Category grades
Schools grade is shown separately in the Schools card above.
Census & demographics
- Census place
- Houston, TX
- County
- Harris County · 4,702,590 people
- City population
- 3,226,434
- Metro
- Houston-The Woodlands-Sugar Land, TX
- Population (ZIP)
- 47,638
- Household income
- $62,134
- Rent vs Own
- Severe rent burden
- 2296.0
Population outlook (Harris County) Hauer SSP2
- Today (2025)
- 5,571,493 people
- By 2030
- 6,089,821 · +9.3%
- By 2040
- 7,142,806 · +28.2%
- By 2050
- 8,185,864 · +46.9%
- By 2075
- 10,574,329 · +89.8%
- By 2100
- 12,109,958 · +117.4%
Race, ethnicity, and origin ACS 2023
- Neighborhood character
- Predominantly Hispanic (71%)
- Race & ethnicity
- Hispanic / Latino 71% Two or more races 19% White 18% Asian 5% Black 5% Native American 1%
- Hispanic origin (detail)
- Mexican 44% Cuban 1%
- Common ancestry
- Lithuanian 2% Romanian 1% Slovak 1%
- Foreign-born
- 42% · Canada, Vietnam, South Korea
- Languages at home
- 33% English-only · Spanish 62% Vietnamese 1% Other Indo-European 1%
Political lean MEDSL · Harris
- 2024 margin
- Lean D (+5.5) · D 52.0% · R 46.4% · Other 1.6%
- 2008→2024 swing
- +3.9pp toward D · 2008: 1.6pp · 2024: 5.5pp
- All cycles
- 2024: D+5.5 2020: D+13.3 2016: D+12.4 2012: D+0.1 2008: D+1.6
Not yet ingested
- Civics
- —
Market trends
- HPI YoY
- ▼ -240.33%
- Current HPI
- 266.9663
- Rent YoY
- ▼ -1.57%
- Metro
- Houston-The Woodlands-Sugar Land, TX
- State GDP YoY
- ▲ 3.95%
- F500 in state
- 110
Industry mix (Fortune 500 HQ in TX)
| Industry | F500 HQs | Revenue |
|---|---|---|
| Energy | 16 | $1,198B |
|
||
| Technology | 5 | $198B |
|
||
| Engineering / Construction | 4 | $72B |
|
||
| Energy Services | 3 | $60B |
|
||
| Utilities | 3 | $41B |
|
||
| Healthcare | 2 | $330B |
|
||
Price history
-17.6% since first listed10 events — show timeline
- 2026-06-15 Pending — HARMLS
- 2026-06-05 Listing Removed — HARMLS
- 2026-06-05 Listed $140,000 HARMLS
- 2026-05-29 Relisted — HARMLS
- 2026-05-29 Price Changed $155,000 HARMLS
- 2026-05-29 Pending — HARMLS
- 2026-05-20 Price Changed $160,000 HARMLS
- 2026-05-05 Price Changed $169,999 HARMLS
- 2026-03-30 Listed $170,000 HARMLS
- 1988-01-02 Sold (Public Records) — Public Records
Property tax history
+8.6%/yrLatest (2025): $3,995 · -1.4% YoY. Source: county tax records.
Cash-flow waterfall
monthlySold comps — $/sqft
last 12 mo · ≤1 miLoading sold comps…