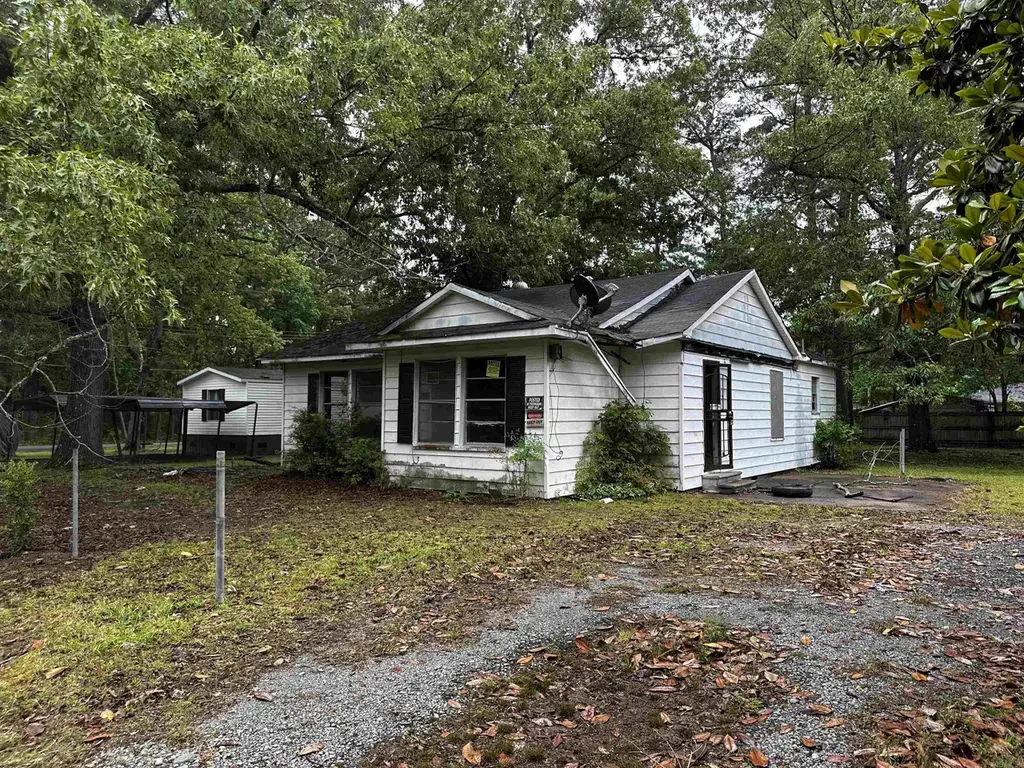
6102 Bullock St · Pine Bluff, AR
Flood risk 1/10 · Minimal
- FEMA flood zone
- X (unshaded)
- Chance of flooding over 30 yrs
- 0.0%
- Est. flood insurance / yr
- $507 – $1,088
Fire risk 2/10 · Minimal
- Est. fire insurance / yr
- $1,499 – $2,785
Heat risk 6/10 · Moderate
- Hot days now (above 111°F)
- 7 days/yr
- Hot days in 30 yrs
- 19 days/yr
Wind risk 4/10 · Minor
- Chance of severe wind over 30 yrs
- 23.0%
Air-quality risk 1/10 · Minimal
- Unhealthy air days now
- 0 days/yr
- Unhealthy air days in 30 yrs
- 0 days/yr
Risk factors via First Street. Map © Google.
Why this score? — see what drove the B- grade
The composite is a weighted blend of 9 inputs, each scored 0–100. Each bar is that input's sub-score; the figure is the points it added to the 100-point composite (weight × sub-score).
- Cash flow +30.0/30.0
- 1% rule +10.0/10.0
- DSCR +10.0/10.0
- ARV discount +7.5/15.0
- Schools +3.2/10.0
- Rent growth +2.5/5.0
- Livability +2.5/5.0
- Condition / age +2.5/5.0
- Appreciation +0.0/10.0
$30,000
🖨 Deal sheet (PDF) 📄 Offer letter ✓ Due diligence
Listing remarks
Investment opportunity in Pine Bluff! This 2-bedroom, 2-bath home offers approximately 1,300 sqft of living space and strong potential for investors looking to expand their rental portfolio or secure an affordable value-add property. The home features a functional layout with spacious living areas, well-sized bedrooms, and multiple full bathrooms—making it appealing for long-term tenants or future resale potential. With the right updates and vision, this property can become a solid income-producing asset. Conveniently located near schools, shopping, dining, parks, and major roadways, the property offers accessibility and everyday convenience for future occupants. Pine Bluff continues
Key facts
- Accessible location
- Functional layout
- 0.28 acre lot
Tags
Property features AI
Finance
- Financial info: Financing available: Conventional loan or cash
Exterior
- Parking: Carport
- Utilities: Public sewer; Public water; Electric service (municipal/Entergy); Natural gas
- Home design: Frame exterior
- Construction: Composition roof; Crawl space foundation
- Exterior features: Paved road access; Inside city limits; Level lot
Interior
- Flooring: Wood
- Bathrooms: 2 full bathrooms
- Heating & cooling: Central gas heating; Central gas cooling
- Interior features: Wood floors; Level interior layout
Neighborhood map
What this means for you Summary
Snapshot
- This is a 2-bed/1.0-bath single-family listed at $30k.
Deal economics
- At list price, monthly cash flow is $678 ($8k/yr) — positive.
- The deal already cash-flows at list — no discount required.
- Meets the 1% rule at list price ($1k rent vs $30k).
- Recommended offer: $29k (3.0% below list) — sets the bar for market timing.
- Cap rate 33.4% vs local median 8.9% in Pine Bluff — top-decile yield for the area; either an underpriced asset or a hidden risk that comps aren't pricing in. Stress-test before assuming the spread holds.
Location & tenants
- Location reads 50/100 on livability (#483 in AR) — a working-class tenant base; expect higher turnover. Strengths: cost of living A+, housing A; Watch: crime F, amenities F, commute F.
- White Hall School District (rural): math 36% / reading 38% proficiency, ranked #86 of 238 in AR (top 36%) — families likely to look elsewhere, expect single-tenant / working-renter base with shorter leases.
- Zoned schools: Gandy Elementary School (math 37% / reading 32%, grade F, #254 of 454 statewide, top 59%, 348 students, 60% FRL); White Hall Junior High School (math 40% / reading 39%, grade F, #92 of 201 statewide, top 50%, 703 students, 54% FRL); White Hall High School (math 23% / reading 34%, grade F, #157 of 292 statewide, top 54%, 969 students, 53% FRL) — zoned schools average 56% FRL vs 36% district-wide (19 pts higher); higher-poverty schools than district average — tighter screening recommended.
- Market conditions: 93 active listings in the ZIP; 62 units permitted in Jefferson County in 2024 (0 in 5+ unit buildings).
Forward outlook
- Local home prices are declining (-3.0%/yr); year-one equity from $207 of loan paydown is wiped out by about $900 of value loss. Plan a longer hold.
- Jefferson County population projected at -33% by 2050 — secular population decline; favor cash flow + early exit over multi-decade hold.
- At projected returns (-3.0% appreciation + 3.0% rent growth), your $8k cash investment doubles in ~2 years — after that, you're playing with house money.
Negotiation context
- It's been on market 45 days — a 3% lower offer ($29k) is reasonable based on typical stale-listing flexibility.
- 2 sale attempts since 2y ago with the ask held roughly flat each time — persistent listings suggest the price (not the market) is what's stuck; bring a comps-based counter.
Risks & watch-outs
- Watch-outs: built in 1944 — expect roof / HVAC / electrical / plumbing capex.
- Climate carrying-cost: extreme-heat days projected 7→19/yr by 2055 (HVAC capex compounding) — expect insurance premiums to compound above CPI over the hold.
Questions for the listing agent
- It's been on market 45 days. Have you received any prior offers? Is the seller open to a 3% concession, seller financing, or rate buy-down credit?
- Built in 1944 — when were the roof, HVAC, electrical panel, plumbing, and water heater last replaced?
- Is there a deadline driving the sale (1031 exchange, divorce, estate, relocation)? That informs how much negotiation room exists.
- Schools are F-rated, which usually means shorter tenancies and higher turnover. Who's the typical renter profile here, and what's been the actual vacancy rate?
- Crime grade is F in this area — have there been break-ins, vandalism, or insurance claims at this property in the last 3 years? What carrier currently insures it and at what premium?
- What's the average days-on-market for RENTAL listings here right now (not sales)? A rising rental-DOM trend means longer vacancies and softer asking-rent achievability than the comps imply.
- What's the recent tenant-quality profile in this submarket — average credit score on applications, eviction rate, late-payment / NSF rate, and stable-employment percentage? A property-management company in the area should have these aggregated.
- How much new for-sale + rental construction is in the pipeline within 1–3 miles? Heavy new supply typically softens prices + rents 12–24 months out; constrained supply supports both.
Investment metrics
- 1% rule
- 3.75% ✓
- Cap rate
- 33.42%
- Cash-on-cash
- 96.89%
- DSCR
- 5.31
- GRM
- 2.2
CMA / ARV
- ARV (median comp)
- $114,431
- List price
- $30,000
- Delta
- -73.78%
- Verdict
- UNDERPRICED
- Comps
- 20 within 1.0 mi
Show comp detail 7 sales within ~0.75 mi
| Address | Dist | Beds/Ba | Sqft | Sold | Price | $/sf | Match |
|---|---|---|---|---|---|---|---|
| 6106 Parker St | 0.18mi | 3/1.0 (+1) | 1,272 (-3%) | 11mo | $57,000 | $45 | 72 |
| 6401 Sunset Dr | 0.41mi | 2/1.0 | 1,207 (-8%) | 1mo | $140,000 | $116 | 67 |
| 2305 Betty St | 0.63mi | 3/2.0 (+1) | 1,251 (-5%) | 8mo | $107,500 | $86 | 48 |
| 6800 Sunset Rd | 0.58mi | 3/2.0 (+1) | 1,451 (+11%) | 2mo | $120,400 | $83 | 44 |
| 6907 Brierwood | 0.73mi | 3/2.0 (+1) | 1,314 (+0%) | 17mo | $159,900 | $122 | 42 |
| 6812 White Oak Cv | 0.63mi | 3/2.0 (+1) | 1,444 (+10%) | 15mo | $177,000 | $123 | 33 |
| 502 Wildwood Cv | 0.59mi | 3/2.0 (+1) | 1,496 (+14%) | 18mo | $189,900 | $127 | 25 |
Match score weights: distance 35% · size 25% · config 20% · recency 20%. Top-matched comps best support the ARV.
Projected returns pro-forma
-3.0% appreciation · 3.0% rent growth · sell at horizon
- IRR
- 97.9%
- Equity multiple
- 5.57×
- Total profit
- $38,356
- Equity at exit
- $4,473
- IRR
- —
- Equity multiple
- 11.61×
- Total profit
- $89,100
- Equity at exit
- $2,594
Cash invested: $8,400 (down + closing). Projections, not guarantees.
Landlord ↔ Tenant lean methodology
- Overall (STATE)
- 92 Strongly Landlord-Friendly
- State Arkansas
- 92 Strongly Landlord-Friendly · R+14
- County
- — inherits STATE
- City
- — inherits STATE
ZIP-level market 71602
- Home prices YoY
- -7.8%
- Active inventory
- 93
- Price-to-rent
- 2.2×
Monthly cashflow live
- Estimated rent
- $1,125 medium interval (Pro) →
- Mortgage (P&I)
- −$157
- Tax from tax record
- −$41 /mo · $487/yr
- Insurance
- −$12
- HOA
- −$0
- Vacancy / Maint / Mgmt
- −$236
- Net cashflow
- $678
Break-even live
Sensitivity live
| Price | -10% $695 | -5% $687 | +0% $678 | +5% $670 | +10% $661 |
|---|---|---|---|---|---|
| Rent | -10% $589 | -5% $634 | +0% $678 | +5% $723 | +10% $767 |
| Rate | -1.0pp $693 | -0.5pp $686 | base $678 | +0.5pp $670 | +1.0pp $663 |
UW: 25.0% down · 7.5% · 30yr · 1.5% tax · 5.0% vac · 8.0% maint · 8.0% mgmt
Financing live
Cash to close
- Down payment
- $7,500
- Closing costs
- $900
- Reserves months
- —
- Total cash needed
- —
Loan-product check · same deal, 3 products live
Conventional
25% down · 7.5% · 30yr
- Down + closing
- —
- Monthly P&I
- —
- Monthly cashflow
- —
- DSCR
- —
- Eligible?
- —
Personal DTI + credit; lowest rate.
DSCR
20% down · 8.5% · 30yr
- Down + closing
- —
- Monthly P&I
- —
- Monthly cashflow
- —
- DSCR
- —
- Eligible?
- —
No personal income docs; deal must DSCR.
Hard money
10% down · 12.0% · 12mo
- Down + closing
- —
- Monthly P&I
- —
- Monthly cashflow
- —
- DSCR
- —
- Eligible?
- —
Short-term bridge; refi at stabilization.
Listing history 20 events
-
2026-06-21days on market $30,000 Active 45 DOM
-
2026-06-19days on market $30,000 Active 43 DOM
-
2026-06-18days on market $30,000 Active 42 DOM
-
2026-06-17days on market $30,000 Active 41 DOM
-
2026-06-16days on market $30,000 Active 40 DOM
-
2026-06-15days on market $30,000 Active 39 DOM
-
2026-06-14days on market $30,000 Active 37 DOM
-
2026-06-12days on market $30,000 Active 36 DOM
-
2026-06-09days on market $30,000 Active 33 DOM
-
2026-06-08days on market $30,000 Active 32 DOM
-
2026-06-07days on market $30,000 Active 31 DOM
-
2026-06-05days on market $30,000 Active 28 DOM
-
2026-06-03days on market $30,000 Active 27 DOM
-
2026-06-02days on market $30,000 Active 26 DOM
-
2026-06-01days on market $30,000 Active 25 DOM
-
2026-05-31days on market $30,000 Active 24 DOM
-
2026-05-30days on market $30,000 Active 23 DOM
-
2026-05-07$30,000 New Listing 830-char remark
-
2025-08-06historical
-
2024-11-02$45,000 New Listing
ⓘ Source: listings_history table (triggers on properties + properties_extension) + one-shot
backfill from property_details.listing_events for pre-trigger history.
Tax reassessment forecast AR · Resets to sale price
- Current annual tax
- $487 · $41/mo
- Projected year-2 tax
- $487 · $41/mo
- Expected delta
- $0/yr ($0/mo · -0.0%)
ⓘ Screening estimate from a state-policy table — verify with the county assessor before closing.
Climate risk First Street
- Flood 1/10 Low FEMA zone X (unshaded) · 0% chance over 30 yrs
- Wildfire 2/10 Low
- Heat 6/10 Major 7 d/yr ≥111°F today · 19 d/yr by 30 yrs out
- Wind 4/10 Moderate 23% chance of damaging wind over 30 yrs
- Air quality 1/10 Low 0 unhealthy d/yr today · 0 by 30 yrs out
Nearby sold comps map
Loading sold comps map…
Walkable amenities ~0.75 mi
Loading nearby amenities…
Taxation est. · year 1
- Rental income
- $13,498
- − Mortgage interest
- −$1,680
- − Property taxes
- −$487
- − Insurance
- −$150
- − Repairs & maintenance
- −$1,080
- − Management
- −$1,080
- − Depreciation
- −$873
- Taxable income
- $8,149
- Est. tax owed @ 24.0%
- −$1,956
- After-tax cash flow
- $6,183/yr
For passive investors: Depreciation is non-cash, so a rental often shows a tax loss while cash-flowing — sheltering income. Rental losses are passive: they offset passive income freely, and up to $25,000/yr can offset ordinary (W-2) income if you actively participate and your MAGI is under $100k (phasing out to $0 by $150k); unused losses carry forward. On sale, claimed depreciation is recaptured at up to 25%, and gains may owe capital-gains tax (a 1031 exchange can defer both). Figures are a year-1 estimate at your 24.0% rate — not tax advice; consult a CPA.
Schools (NCES district)
- District
- White Hall School District
- NCES district ID
- 0514140
- Math proficiency
- 36% ▼ -12.00%
- Reading proficiency
- 38% ▼ -13.00%
- Median HH income
- $51,633
- Composite
- 32.16/100
- National rank
- #5788
- State rank
- #86 of 238 in AR
Livability — Pine Bluff
- Score
- 50/100
- State rank
- #483
- US rank
- #25645
Category grades
Schools grade is shown separately in the Schools card above.
Census & demographics
- Census place
- Pine Bluff, AR
- City population
- 29,578
- Population (ZIP)
- 15,922
Population outlook (Jefferson County) Hauer SSP2
- Today (2025)
- 63,110 people
- By 2030
- 58,519 · -7.3%
- By 2040
- 49,740 · -21.2%
- By 2050
- 42,331 · -32.9%
- By 2075
- 29,591 · -53.1%
- By 2100
- 21,047 · -66.7%
Race, ethnicity, and origin ACS 2023
- Neighborhood character
- Diverse neighborhood (Simpson 0.56)
- Race & ethnicity
- White 58% Black 32% Two or more races 5% Hispanic / Latino 4% Asian 1%
- Common ancestry
- Italian 1% Slovak 1% Serbian 1%
- Foreign-born
- 2% · Canada
- Languages at home
- 95% English-only · Spanish 3% Other Indo-European 1%
Political lean MEDSL · Jefferson
- 2024 margin
- Strong D (+20.1) · D 59.2% · R 39.2% · Other 1.6%
- 2008→2024 swing
- -6.2pp toward R · 2008: 26.3pp · 2024: 20.1pp
- All cycles
- 2024: D+20.1 2020: D+21.7 2016: D+25.3 2012: D+29.0 2008: D+26.3
Not yet ingested
- Civics
- —
Market trends
- HPI YoY
- ▼ -18.84%
- Current HPI
- 223.9305
- Rent YoY
- —
- Metro
- —
- State GDP YoY
- ▲ 3.80%
- F500 in state
- 10
Industry mix (Fortune 500 HQ in AR)
| Industry | F500 HQs | Revenue |
|---|---|---|
| Retail | 1 | $681B |
|
||
| Food / Agriculture | 1 | $53B |
|
||
| Retail / Energy | 1 | $22B |
|
||
| Transportation / Logistics | 1 | $12B |
|
||
| Energy | 1 | $4B |
|
||
Price history
-33.3% since first listed3 events — show timeline
- 2026-05-07 Listed $30,000 CARMLS
- 2025-08-06 Listing Removed — CARMLS
- 2024-11-02 Listed $45,000 CARMLS
Property tax history
+3.8%/yrLatest (2025): $487 · +0.0% YoY. Source: county tax records.
Cash-flow waterfall
monthlySold comps — $/sqft
last 12 mo · ≤1 miLoading sold comps…