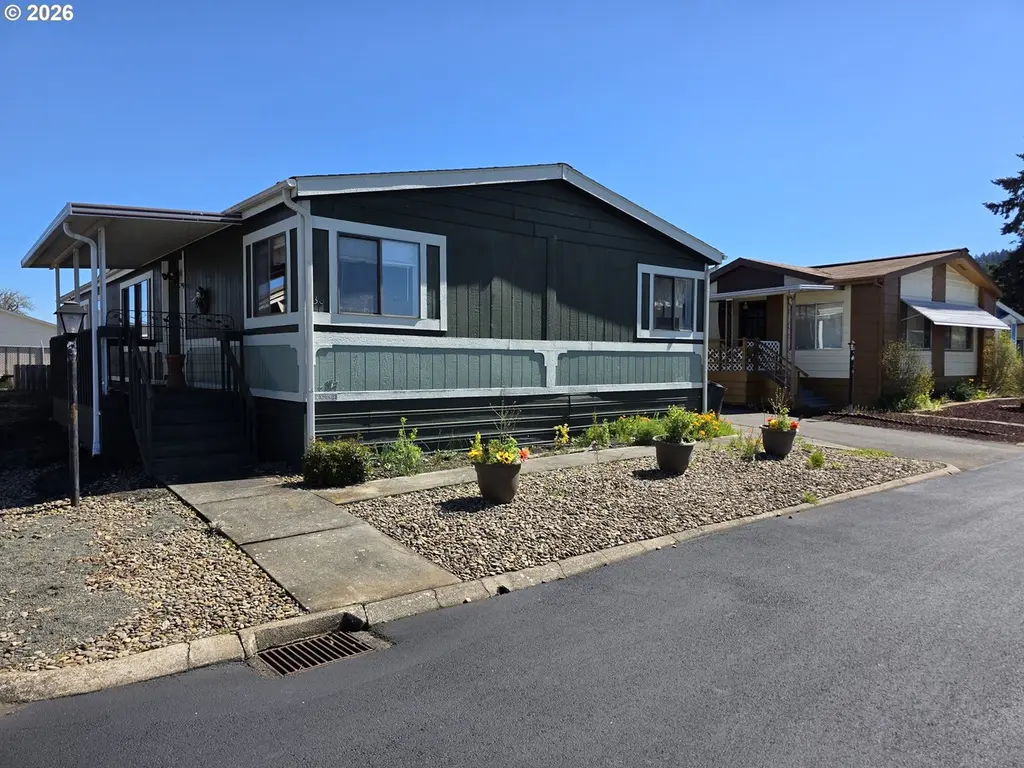
1200 E Central Ave #30 · Sutherlin, OR
Flood risk 9/10 · Severe
- FEMA flood zone
- X (unshaded)
- Chance of flooding over 30 yrs
- 0.99%
- Est. flood insurance / yr
- $507 – $1,088
Fire risk 8/10 · Major
- Est. fire insurance / yr
- $498 – $926
Heat risk 5/10 · Moderate
- Hot days now (above 92°F)
- 8 days/yr
- Hot days in 30 yrs
- 17 days/yr
Wind risk 1/10 · Minimal
- Chance of severe wind over 30 yrs
- —
Air-quality risk 9/10 · Severe
- Unhealthy air days now
- 12 days/yr
- Unhealthy air days in 30 yrs
- 12 days/yr
Risk factors via First Street. Map © Google.
Why this score? — see what drove the C+ grade
The composite is a weighted blend of 9 inputs, each scored 0–100. Each bar is that input's sub-score; the figure is the points it added to the 100-point composite (weight × sub-score).
- Cash flow +30.0/30.0
- DSCR +10.0/10.0
- 1% rule +9.9/10.0
- Livability +3.5/5.0
- Rent growth +2.5/5.0
- Schools +2.5/10.0
- Condition / age +2.5/5.0
- ARV discount +0.0/15.0
- Appreciation +0.0/10.0
$124,900
🖨 Deal sheet 📄 Offer letter ✓ Due diligence
Listing remarks MLS
Unique opportunity to secure a home in the high demand Pineview Estates! This community has soo much to offer including but not limited to: Inground pool, maintained/paved roads, recreation facilities with library, party room, event room, etc. The community has plenty of guest parking in which there is around 8 spaces available right in front of the home for friends and family to use while visiting! The house should be Fully ADA accessible with ramp and wide hallways and access. One of the first things you will notice is the natural lighting throughout the whole home from all the double pane windows and multiple skylights. The bones of the home feel very solid. Just needing someone to make it their own with a little love. The seller has and will be continuing making upgrades while listed until the point of closing. Several rooms have already been painted. Appliances will be included with acceptable offer. Great floor plan with the vaulted ceilings making the house feel very warm and open. Shed in back in stellar shape ready to meet your needs. Fenced yard for those who have pets. Schedule a tour today before its gone!
Key facts
- Guest parking
- Natural lighting
- Fully ada accessible
Tags
Neighborhood map
What this means for you Summary
Snapshot
- This is a 3-bed/2.0-bath manufactured listed at $125k.
Deal economics
- At list price, monthly cash flow is $642 ($8k/yr) — positive.
- The deal already cash-flows at list — no discount required.
- Meets the 1% rule at list price ($2k rent vs $125k).
- Recommended offer: $117k (6.0% below list) — sets the bar for market timing.
- Cap rate 13.1% vs local median 3.5% in Sutherlin — top-decile yield for the area; either an underpriced asset or a hidden risk that comps aren't pricing in. Stress-test before assuming the spread holds.
Location & tenants
- Location reads 70/100 on livability (#135 in OR) — a middle-class / working-renter tenant base. Strengths: cost of living A+, housing A+; Watch: employment C-, health & safety C-, amenities F.
- Sutherlin SD 130 (town): math 19% / reading 40% proficiency, ranked #47 of 58 in OR (top 81%) — low school quality limits family demand, transient renter base, plan for 1-2y turnover.
- Market conditions: 109 active listings in the ZIP; 190 units permitted in Douglas County in 2024 (0 in 5+ unit buildings).
Forward outlook
- Local home prices are declining (-3.0%/yr); year-one equity from $864 of loan paydown is wiped out by about $4k of value loss. Plan a longer hold.
- Douglas County population projected at -13% by 2050 — secular population decline; favor cash flow + early exit over multi-decade hold.
- At projected returns (-3.0% appreciation + 3.0% rent growth), your $35k cash investment doubles in ~6 years — after that, you're playing with house money.
Negotiation context
- It's been on market 74 days — a 6% lower offer ($117k) is reasonable based on typical stale-listing flexibility.
Risks & watch-outs
- Watch-outs: flood insurance adds $66/mo.
- Climate carrying-cost: severe flood risk; severe wildfire risk; extreme-heat days projected 8→17/yr by 2055 (HVAC capex compounding) — expect insurance premiums to compound above CPI over the hold.
Questions for the listing agent
- It's been on market 74 days. Have you received any prior offers? Is the seller open to a 6% concession, seller financing, or rate buy-down credit?
- What's the actual annual flood-insurance premium (NFIP or private), and is the property in a SFHA with mandatory coverage?
- Why hasn't it sold? Are there any deal-killer items the seller is aware of (foundation, flood, title, zoning, code violations)?
- Is there a deadline driving the sale (1031 exchange, divorce, estate, relocation)? That informs how much negotiation room exists.
- What's the average days-on-market for RENTAL listings here right now (not sales)? A rising rental-DOM trend means longer vacancies and softer asking-rent achievability than the comps imply.
- What's the recent tenant-quality profile in this submarket — average credit score on applications, eviction rate, late-payment / NSF rate, and stable-employment percentage? A property-management company in the area should have these aggregated.
- How much new for-sale + rental construction is in the pipeline within 1–3 miles? Heavy new supply typically softens prices + rents 12–24 months out; constrained supply supports both.
Investment metrics
- 1% rule
- 1.49% ✓
- Cap rate
- 13.10%
- Cash-on-cash
- 24.30%
- DSCR
- 2.08
- GRM
- 5.6
CMA / ARV
- ARV (median comp)
- $100,000
- List price
- $124,900
- Delta
- 24.90%
- Verdict
- OVERPRICED
- Comps
- 17 within 1.0 mi
Show comp detail 5 sales within ~0.75 mi
| Address | Dist | Beds/Ba | Sqft | Sold | Price | $/sf | Match |
|---|---|---|---|---|---|---|---|
| 1200 E Central Ave #84 | 0.00mi | 3/2.0 | 1,782 (0%) | 3mo | $90,000 | $51 | 98 |
| 323 Easy St | 0.36mi | 3/2.0 | 1,782 (0%) | 2mo | $310,000 | $174 | 82 |
| 1316 Sunny Ct | 0.17mi | 2/2.0 (-1) | 1,630 (-8%) | 4mo | $283,000 | $174 | 69 |
| 1200 E Central Ave #49 | 0.00mi | 3/2.0 | 2,040 (+14%) | 16mo | $183,500 | $90 | 63 |
| 279 Sunnyside Ct | 0.72mi | 3/2.0 | 1,782 (0%) | 10mo | $279,000 | $157 | 58 |
Match score weights: distance 35% · size 25% · config 20% · recency 20%. Top-matched comps best support the ARV.
Projected returns pro-forma
-3.0% appreciation · 3.0% rent growth · sell at horizon
- IRR
- 14.7%
- Equity multiple
- 1.59×
- Total profit
- $20,637
- Equity at exit
- $18,623
- IRR
- 23.5%
- Equity multiple
- 3.02×
- Total profit
- $70,616
- Equity at exit
- $10,799
Cash invested: $34,972 (down + closing). Projections, not guarantees.
Landlord ↔ Tenant lean methodology
- Overall (STATE)
- 28 Tenant-Leaning
- State Oregon
- 28 Tenant-Leaning · D+6
- County
- — inherits STATE
- City
- — inherits STATE
ZIP-level market 97479
- Home prices YoY
- -19.2%
- Active inventory
- 109
- Price-to-rent
- 5.6×
Monthly cashflow live
- Estimated rent
- $1,855 medium interval (Pro) →
- Mortgage (P&I)
- −$655
- Tax from tax record
- −$50 /mo · $602/yr
- Insurance
- −$52
- Flood insurance flood zone
- −$66 /mo · $798/yr
- HOA
- −$0
- Vacancy / Maint / Mgmt
- −$390
- Net cashflow
- $642
Break-even live
UW: 25.0% down · 7.5% · 30yr · 1.5% tax · 5.0% vac · 8.0% maint · 8.0% mgmt
Financing live
Cash to close
- Down payment
- $31,225
- Closing costs
- $3,747
- Reserves months
- —
- Total cash needed
- —
Loan-product check · same deal, 3 products live
Conventional
25% down · 7.5% · 30yr
- Down + closing
- —
- Monthly P&I
- —
- Monthly cashflow
- —
- DSCR
- —
- Eligible?
- —
Personal DTI + credit; lowest rate.
DSCR
20% down · 8.5% · 30yr
- Down + closing
- —
- Monthly P&I
- —
- Monthly cashflow
- —
- DSCR
- —
- Eligible?
- —
No personal income docs; deal must DSCR.
Hard money
10% down · 12.0% · 12mo
- Down + closing
- —
- Monthly P&I
- —
- Monthly cashflow
- —
- DSCR
- —
- Eligible?
- —
Short-term bridge; refi at stabilization.
Listing history 16 events
-
2026-06-19days on market $124,900 Active 74 DOM
-
2026-06-18days on market $124,900 Active 73 DOM
-
2026-06-17days on market $124,900 Active 72 DOM
-
2026-06-16days on market $124,900 Active 71 DOM
-
2026-06-15days on market $124,900 Active 70 DOM
-
2026-06-14days on market $124,900 Active 68 DOM
-
2026-06-12days on market $124,900 Active 67 DOM
-
2026-06-09days on market $124,900 Active 64 DOM
-
2026-06-08days on market $124,900 Active 63 DOM
-
2026-06-07days on market $124,900 Active 62 DOM
-
2026-06-03days on market $124,900 Active 58 DOM
-
2026-06-02days on market $124,900 Active 57 DOM
-
2026-06-01days on market $124,900 Active 56 DOM
-
2026-05-31days on market $124,900 Active 55 DOM
-
2026-05-30days on market $124,900 Active 54 DOM
-
2026-04-06$125,900 Active 1135-char remark
Show marketing remark (1135 chars)
Unique opportunity to secure a home in the high demand Pineview Estates! This community has soo much to offer including but not limited to: Inground pool, maintained/paved roads, recreation facilities with library, party room, event room, etc. The community has plenty of guest parking in which there is around 8 spaces available right in front of the home for friends and family to use while visiting! The house should be Fully ADA accessible with ramp and wide hallways and access. One of the first things you will notice is the natural lighting throughout the whole home from all the double pane windows and multiple skylights. The bones of the home feel very solid. Just needing someone to make it their own with a little love. The seller has and will be continuing making upgrades while listed until the point of closing. Several rooms have already been painted. Appliances will be included with acceptable offer. Great floor plan with the vaulted ceilings making the house feel very warm and open. Shed in back in stellar shape ready to meet your needs. Fenced yard for those who have pets. Schedule a tour today before its gone!
ⓘ Source: listings_history table (triggers on properties + properties_extension) + one-shot
backfill from property_details.listing_events for pre-trigger history.
Tax reassessment forecast OR · Resets to sale price
- Current annual tax
- $602 · $50/mo
- Projected year-2 tax
- $1,212 · $101/mo
- Expected delta
- +$609/yr (+$51/mo · 101.2%)
ⓘ Screening estimate from a state-policy table — verify with the county assessor before closing.
Climate risk First Street
- Flood 9/10 Extreme FEMA zone X (unshaded) · 99% chance over 30 yrs
- Wildfire 8/10 Severe
- Heat 5/10 Major 8 d/yr ≥92°F today · 17 d/yr by 30 yrs out
- Wind 1/10 Low
- Air quality 9/10 Extreme 12 unhealthy d/yr today · 12 by 30 yrs out
Nearby sold comps map
Loading sold comps map…
Walkable amenities ~0.75 mi
Loading nearby amenities…
Taxation est. · year 1
- Rental income
- $22,259
- − Mortgage interest
- −$6,996
- − Property taxes
- −$602
- − Insurance
- −$1,422
- − Repairs & maintenance
- −$1,781
- − Management
- −$1,781
- − Depreciation
- −$3,633
- Taxable income
- $6,044
- Est. tax owed @ 24.0%
- −$1,451
- After-tax cash flow
- $6,250/yr
For passive investors: Depreciation is non-cash, so a rental often shows a tax loss while cash-flowing — sheltering income. Rental losses are passive: they offset passive income freely, and up to $25,000/yr can offset ordinary (W-2) income if you actively participate and your MAGI is under $100k (phasing out to $0 by $150k); unused losses carry forward. On sale, claimed depreciation is recaptured at up to 25%, and gains may owe capital-gains tax (a 1031 exchange can defer both). Figures are a year-1 estimate at your 24.0% rate — not tax advice; consult a CPA.
Schools (NCES district)
- District
- Sutherlin SD 130
- NCES district ID
- 4111940
- Math proficiency
- 19% ▼ -19.00%
- Reading proficiency
- 40% ▼ -14.00%
- Median HH income
- $40,425
- Composite
- 24.79/100
- National rank
- #7598
- State rank
- #47 of 58 in OR
Livability — Sutherlin
- Score
- 70/100
- State rank
- #135
- US rank
- #7711
Category grades
Schools grade is shown separately in the Schools card above.
Census & demographics
- Census place
- Sutherlin, OR
- Population (ZIP)
- 10,479
Population outlook (Douglas County) Hauer SSP2
- Today (2025)
- 105,191 people
- By 2030
- 102,664 · -2.4%
- By 2040
- 96,668 · -8.1%
- By 2050
- 91,279 · -13.2%
- By 2075
- 79,395 · -24.5%
- By 2100
- 66,107 · -37.2%
Race, ethnicity, and origin ACS 2023
- Neighborhood character
- Predominantly White (91%)
- Race & ethnicity
- White 91% Two or more races 4% Hispanic / Latino 3% Black 1%
- Common ancestry
- Italian 3% Serbian 3% Slovak 3%
- Foreign-born
- 2%
- Languages at home
- 99% English-only · Spanish 1%
Political lean MEDSL · Douglas
- 2024 margin
- Solid R (+37.7) · D 29.9% · R 67.6% · Other 2.5%
- 2008→2024 swing
- -17.6pp toward R · 2008: -20.1pp · 2024: -37.7pp
- All cycles
- 2024: R+37.7 2020: R+37.5 2016: R+39.4 2012: R+27.6 2008: R+20.1
Not yet ingested
- Civics
- —
Market trends
- HPI YoY
- ▼ -78.34%
- Current HPI
- 328.8614
- Rent YoY
- —
- Metro
- —
- State GDP YoY
- ▲ 2.05%
- F500 in state
- 2
Industry mix (Fortune 500 HQ in OR)
| Industry | F500 HQs | Revenue |
|---|---|---|
| Consumer Goods | 1 | $51B |
|
||
Price history
1 event — show timeline
- 2026-04-06 Listed $125,900 RMLS
Property tax history
+7.2%/yrLatest (2025): $602 · +2.2% YoY. Source: county tax records.
Cash-flow waterfall
monthlySold comps — $/sqft
last 12 mo · ≤1 miLoading sold comps…