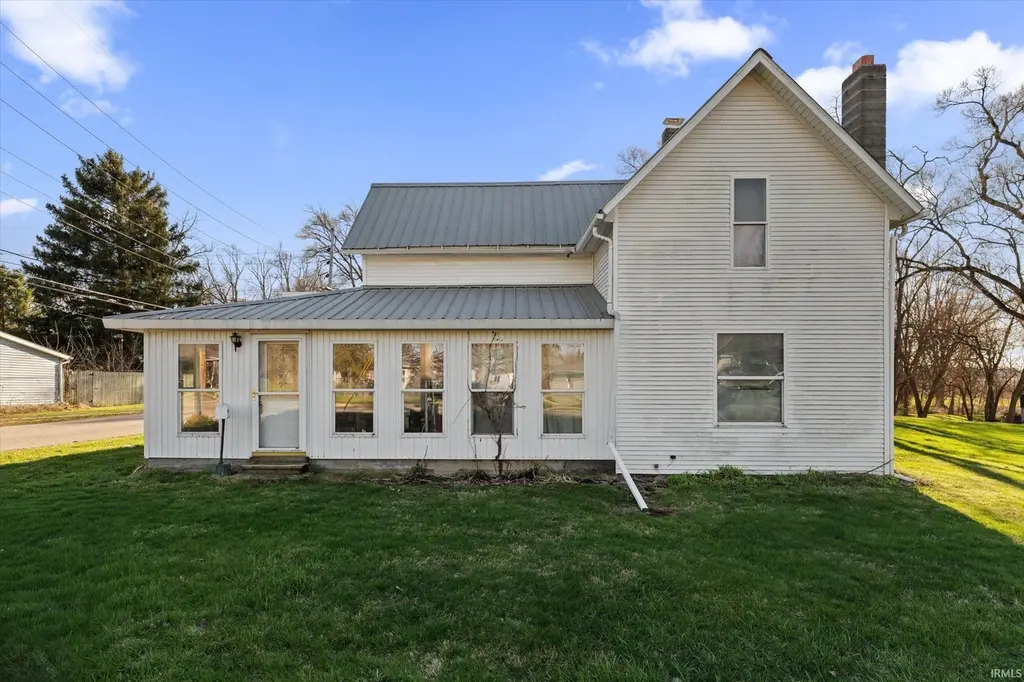
1101 N Huntington St · Syracuse, IN
Flood risk 1/10 · Minimal
- FEMA flood zone
- X (unshaded)
- Chance of flooding over 30 yrs
- 0.0%
- Est. flood insurance / yr
- $473 – $860
Fire risk 1/10 · Minimal
- Est. fire insurance / yr
- $717 – $1,331
Heat risk 2/10 · Minimal
- Hot days now (above 99°F)
- 7 days/yr
- Hot days in 30 yrs
- 16 days/yr
Wind risk 2/10 · Minimal
- Chance of severe wind over 30 yrs
- —
Air-quality risk 2/10 · Minimal
- Unhealthy air days now
- 1 days/yr
- Unhealthy air days in 30 yrs
- 1 days/yr
Risk factors via First Street. Map © Google.
Why this score? — see what drove the D+ grade
The composite is a weighted blend of 9 inputs, each scored 0–100. Each bar is that input's sub-score; the figure is the points it added to the 100-point composite (weight × sub-score).
- Cash flow +15.0/30.0
- ARV discount +15.0/15.0
- DSCR +4.6/10.0
- Livability +3.9/5.0
- 1% rule +3.1/10.0
- Schools +3.1/10.0
- Rent growth +2.5/5.0
- Condition / age +2.5/5.0
- Appreciation +0.0/10.0
$159,900
🖨 Deal sheet (PDF) 📄 Offer letter ✓ Due diligence
Listing remarks MLS
In Town Syracuse On Over an Acre , This 1 1/2 Story Home Has 3 Bedrooms , Large Full Bath With Jetted Tub , Eat in Kitchen/Dining Room with Appliances , Enclosed Wrap a Round Porch , Oversized Detached Garage and Utility Shed , Dog Kennel , TLC needed property is Sold As Is .
Key facts
- Golf courses
- Dedicated dog kennel
- Lakeside park
Tags
Neighborhood map
What this means for you Summary
Snapshot
- This is a 3-bed/1.0-bath single-family listed at $160k.
Deal economics
- At list price, monthly cash flow is $49 ($588/yr) — positive.
- The deal already cash-flows at list — no discount required.
- To meet the 1% rule (rent ≥ 1% of price), the offer needs to be $130k (18.8% below list).
- Recommended offer: $130k (18.8% below list) — sets the bar for 1% rule.
- Cap rate 6.7% vs local median 1.1% in Syracuse — top-decile yield for the area; either an underpriced asset or a hidden risk that comps aren't pricing in. Stress-test before assuming the spread holds.
Location & tenants
- Location reads 78/100 on livability (#32 in IN, #2,516 nationally) — a middle-class / working-renter tenant base. Strengths: crime A+, cost of living A+, health & safety A; Watch: employment D, commute F.
- Wawasee Community School Corporation (town): math 32% / reading 39% proficiency, ranked #179 of 301 in IN (top 60%) — families likely to look elsewhere, expect single-tenant / working-renter base with shorter leases.
- Zoned schools: Syracuse Elementary School (math 49% / reading 38%, grade F, #411 of 994 statewide, top 42%, 533 students, 52% FRL); Wawasee Middle School (math 24% / reading 34%, grade F, #222 of 330 statewide, top 67%, 507 students, 50% FRL); Wawasee High School (math 27% / reading 56%, grade F, #211 of 369 statewide, top 58%, 909 students, 44% FRL).
- Market conditions: 86 active listings in the ZIP; 261 units permitted in Kosciusko County in 2024 (10 in 5+ unit buildings).
Forward outlook
- Local home prices are declining (-3.0%/yr); year-one equity from $1k of loan paydown is wiped out by about $5k of value loss. Plan a longer hold.
- Kosciusko County population projected at +3% by 2050 — modest demand growth; plan on rents tracking national, not racing it.
Negotiation context
- It's been on market 20 days — a 2% lower offer ($158k) is reasonable based on typical stale-listing flexibility.
- 2 sale attempts since 4y ago with the ask held roughly flat each time — persistent listings suggest the price (not the market) is what's stuck; bring a comps-based counter.
- Current owner paid $113k; 42% above their basis — modest negotiation headroom, anchor on the comps not their cost.
Questions for the listing agent
- Built in 1960 — when were the roof, HVAC, electrical panel, plumbing, and water heater last replaced?
- Is there a deadline driving the sale (1031 exchange, divorce, estate, relocation)? That informs how much negotiation room exists.
- Schools are D-rated, which usually means shorter tenancies and higher turnover. Who's the typical renter profile here, and what's been the actual vacancy rate?
- The area grade is low — what's the realistic commute time and amenity access for the typical tenant pool here? Any planned neighborhood developments (good or bad) we should know about?
- What's the average days-on-market for RENTAL listings here right now (not sales)? A rising rental-DOM trend means longer vacancies and softer asking-rent achievability than the comps imply.
- What's the recent tenant-quality profile in this submarket — average credit score on applications, eviction rate, late-payment / NSF rate, and stable-employment percentage? A property-management company in the area should have these aggregated.
- How much new for-sale + rental construction is in the pipeline within 1–3 miles? Heavy new supply typically softens prices + rents 12–24 months out; constrained supply supports both.
Investment metrics
- 1% rule
- 0.81% ✗
- Cap rate
- 6.66%
- Cash-on-cash
- 1.31%
- DSCR
- 1.06
- GRM
- 10.3
CMA / ARV
- ARV (on-the-fly)
- $207,021
- Comps found
- 10
Show comp detail 10 sales within ~0.75 mi
| Address | Dist | Beds/Ba | Sqft | Sold | Price | $/sf | Match |
|---|---|---|---|---|---|---|---|
| 603 N Harrison St | 0.48mi | 2/1.0 (-1) | 1,416 (+3%) | 1mo | $195,500 | $138 | 66 |
| 200 W Washington St | 0.31mi | 3/2.0 | 1,492 (+9%) | 0mo | $187,000 | $125 | 66 |
| 205 W Washington St | 0.33mi | 3/2.0 | 1,474 (+8%) | 5mo | $250,000 | $170 | 64 |
| 608 W Polywood Way | 0.53mi | 3/1.5 | 1,410 (+3%) | 11mo | $190,000 | $135 | 59 |
| 612 E Northshore Dr | 0.51mi | 3/2.0 | 1,421 (+4%) | 20mo | $268,000 | $189 | 50 |
| 1100 N Long Dr | 0.40mi | 3/1.0 | 1,488 (+8%) | 24mo | $230,000 | $155 | 47 |
| 708 E Rose Ln | 0.57mi | 3/2.0 | 1,460 (+6%) | 16mo | $260,000 | $178 | 46 |
| 211 W Boston St | 0.72mi | 2/1.0 (-1) | 1,492 (+9%) | 2mo | $225,000 | $151 | 45 |
| 409 W Boston St | 0.67mi | 4/1.0 (+1) | 1,468 (+7%) | 15mo | $195,850 | $133 | 40 |
| 104 E Henry St | 0.61mi | 3/2.0 | 1,546 (+13%) | 22mo | $222,000 | $144 | 28 |
Match score weights: distance 35% · size 25% · config 20% · recency 20%. Top-matched comps best support the ARV.
Projected returns pro-forma
-3.0% appreciation · 3.0% rent growth · sell at horizon
- IRR
- -14.3%
- Equity multiple
- 0.49×
- Total profit
- $-22,848
- Equity at exit
- $23,842
- IRR
- -5.6%
- Equity multiple
- 0.64×
- Total profit
- $-16,116
- Equity at exit
- $13,825
Cash invested: $44,772 (down + closing). Projections, not guarantees.
Landlord ↔ Tenant lean methodology
- Overall (STATE)
- 90 Strongly Landlord-Friendly
- State Indiana
- 90 Strongly Landlord-Friendly · R+11
- County
- — inherits STATE
- City
- — inherits STATE
ZIP-level market 46567
- Home prices YoY
- -21.4%
- Active inventory
- 86
- Price-to-rent
- 10.3×
Monthly cashflow live
- Estimated rent
- $1,299 medium interval (Pro) →
- Mortgage (P&I)
- −$839
- Tax from tax record
- −$72 /mo · $860/yr
- Insurance
- −$67
- HOA
- −$0
- Vacancy / Maint / Mgmt
- −$273
- Net cashflow
- $49
Break-even live
Sensitivity live
| Price | -10% $140 | -5% $94 | +0% $49 | +5% $4 | +10% $-41 |
|---|---|---|---|---|---|
| Rent | -10% $-54 | -5% $-2 | +0% $49 | +5% $100 | +10% $152 |
| Rate | -1.0pp $130 | -0.5pp $90 | base $49 | +0.5pp $8 | +1.0pp $-35 |
UW: 25.0% down · 7.5% · 30yr · 1.5% tax · 5.0% vac · 8.0% maint · 8.0% mgmt
Financing live
Cash to close
- Down payment
- $39,975
- Closing costs
- $4,797
- Reserves months
- —
- Total cash needed
- —
Loan-product check · same deal, 3 products live
Conventional
25% down · 7.5% · 30yr
- Down + closing
- —
- Monthly P&I
- —
- Monthly cashflow
- —
- DSCR
- —
- Eligible?
- —
Personal DTI + credit; lowest rate.
DSCR
20% down · 8.5% · 30yr
- Down + closing
- —
- Monthly P&I
- —
- Monthly cashflow
- —
- DSCR
- —
- Eligible?
- —
No personal income docs; deal must DSCR.
Hard money
10% down · 12.0% · 12mo
- Down + closing
- —
- Monthly P&I
- —
- Monthly cashflow
- —
- DSCR
- —
- Eligible?
- —
Short-term bridge; refi at stabilization.
Listing history 5 events
-
2026-04-18status Pending
-
2026-03-27$159,900 Active
-
2022-09-09soldstatus $113,000 Closed 277-char remark
Show marketing remark (277 chars)
In Town Syracuse On Over an Acre , This 1 1/2 Story Home Has 3 Bedrooms , Large Full Bath With Jetted Tub , Eat in Kitchen/Dining Room with Appliances , Enclosed Wrap a Round Porch , Oversized Detached Garage and Utility Shed , Dog Kennel , TLC needed property is Sold As Is .
-
2022-08-03historical Active Under Contract 277-char remark
Show marketing remark (277 chars)
In Town Syracuse On Over an Acre , This 1 1/2 Story Home Has 3 Bedrooms , Large Full Bath With Jetted Tub , Eat in Kitchen/Dining Room with Appliances , Enclosed Wrap a Round Porch , Oversized Detached Garage and Utility Shed , Dog Kennel , TLC needed property is Sold As Is .
-
2022-07-27$109,900 Active 277-char remark
Show marketing remark (277 chars)
In Town Syracuse On Over an Acre , This 1 1/2 Story Home Has 3 Bedrooms , Large Full Bath With Jetted Tub , Eat in Kitchen/Dining Room with Appliances , Enclosed Wrap a Round Porch , Oversized Detached Garage and Utility Shed , Dog Kennel , TLC needed property is Sold As Is .
ⓘ Source: listings_history table (triggers on properties + properties_extension) + one-shot
backfill from property_details.listing_events for pre-trigger history.
Tax reassessment forecast IN · Partial reset (capped growth)
- Current annual tax
- $860 · $72/mo
- Projected year-2 tax
- $1,110 · $92/mo
- Expected delta
- +$249/yr (+$21/mo · 29.0%)
ⓘ Screening estimate from a state-policy table — verify with the county assessor before closing.
Climate risk First Street
- Flood 1/10 Low FEMA zone X (unshaded) · 0% chance over 30 yrs
- Wildfire 1/10 Low
- Heat 2/10 Low 7 d/yr ≥99°F today · 16 d/yr by 30 yrs out
- Wind 2/10 Low
- Air quality 2/10 Low 1 unhealthy d/yr today · 1 by 30 yrs out
Nearby sold comps map
Loading sold comps map…
Walkable amenities ~0.75 mi
Loading nearby amenities…
Taxation est. · year 1
- Rental income
- $15,583
- − Mortgage interest
- −$8,957
- − Property taxes
- −$860
- − Insurance
- −$800
- − Repairs & maintenance
- −$1,247
- − Management
- −$1,247
- − Depreciation
- −$4,652
- Taxable loss
- −$2,179
- Est. tax savings @ 24.0%
- +$523
- After-tax cash flow
- $1,111/yr
For passive investors: Depreciation is non-cash, so a rental often shows a tax loss while cash-flowing — sheltering income. Rental losses are passive: they offset passive income freely, and up to $25,000/yr can offset ordinary (W-2) income if you actively participate and your MAGI is under $100k (phasing out to $0 by $150k); unused losses carry forward. On sale, claimed depreciation is recaptured at up to 25%, and gains may owe capital-gains tax (a 1031 exchange can defer both). Figures are a year-1 estimate at your 24.0% rate — not tax advice; consult a CPA.
Schools (NCES district)
- District
- Wawasee Community School Corporation
- NCES district ID
- 1805550
- Math proficiency
- 32% ▼ -7.00%
- Reading proficiency
- 39% ▼ -7.00%
- Median HH income
- $52,439
- Composite
- 30.97/100
- National rank
- #6100
- State rank
- #179 of 301 in IN
Livability — Syracuse
- Score
- 78/100
- State rank
- #32
- US rank
- #2516
Category grades
Schools grade is shown separately in the Schools card above.
Census & demographics
- Census place
- Syracuse, IN
- Population (ZIP)
- 9,371
Population outlook (Kosciusko County) Hauer SSP2
- Today (2025)
- 81,747 people
- By 2030
- 82,878 · +1.4%
- By 2040
- 84,270 · +3.1%
- By 2050
- 84,191 · +3.0%
- By 2075
- 82,918 · +1.4%
- By 2100
- 74,808 · -8.5%
Race, ethnicity, and origin ACS 2023
- Neighborhood character
- Predominantly White (96%)
- Race & ethnicity
- White 96% Two or more races 2% Hispanic / Latino 1%
- Common ancestry
- Lithuanian 3% Romanian 2% Iranian 1%
- Foreign-born
- 1%
- Languages at home
- 95% English-only · German/W. Germanic 4% Spanish 1%
Political lean MEDSL · Kosciusko
- 2024 margin
- Solid R (+52.3) · D 22.9% · R 75.2% · Other 1.9%
- 2008→2024 swing
- -14.9pp toward R · 2008: -37.3pp · 2024: -52.3pp
- All cycles
- 2024: R+52.3 2020: R+50.7 2016: R+55.1 2012: R+52.2 2008: R+37.3
Not yet ingested
- Civics
- —
Market trends
- HPI YoY
- ▼ -75.32%
- Current HPI
- 276.7243
- Rent YoY
- —
- Metro
- —
- State GDP YoY
- ▲ 2.90%
- F500 in state
- 18
Industry mix (Fortune 500 HQ in IN)
| Industry | F500 HQs | Revenue |
|---|---|---|
| Industrial Machinery | 2 | $37B |
|
||
| Healthcare | 1 | $177B |
|
||
| Pharmaceuticals | 1 | $45B |
|
||
| Metals / Steel | 1 | $18B |
|
||
| Agriculture | 1 | $17B |
|
||
| Packaging | 1 | $12B |
|
||
Price history
+45.5% since first listed5 events — show timeline
- 2026-04-18 Pending — IRMLS
- 2026-03-27 Listed $159,900 IRMLS
- 2022-09-09 Sold (MLS) $113,000 IRMLS
- 2022-08-03 Contingent — IRMLS
- 2022-07-27 Listed $109,900 IRMLS
Property tax history
+11.4%/yrLatest (2024): $860 · +12.0% YoY. Source: county tax records.
Cash-flow waterfall
monthlySold comps — $/sqft
last 12 mo · ≤1 miLoading sold comps…