6180 Via Real #59 · Carpinteria, CA
Flood risk 1/10 · Minimal
- FEMA flood zone
- X (unshaded)
- Chance of flooding over 30 yrs
- 0.0%
- Est. flood insurance / yr
- $507 – $1,088
Fire risk 4/10 · Minor
- Est. fire insurance / yr
- $659 – $1,223
Heat risk 6/10 · Moderate
- Hot days now (above 84°F)
- 6 days/yr
- Hot days in 30 yrs
- 14 days/yr
Wind risk 1/10 · Minimal
- Chance of severe wind over 30 yrs
- —
Air-quality risk 9/10 · Severe
- Unhealthy air days now
- 12 days/yr
- Unhealthy air days in 30 yrs
- 12 days/yr
Risk factors via First Street. Map © Google.
Why this score? — see what drove the B- grade
The composite is a weighted blend of 9 inputs, each scored 0–100. Each bar is that input's sub-score; the figure is the points it added to the 100-point composite (weight × sub-score).
- Cash flow +26.7/30.0
- DSCR +9.2/10.0
- ARV discount +8.7/15.0
- 1% rule +7.2/10.0
- Rent growth +5.0/5.0
- Livability +3.4/5.0
- Schools +3.2/10.0
- Condition / age +2.5/5.0
- Appreciation +0.0/10.0
$475,000
🖨 Deal sheet 📄 Offer letter ✓ Due diligence
Listing remarks
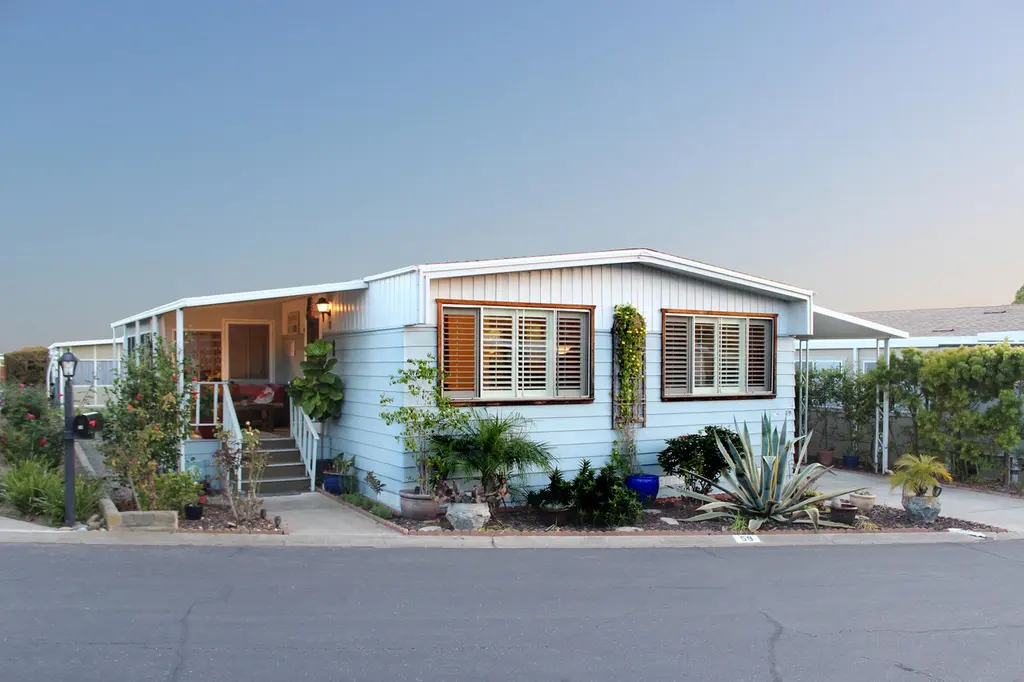
Enjoy beautiful mountain views from this stylish & lovingly maintained 2-bedroom, 2-bath home in Vista de Santa Barbara, Carpinteria's premiere park for age 55+ residents. The mountain-view living room is large enough to be currently used as both a gracious area for receiving guests and an office space. The adjacent dining area includes a lighted built-in display cabinet and plantation shutters, & leads to a well-designed chef's kitchen that features a large skylight over an 8-foot center island. The family room opens to a spacious sun room that also has mountain views. Outdoors are two garden areas, an intimate seating area, & the mountain-view front porch. The home is loca
Key facts
- Spacious sun room
- Large skylight
- Garden areas
Tags
Property features AI
Finance
- Other: Pets allowed (with limitations)
- HOA & community: Association/community amenities include pool, spa/hot tub, clubhouse, game room, RV/boat storage, greenbelt, and guest parking; Association fees cover property management and common area maintenance; Association present
Exterior
- Parking: 2 carport spaces
- Utilities: Carpinteria city water; Underground utilities
- Home design: Double wide manufactured home (Universal); Mobile dimensions approximately 24 ft wide by 64 ft long; Property reported in a multi-building park (102 buildings)
- Construction: Updated/remodeled condition
- Exterior features: Composition roof; Shed(s); Level lot; Near public transit; Mountain, panoramic and scenic setting views
Interior
- Kitchen: Refrigerator; Built-in gas oven; Dishwasher; Garbage disposal; Microwave
- Bedrooms: Primary bedroom
- Flooring: Carpet
- Bathrooms: 2 full bathrooms
- Heating & cooling: Forced air heating; Ceiling fans (no central cooling)
- Interior features: Plantation shutters and blinds; Updated/remodeled condition; Family room; Sun room; Formal dining and dining area; Breakfast bar
- Laundry & utility: Washer and dryer; Laundry room with gas hookup
Neighborhood map
What this means for you Summary
Snapshot
- This is a 2-bed/2.0-bath manufactured listed at $475k.
Deal economics
- At list price, monthly cash flow is $1k ($15k/yr) — positive.
- The deal already cash-flows at list — no discount required.
- Meets the 1% rule at list price ($6k rent vs $475k).
- Recommended offer: $461k (3.0% below list) — sets the bar for market timing.
- Cap rate 9.5% vs local median 3.1% in Carpinteria — top-decile yield for the area; either an underpriced asset or a hidden risk that comps aren't pricing in. Stress-test before assuming the spread holds.
Location & tenants
- Location reads 68/100 on livability (#283 in CA) — a middle-class / working-renter tenant base. Strengths: commute A+, employment A+, crime B+; Watch: amenities F, cost of living F.
- Carpinteria Unified (suburban): math 27% / reading 43% proficiency, ranked #255 of 517 in CA (top 49%) — families likely to look elsewhere, expect single-tenant / working-renter base with shorter leases.
- Zoned schools: Canalino Elementary (math 27% / reading 37%, grade F, #779 of 1,571 statewide, top 52%, 498 students, 62% FRL).
- Market conditions: Rents rising fast (+15.2%/yr); 75 active listings in the ZIP; 1 comparable units currently listed for rent nearby; high-income renter base; 719 units permitted in Santa Barbara County in 2024 (217 in 5+ unit buildings).
- At $5,779/mo this rent would consume 63% of the median local household income ($110k/yr) (locally 718% of renters already pay >50% of income on rent) — very limited rent-growth headroom before tenants either downsize or default.
Forward outlook
- Local home prices are declining (-3.0%/yr); year-one equity from $3k of loan paydown is wiped out by about $14k of value loss. Plan a longer hold.
- Santa Barbara County population projected at +20% by 2050 — long-run rental-demand tailwind backs the buy-and-hold thesis.
- At projected returns (-3.0% appreciation + 8.0% rent growth), your $133k cash investment doubles in ~7 years — after that, you're playing with house money.
Negotiation context
- It's been on market 45 days — a 3% lower offer ($461k) is reasonable based on typical stale-listing flexibility.
- 2 sale attempts since 26y ago with the ask held roughly flat each time — persistent listings suggest the price (not the market) is what's stuck; bring a comps-based counter.
Risks & watch-outs
- Climate carrying-cost: extreme-heat days projected 6→14/yr by 2055 (HVAC capex compounding) — expect insurance premiums to compound above CPI over the hold.
Questions for the listing agent
- It's been on market 45 days. Have you received any prior offers? Is the seller open to a 3% concession, seller financing, or rate buy-down credit?
- Built in 1973 — when were the roof, HVAC, electrical panel, plumbing, and water heater last replaced?
- Is there a deadline driving the sale (1031 exchange, divorce, estate, relocation)? That informs how much negotiation room exists.
- Schools are D-rated, which usually means shorter tenancies and higher turnover. Who's the typical renter profile here, and what's been the actual vacancy rate?
- What's the average days-on-market for RENTAL listings here right now (not sales)? A rising rental-DOM trend means longer vacancies and softer asking-rent achievability than the comps imply.
- What's the recent tenant-quality profile in this submarket — average credit score on applications, eviction rate, late-payment / NSF rate, and stable-employment percentage? A property-management company in the area should have these aggregated.
- How much new for-sale + rental construction is in the pipeline within 1–3 miles? Heavy new supply typically softens prices + rents 12–24 months out; constrained supply supports both.
Investment metrics
- 1% rule
- 1.22% ✓
- Cap rate
- 9.53%
- Cash-on-cash
- 11.58%
- DSCR
- 1.52
- GRM
- 6.8
CMA / ARV
- ARV (median comp)
- $487,500
- List price
- $475,000
- Delta
- -2.56%
- Verdict
- FAIR
- Comps
- 8 within 1.0 mi
Show comp detail 4 sales within ~0.75 mi
| Address | Dist | Beds/Ba | Sqft | Sold | Price | $/sf | Match |
|---|---|---|---|---|---|---|---|
| 6180 Via Real #56 | 0.03mi | 2/2.0 | 1,440 (-5%) | 8mo | $415,000 | $288 | 84 |
| 6180 Via Real #65 | 0.03mi | 3/2.0 (+1) | 1,560 (+3%) | 11mo | $629,000 | $403 | 79 |
| 6180 Via Real #120 | 0.17mi | 3/2.0 (+1) | 1,660 (+10%) | 15mo | $680,000 | $410 | 58 |
| 5750 Via Real #244 | 0.75mi | 2/2.0 | 1,344 (-11%) | 9mo | $355,000 | $264 | 39 |
Match score weights: distance 35% · size 25% · config 20% · recency 20%. Top-matched comps best support the ARV.
Projected returns pro-forma
-3.0% appreciation · 8.0% rent growth · sell at horizon
- IRR
- 6.5%
- Equity multiple
- 1.27×
- Total profit
- $35,381
- Equity at exit
- $70,824
- IRR
- 19.9%
- Equity multiple
- 3.07×
- Total profit
- $275,405
- Equity at exit
- $41,069
Cash invested: $133,000 (down + closing). Projections, not guarantees.
Landlord ↔ Tenant lean methodology
- Overall (STATE)
- 18 Strongly Tenant-Friendly
- State California
- 18 Strongly Tenant-Friendly · D+13
- County
- — inherits STATE
- City
- — inherits STATE
ZIP-level market 93013
- Rents YoY
- 15.2%
- Active inventory
- 75
- Price-to-rent
- 6.8×
Monthly cashflow live
- Estimated rent
- $5,779 medium interval (Pro) →
- Mortgage (P&I)
- −$2,491
- Tax est. 1.5%
- −$594 /mo · $7,125/yr
- Insurance
- −$198
- HOA
- −$0
- Vacancy / Maint / Mgmt
- −$1,214
- Net cashflow
- $1,283
Break-even live
UW: 25.0% down · 7.5% · 30yr · 1.5% tax · 5.0% vac · 8.0% maint · 8.0% mgmt
Financing live
Cash to close
- Down payment
- $118,750
- Closing costs
- $14,250
- Reserves months
- —
- Total cash needed
- —
Loan-product check · same deal, 3 products live
Conventional
25% down · 7.5% · 30yr
- Down + closing
- —
- Monthly P&I
- —
- Monthly cashflow
- —
- DSCR
- —
- Eligible?
- —
Personal DTI + credit; lowest rate.
DSCR
20% down · 8.5% · 30yr
- Down + closing
- —
- Monthly P&I
- —
- Monthly cashflow
- —
- DSCR
- —
- Eligible?
- —
No personal income docs; deal must DSCR.
Hard money
10% down · 12.0% · 12mo
- Down + closing
- —
- Monthly P&I
- —
- Monthly cashflow
- —
- DSCR
- —
- Eligible?
- —
Short-term bridge; refi at stabilization.
Rent comps 1 comps
| Address | Beds | Baths | Sqft | Rent | $/sqft | DOM | Units | Dist |
|---|---|---|---|---|---|---|---|---|
| 5573 Calle Arena Carpinteria, CA | 3.0 | 2.0 | 1860 | $7,500 | $4.03 | 23d | 1 | 1.22mi |
Listing history 18 events
-
2026-06-18days on market $475,000 Active 45 DOM
-
2026-06-17days on market $475,000 Active 44 DOM
-
2026-06-16days on market $475,000 Active 43 DOM
-
2026-06-15days on market $475,000 Active 42 DOM
-
2026-06-13days on market $475,000 Active 40 DOM
-
2026-06-13days on market $475,000 Active 39 DOM
-
2026-06-10days on market $475,000 Active 37 DOM
-
2026-06-09days on market $475,000 Active 36 DOM
-
2026-06-08days on market $475,000 Active 35 DOM
-
2026-06-07days on market $475,000 Active 34 DOM
-
2026-06-05days on market $475,000 Active 31 DOM
-
2026-06-03days on market $475,000 Active 30 DOM
-
2026-06-02days on market $475,000 Active 29 DOM
-
2026-06-01days on market $475,000 Active 28 DOM
-
2026-05-31days on market $475,000 Active 27 DOM
-
2026-05-04$475,000 Active 922-char remark
-
2000-05-30historical
-
2000-05-01$132,800
ⓘ Source: listings_history table (triggers on properties + properties_extension) + one-shot
backfill from property_details.listing_events for pre-trigger history.
Climate risk First Street
- Flood 1/10 Low FEMA zone X (unshaded) · 0% chance over 30 yrs
- Wildfire 4/10 Moderate
- Heat 6/10 Major 6 d/yr ≥84°F today · 14 d/yr by 30 yrs out
- Wind 1/10 Low
- Air quality 9/10 Extreme 12 unhealthy d/yr today · 12 by 30 yrs out
Nearby sold comps map
Loading sold comps map…
Walkable amenities ~0.75 mi
Loading nearby amenities…
Taxation est. · year 1
- Rental income
- $69,353
- − Mortgage interest
- −$26,607
- − Property taxes
- −$7,125
- − Insurance
- −$2,375
- − Repairs & maintenance
- −$5,548
- − Management
- −$5,548
- − Depreciation
- −$13,818
- Taxable income
- $8,331
- Est. tax owed @ 24.0%
- −$1,999
- After-tax cash flow
- $13,398/yr
For passive investors: Depreciation is non-cash, so a rental often shows a tax loss while cash-flowing — sheltering income. Rental losses are passive: they offset passive income freely, and up to $25,000/yr can offset ordinary (W-2) income if you actively participate and your MAGI is under $100k (phasing out to $0 by $150k); unused losses carry forward. On sale, claimed depreciation is recaptured at up to 25%, and gains may owe capital-gains tax (a 1031 exchange can defer both). Figures are a year-1 estimate at your 24.0% rate — not tax advice; consult a CPA.
Schools (NCES district)
- District
- Carpinteria Unified
- NCES district ID
- 0607560
- Math proficiency
- 27% ▼ -16.00%
- Reading proficiency
- 43% ▼ -5.00%
- Median HH income
- $70,780
- Composite
- 32.27/100
- National rank
- #5758
- State rank
- #255 of 517 in CA
Livability — Carpinteria
- Score
- 68/100
- State rank
- #283
- US rank
- #9548
Category grades
Schools grade is shown separately in the Schools card above.
Census & demographics
- Census place
- Carpinteria, CA
- County
- Santa Barbara County · 410,380 people
- City population
- 16,317
- Metro
- Santa Maria-Santa Barbara, CA
- Population (ZIP)
- 16,317
- Household income
- $110,359
- Rent vs Own
- Severe rent burden
- 718.0
Population outlook (Santa Barbara County) Hauer SSP2
- Today (2025)
- 484,679 people
- By 2030
- 505,323 · +4.3%
- By 2040
- 545,783 · +12.6%
- By 2050
- 584,263 · +20.5%
- By 2075
- 682,586 · +40.8%
- By 2100
- 723,188 · +49.2%
Race, ethnicity, and origin ACS 2023
- Neighborhood character
- Diverse neighborhood (Simpson 0.57)
- Race & ethnicity
- White 51% Hispanic / Latino 41% Two or more races 17% Asian 3% Native American 1%
- Hispanic origin (detail)
- Mexican 38%
- Common ancestry
- Slovak 4% Lithuanian 3% Romanian 2%
- Foreign-born
- 22% · Canada
- Languages at home
- 66% English-only · Spanish 29% Other Indo-European 1% Russian/Polish/Slavic 1%
Political lean MEDSL · Santa Barbara
- 2024 margin
- Strong D (+26.7) · D 61.8% · R 35.1% · Other 3.1%
- 2008→2024 swing
- +3.8pp toward D · 2008: 22.9pp · 2024: 26.7pp
- All cycles
- 2024: D+26.7 2020: D+32.1 2016: D+28.2 2012: D+17.1 2008: D+22.9
Not yet ingested
- Civics
- —
Market trends
- HPI YoY
- ▼ -1390.66%
- Current HPI
- 345.0001
- Rent YoY
- ▲ 15.23%
- Metro
- Santa Maria-Santa Barbara, CA
- State GDP YoY
- ▲ 3.21%
- F500 in state
- 116
Industry mix (Fortune 500 HQ in CA)
| Industry | F500 HQs | Revenue |
|---|---|---|
| Technology | 27 | $1,492B |
|
||
| Financial Services | 3 | $174B |
|
||
| Retail | 3 | $44B |
|
||
| Insurance | 3 | $26B |
|
||
| Media / Entertainment | 2 | $115B |
|
||
| Pharmaceuticals / Biotech | 2 | $62B |
|
||
Price history
+257.7% since first listed3 events — show timeline
- 2026-05-04 Listed $475,000 SBMLS
- 2000-05-30 Listing Removed — SBMLS
- 2000-05-01 Listed $132,800 SBMLS
Cash-flow waterfall
monthlySold comps — $/sqft
last 12 mo · ≤1 miLoading sold comps…