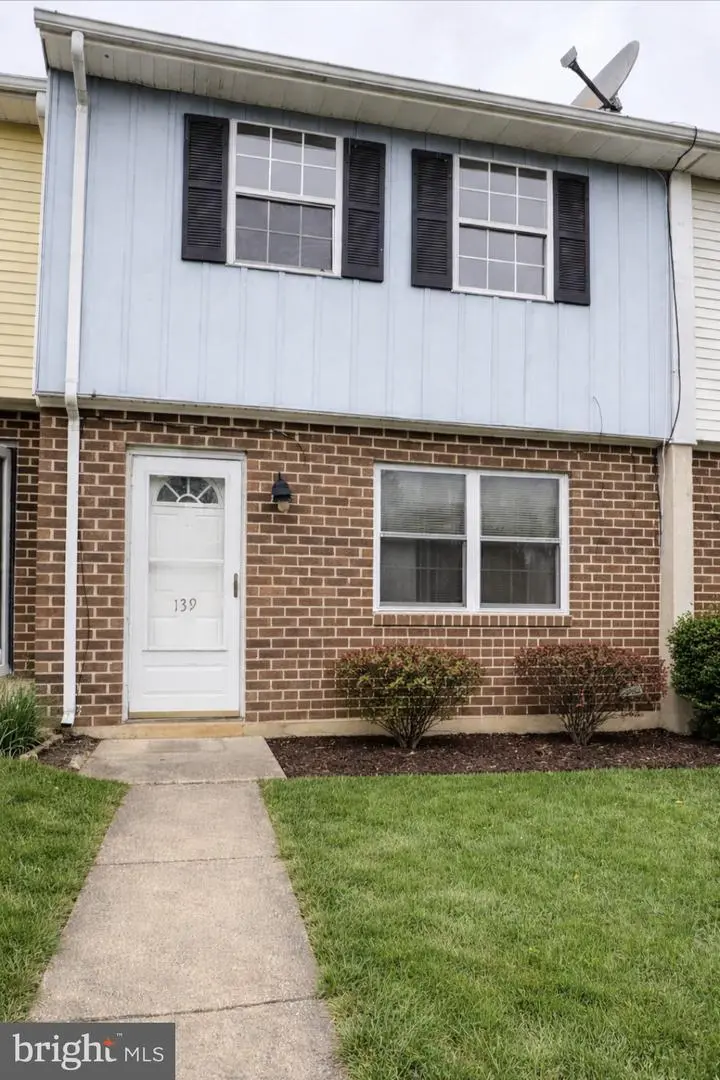
139 Danford Dr · Elkton, MD
Flood risk 1/10 · Minimal
- FEMA flood zone
- X (unshaded)
- Chance of flooding over 30 yrs
- 0.0%
- Est. flood insurance / yr
- $507 – $1,088
Fire risk 3/10 · Minor
- Est. fire insurance / yr
- $755 – $1,403
Heat risk 7/10 · Major
- Hot days now (above 105°F)
- 7 days/yr
- Hot days in 30 yrs
- 15 days/yr
Wind risk 6/10 · Moderate
- Chance of severe wind over 30 yrs
- 27.0%
Air-quality risk 4/10 · Minor
- Unhealthy air days now
- 3 days/yr
- Unhealthy air days in 30 yrs
- 5 days/yr
Risk factors via First Street. Map © Google.
Why this score? — see what drove the C- grade
The composite is a weighted blend of 9 inputs, each scored 0–100. Each bar is that input's sub-score; the figure is the points it added to the 100-point composite (weight × sub-score).
- Cash flow +24.6/30.0
- DSCR +7.9/10.0
- 1% rule +5.8/10.0
- ARV discount +5.4/15.0
- Livability +3.2/5.0
- Rent growth +3.1/5.0
- Condition / age +2.5/5.0
- Schools +2.2/10.0
- Appreciation +0.0/10.0
$194,000
🖨 Deal sheet (PDF) 📄 Offer letter ✓ Due diligence
Listing remarks MLS
Welcome home! Here is your chance to own and be less than renting. This home offers 2 bedrooms and one bathroom. Nice size backyard large living room and kitchen Newer roof and hvac system, perfect location minutes to Delaware and downtown Elkton. Professional pictures to come Tuesday!
Key facts
- Built 1986
- Listed 60 days
Neighborhood map
What this means for you Summary
Snapshot
- This is a 2-bed/1.0-bath townhouse listed at $194k.
Deal economics
- At list price, monthly cash flow is $400 ($5k/yr) — positive.
- The deal already cash-flows at list — no discount required.
- Meets the 1% rule at list price ($2k rent vs $194k).
- Recommended offer: $182k (6.0% below list) — sets the bar for market timing.
- Cap rate 8.8% vs local median 4.1% in Elkton — top-decile yield for the area; either an underpriced asset or a hidden risk that comps aren't pricing in. Stress-test before assuming the spread holds.
Location & tenants
- Location reads 65/100 on livability (#261 in MD) — a middle-class / working-renter tenant base. Strengths: housing A+, health & safety A+, cost of living A; Watch: schools F, crime F, commute F.
- Cecil County Public Schools (rural): math 15% / reading 30% proficiency, ranked #15 of 24 in MD (top 62%) — low school quality limits family demand, transient renter base, plan for 1-2y turnover.
- Market conditions: Rents rising (+2.3%/yr); 207 active listings in the ZIP; 4 comparable units currently listed for rent nearby; rentals at typical pace (median 23d on market — plan ~3-4 weeks tenant-placement turnaround); solid renter incomes; 563 units permitted in Cecil County in 2024 (330 in 5+ unit buildings).
Forward outlook
- Local home prices are declining (-3.0%/yr); year-one equity from $1k of loan paydown is wiped out by about $6k of value loss. Plan a longer hold.
Negotiation context
- It's been on market 61 days — a 6% lower offer ($182k) is reasonable based on typical stale-listing flexibility.
- 5 sale attempts since 28y ago with the ask held roughly flat each time — persistent listings suggest the price (not the market) is what's stuck; bring a comps-based counter.
- Current owner paid $88k; list at $194k implies a 119% gain — meaningful room to come down on a strong offer.
Risks & watch-outs
- Climate carrying-cost: major wind risk, 27% chance of damaging wind over 30y; extreme-heat days projected 7→15/yr by 2055 (HVAC capex compounding) — expect insurance premiums to compound above CPI over the hold.
Questions for the listing agent
- It's been on market 61 days. Have you received any prior offers? Is the seller open to a 6% concession, seller financing, or rate buy-down credit?
- Why hasn't it sold? Are there any deal-killer items the seller is aware of (foundation, flood, title, zoning, code violations)?
- Is there a deadline driving the sale (1031 exchange, divorce, estate, relocation)? That informs how much negotiation room exists.
- Schools are F-rated, which usually means shorter tenancies and higher turnover. Who's the typical renter profile here, and what's been the actual vacancy rate?
- Crime grade is F in this area — have there been break-ins, vandalism, or insurance claims at this property in the last 3 years? What carrier currently insures it and at what premium?
- What's the average days-on-market for RENTAL listings here right now (not sales)? A rising rental-DOM trend means longer vacancies and softer asking-rent achievability than the comps imply.
- What's the recent tenant-quality profile in this submarket — average credit score on applications, eviction rate, late-payment / NSF rate, and stable-employment percentage? A property-management company in the area should have these aggregated.
- How much new for-sale + rental construction is in the pipeline within 1–3 miles? Heavy new supply typically softens prices + rents 12–24 months out; constrained supply supports both.
Investment metrics
- 1% rule
- 1.08% ✓
- Cap rate
- 8.77%
- Cash-on-cash
- 8.84%
- DSCR
- 1.39
- GRM
- 7.7
CMA / ARV
- ARV (median comp)
- $185,286
- List price
- $194,000
- Delta
- 4.70%
- Verdict
- FAIR
- Comps
- 20 within 1.0 mi
Show comp detail 12 sales within ~0.75 mi
| Address | Dist | Beds/Ba | Sqft | Sold | Price | $/sf | Match |
|---|---|---|---|---|---|---|---|
| 120 Danford Dr | 0.05mi | 3/1.0 (+1) | 1,330 (0%) | 11mo | $200,000 | $150 | 84 |
| 121 Danford Dr | 0.03mi | 3/1.0 (+1) | 1,330 (0%) | 14mo | $183,000 | $138 | 81 |
| 6 Transom Ct | 0.38mi | 3/1.5 (+1) | 1,344 (+1%) | 0mo | $206,500 | $154 | 73 |
| 41 Transom Ct | 0.30mi | 3/1.5 (+1) | 1,280 (-4%) | 2mo | $210,000 | $164 | 71 |
| 182 E Village Rd | 0.34mi | 3/1.5 (+1) | 1,224 (-8%) | 7mo | $168,000 | $137 | 58 |
| 156 E Village Rd | 0.40mi | 3/1.5 (+1) | 1,232 (-7%) | 6mo | $203,000 | $165 | 57 |
| 23 Loran Ct | 0.36mi | 2/1.5 | 1,152 (-13%) | 4mo | $139,000 | $121 | 56 |
| 25 Hatteras Ct | 0.37mi | 2/1.5 | 1,152 (-13%) | 6mo | $205,000 | $178 | 54 |
| 23 Hatteras Ct | 0.37mi | 3/1.5 (+1) | 1,152 (-13%) | 7mo | $211,000 | $183 | 48 |
| 143 E Village Rd | 0.39mi | 3/1.5 (+1) | 1,152 (-13%) | 10mo | $237,500 | $206 | 44 |
| 49 Thatch Ct | 0.45mi | 2/1.5 | 1,152 (-13%) | 15mo | $211,000 | $183 | 42 |
| 155 E Village Rd | 0.37mi | 3/2.5 (+1) | 1,528 (+15%) | 6mo | $202,000 | $132 | 42 |
Match score weights: distance 35% · size 25% · config 20% · recency 20%. Top-matched comps best support the ARV.
Projected returns pro-forma
-3.0% appreciation · 2.32% rent growth · sell at horizon
- IRR
- -3.7%
- Equity multiple
- 0.86×
- Total profit
- $-7,388
- Equity at exit
- $28,926
- IRR
- 5.3%
- Equity multiple
- 1.38×
- Total profit
- $20,548
- Equity at exit
- $16,774
Cash invested: $54,320 (down + closing). Projections, not guarantees.
Landlord ↔ Tenant lean methodology
- Overall (STATE)
- 27 Tenant-Leaning
- State Maryland
- 27 Tenant-Leaning · D+14
- County
- — inherits STATE
- City
- — inherits STATE
ZIP-level market 21921
- Rents YoY
- 2.3%
- Active inventory
- 207
- Price-to-rent
- 7.7×
Monthly cashflow live
- Estimated rent
- $2,090 medium interval (Pro) →
- Mortgage (P&I)
- −$1,017
- Tax from tax record
- −$153 /mo · $1,832/yr
- Insurance
- −$81
- HOA
- −$0
- Vacancy / Maint / Mgmt
- −$439
- Net cashflow
- $400
Break-even live
Sensitivity live
| Price | -10% $510 | -5% $455 | +0% $400 | +5% $345 | +10% $290 |
|---|---|---|---|---|---|
| Rent | -10% $235 | -5% $318 | +0% $400 | +5% $483 | +10% $565 |
| Rate | -1.0pp $498 | -0.5pp $450 | base $400 | +0.5pp $350 | +1.0pp $299 |
UW: 25.0% down · 7.5% · 30yr · 1.5% tax · 5.0% vac · 8.0% maint · 8.0% mgmt
Financing live
Cash to close
- Down payment
- $48,500
- Closing costs
- $5,820
- Reserves months
- —
- Total cash needed
- —
Loan-product check · same deal, 3 products live
Conventional
25% down · 7.5% · 30yr
- Down + closing
- —
- Monthly P&I
- —
- Monthly cashflow
- —
- DSCR
- —
- Eligible?
- —
Personal DTI + credit; lowest rate.
DSCR
20% down · 8.5% · 30yr
- Down + closing
- —
- Monthly P&I
- —
- Monthly cashflow
- —
- DSCR
- —
- Eligible?
- —
No personal income docs; deal must DSCR.
Hard money
10% down · 12.0% · 12mo
- Down + closing
- —
- Monthly P&I
- —
- Monthly cashflow
- —
- DSCR
- —
- Eligible?
- —
Short-term bridge; refi at stabilization.
Rent comps 4 comps
| Address | Beds | Baths | Sqft | Rent | $/sqft | DOM | Units | Dist |
|---|---|---|---|---|---|---|---|---|
| 150 E Village Rd Elkton, MD | 3.0 | 1.5 | 1224 | $1,950 | $1.59 | 23d | 1 | 0.42mi |
| 124 E Village Rd Elkton, MD | 3.0 | 1.5 | 1152 | $1,850 | $1.61 | 44d | 1 | 0.44mi |
| 110 Michaels Way Elkton, MD | 3.0 | 2.5 | 1200 | $2,800 | $2.33 | 5d | 1 | 0.47mi |
| 1000 Spyglass Dr Elkton, MD | 1.0–3.0 | 1.0–2.0 | 1104 | $2,088 | $1.89 | 2d | 20 | 0.66mi |
Listing history 30 events
-
2026-06-21days on market $194,000 Active 61 DOM
-
2026-06-18days on market $194,000 Active 58 DOM
-
2026-06-17days on market $194,000 Active 57 DOM
-
2026-06-16days on market $194,000 Active 56 DOM
-
2026-06-15days on market $194,000 Active 55 DOM
-
2026-06-13days on market $194,000 Active 53 DOM
-
2026-06-09days on market $194,000 Active 49 DOM
-
2026-06-08days on market $194,000 Active 48 DOM
-
2026-06-07days on market $194,000 Active 47 DOM
-
2026-06-04days on market $194,000 Active 44 DOM
-
2026-06-03days on market $194,000 Active 43 DOM
-
2026-06-02pricedays on market $194,000 Active 42 DOM
-
2026-06-01days on market $200,000 Active 41 DOM
-
2026-05-31days on market $200,000 Active 40 DOM
-
2026-04-21$200,000 Active 287-char remark
Show marketing remark (287 chars)
Welcome home! Here is your chance to own and be less than renting. This home offers 2 bedrooms and one bathroom. Nice size backyard large living room and kitchen Newer roof and hvac system, perfect location minutes to Delaware and downtown Elkton. Professional pictures to come Tuesday!
-
2026-04-19historical $200,000 287-char remark
Show marketing remark (287 chars)
Welcome home! Here is your chance to own and be less than renting. This home offers 2 bedrooms and one bathroom. Nice size backyard large living room and kitchen Newer roof and hvac system, perfect location minutes to Delaware and downtown Elkton. Professional pictures to come Tuesday!
-
2004-10-01soldstatus $88,500
-
2004-09-25soldstatus $88,900 61-char remark
Show marketing remark (61 chars)
Great shape, 2 large bedrooms, tilt windows, Great investment
-
2004-08-28historical 61-char remark
Show marketing remark (61 chars)
Great shape, 2 large bedrooms, tilt windows, Great investment
-
2004-08-19$89,900 61-char remark
Show marketing remark (61 chars)
Great shape, 2 large bedrooms, tilt windows, Great investment
-
1999-01-28soldstatus $69,000
-
1999-01-27soldstatus $69,000
-
1999-01-27soldstatus $69,000
-
1998-12-21historical
-
1998-12-21historical
-
1998-11-24$69,900
-
1998-10-31$69,000
-
1998-10-31historical
-
1998-10-31$69,900
-
1992-10-30soldstatus $66,000
ⓘ Source: listings_history table (triggers on properties + properties_extension) + one-shot
backfill from property_details.listing_events for pre-trigger history.
Tax reassessment forecast MD · Partial reset (capped growth)
- Current annual tax
- $1,832 · $153/mo
- Projected year-2 tax
- $1,973 · $164/mo
- Expected delta
- +$141/yr (+$12/mo · 7.7%)
ⓘ Screening estimate from a state-policy table — verify with the county assessor before closing.
Climate risk First Street
- Flood 1/10 Low FEMA zone X (unshaded) · 0% chance over 30 yrs
- Wildfire 3/10 Moderate
- Heat 7/10 Severe 7 d/yr ≥105°F today · 15 d/yr by 30 yrs out
- Wind 6/10 Major 27% chance of damaging wind over 30 yrs
- Air quality 4/10 Moderate 3 unhealthy d/yr today · 5 by 30 yrs out
Nearby sold comps map
Loading sold comps map…
Walkable amenities ~0.75 mi
Loading nearby amenities…
Taxation est. · year 1
- Rental income
- $25,080
- − Mortgage interest
- −$10,867
- − Property taxes
- −$1,832
- − Insurance
- −$970
- − Repairs & maintenance
- −$2,006
- − Management
- −$2,006
- − Depreciation
- −$5,644
- Taxable income
- $1,755
- Est. tax owed @ 24.0%
- −$421
- After-tax cash flow
- $4,382/yr
For passive investors: Depreciation is non-cash, so a rental often shows a tax loss while cash-flowing — sheltering income. Rental losses are passive: they offset passive income freely, and up to $25,000/yr can offset ordinary (W-2) income if you actively participate and your MAGI is under $100k (phasing out to $0 by $150k); unused losses carry forward. On sale, claimed depreciation is recaptured at up to 25%, and gains may owe capital-gains tax (a 1031 exchange can defer both). Figures are a year-1 estimate at your 24.0% rate — not tax advice; consult a CPA.
Schools (NCES district)
- District
- Cecil County Public Schools
- NCES district ID
- 2400240
- Math proficiency
- 15% ▼ -21.00%
- Reading proficiency
- 30% ▼ -15.00%
- Median HH income
- $66,544
- Composite
- 21.51/100
- National rank
- #8322
- State rank
- #15 of 24 in MD
Livability — Elkton
- Score
- 65/100
- State rank
- #261
- US rank
- #13293
Category grades
Schools grade is shown separately in the Schools card above.
Census & demographics
- Census place
- Elkton, MD
- County
- Cecil County · 65,041 people
- City population
- 45,527
- Metro
- Philadelphia-Camden-Wilmington, PA-NJ-DE-MD
- Population (ZIP)
- 45,527
- Household income
- $85,775
- Rent vs Own
- Severe rent burden
- 1438.0
Population outlook (Cecil County) Hauer SSP2
- Today (2025)
- 105,877 people
- By 2030
- 106,905 · +1.0%
- By 2040
- 107,156 · +1.2%
- By 2050
- 104,170 · -1.6%
- By 2075
- 95,771 · -9.5%
- By 2100
- 82,381 · -22.2%
Race, ethnicity, and origin ACS 2023
- Neighborhood character
- Predominantly White (76%)
- Race & ethnicity
- White 76% Black 9% Two or more races 8% Hispanic / Latino 6% Asian 2%
- Hispanic origin (detail)
- Mexican 2% Puerto Rican 2%
- Common ancestry
- Romanian 6% Slovak 2% Italian 1%
- Foreign-born
- 5% · Canada
- Languages at home
- 92% English-only · Spanish 3% Other Indo-European 1% Other Asian/Pacific 1%
Political lean MEDSL · Cecil
- 2024 margin
- Solid R (+30.9) · D 33.5% · R 64.4% · Other 2.1%
- 2008→2024 swing
- -16.3pp toward R · 2008: -14.6pp · 2024: -30.9pp
- All cycles
- 2024: R+30.9 2020: R+26.6 2016: R+35.3 2012: R+20.4 2008: R+14.6
Not yet ingested
- Civics
- —
Market trends
- HPI YoY
- ▼ -192.67%
- Current HPI
- 253.7641
- Rent YoY
- ▲ 2.32%
- Metro
- Philadelphia-Camden-Wilmington, PA-NJ-DE-MD
- State GDP YoY
- ▲ 2.97%
- F500 in state
- 12
Industry mix (Fortune 500 HQ in MD)
| Industry | F500 HQs | Revenue |
|---|---|---|
| Aerospace / Defense | 1 | $71B |
|
||
| Utilities | 1 | $25B |
|
||
| Hotels | 1 | $24B |
|
||
| Consumer Goods | 1 | $7B |
|
||
| Real Estate | 1 | $6B |
|
||
| Chemicals | 1 | $2B |
|
||
Price history
+203.0% since first listed16 events — show timeline
- 2026-04-21 Listed $200,000 BRIGHT MLS
- 2026-04-19 Coming Soon $200,000 BRIGHT MLS
- 2004-10-01 Sold (Public Records) $88,500 Public Records
- 2004-09-25 Sold (MLS) $88,900 MRIS
- 2004-08-28 Delisted — MRIS
- 2004-08-19 Listed $89,900 MRIS
- 1999-01-28 Sold (Public Records) $69,000 Public Records
- 1999-01-27 Sold (MLS) $69,000 BRIGHT MLS
- 1999-01-27 Sold (MLS) $69,000 MRIS
- 1998-12-21 Listing Removed — BRIGHT MLS
- 1998-12-21 Delisted — MRIS
- 1998-11-24 Listed $69,900 MRIS
- 1998-10-31 Listed $69,900 BRIGHT MLS
- 1998-10-31 Listing Removed — BRIGHT MLS
- 1998-10-31 Listed $69,000 BRIGHT MLS
- 1992-10-30 Sold (Public Records) $66,000 Public Records
Property tax history
+1.5%/yrLatest (2025): $1,832 · +13.4% YoY. Source: county tax records.
Cash-flow waterfall
monthlySold comps — $/sqft
last 12 mo · ≤1 miLoading sold comps…