315 Circle Dr · Maynardville, TN
Flood risk 1/10 · Minimal
- FEMA flood zone
- X (unshaded)
- Chance of flooding over 30 yrs
- 0.0%
- Est. flood insurance / yr
- $473 – $860
Fire risk 6/10 · Moderate
- Est. fire insurance / yr
- $949 – $1,763
Heat risk 5/10 · Moderate
- Hot days now (above 102°F)
- 7 days/yr
- Hot days in 30 yrs
- 20 days/yr
Wind risk 2/10 · Minimal
- Chance of severe wind over 30 yrs
- 2.0%
Air-quality risk 3/10 · Minor
- Unhealthy air days now
- 3 days/yr
- Unhealthy air days in 30 yrs
- 4 days/yr
Risk factors via First Street. Map © Google.
Why this score? — see what drove the C grade
The composite is a weighted blend of 9 inputs, each scored 0–100. Each bar is that input's sub-score; the figure is the points it added to the 100-point composite (weight × sub-score).
- Cash flow +23.5/30.0
- DSCR +7.6/10.0
- ARV discount +7.5/15.0
- 1% rule +6.1/10.0
- Appreciation +4.0/10.0
- Livability +2.9/5.0
- Rent growth +2.5/5.0
- Condition / age +2.5/5.0
- Schools +1.4/10.0
$229,599
🖨 Deal sheet 📄 Offer letter ✓ Due diligence
Listing remarks
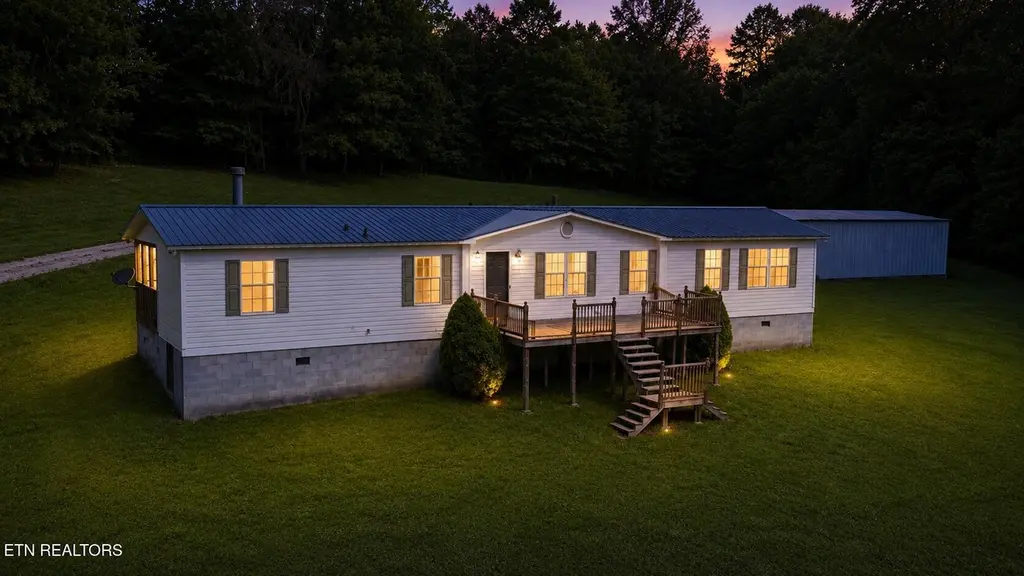
Tucked away on approximately 0.9 acres, this private 3BR/2BA doublewide offers over 2,100 sq ft of space--giving you the room and setting to truly spread out and enjoy country living. Imagine quiet mornings with coffee overlooking your own peaceful surroundings and evenings spent working on projects in the detached garage/workshop. If you've been looking for privacy, space, and a place you can make your own, this property delivers. With a little vision, it has strong potential for the right buyer. Premanent right of way, to home. Property is being sold as-is and priced accordingly. Front deck will require full replacement
Key facts
- 0.9 acre lot
- 2 garage spots
- Built 2000
Property features AI
Finance
- HOA & community: Homeowners association present
Exterior
- Parking: Detached 2-car garage; Shared gravel driveway
- Utilities: Septic tank
- Home design: Detached property; 1-story (single level) implied by entry information
- Construction: Vinyl siding; Frame construction; Crawl space foundation
- Exterior features: Vinyl windows; Workshop on property; Rolling slope lot; Country and wooded views
Interior
- Kitchen: Dishwasher; Refrigerator; Self-cleaning oven
- Flooring: Laminate flooring; Carpeted areas
- Bathrooms: 2 full bathrooms
- Heating & cooling: Central heating; Electric heating; Other heating; Central cooling
- Interior features: Walk-in closet(s); Drapes; 9 total rooms
Neighborhood map
What this means for you Summary
Snapshot
- This is a 3-bed/2.0-bath other listed at $230k.
Deal economics
- At list price, monthly cash flow is $428 ($5k/yr) — positive.
- The deal already cash-flows at list — no discount required.
- Meets the 1% rule at list price ($3k rent vs $230k).
- Recommended offer: $223k (3.0% below list) — sets the bar for market timing.
- Cap rate 8.5% vs local median 1.7% in Maynardville — top-decile yield for the area; either an underpriced asset or a hidden risk that comps aren't pricing in. Stress-test before assuming the spread holds.
Location & tenants
- Location reads 57/100 on livability (#331 in TN) — a working-class tenant base; expect higher turnover. Strengths: cost of living A+, housing A+, crime B; Watch: amenities F, commute F, employment F.
- Union County (rural): math 14% / reading 19% proficiency, ranked #127 of 139 in TN (top 91%) — low school quality limits family demand, transient renter base, plan for 1-2y turnover.
- Zoned schools: Maynardville Elementary (math 12% / reading 17%, grade F, #753 of 952 statewide, top 81%, 363 students, 0% FRL); H Maynard Middle School (math 14% / reading 18%, grade F, #223 of 333 statewide, top 68%, 656 students, 0% FRL); Union County High School (math 12% / reading 27%, grade F, #197 of 332 statewide, top 60%, 819 students, 0% FRL) — zoned schools average 0% FRL vs 54% district-wide (54 pts lower); this property's tenant base skews higher-income than the district average.
- Market conditions: 80 active listings in the ZIP; 1 comparable units currently listed for rent nearby; 134 units permitted in Union County in 2024 (0 in 5+ unit buildings).
Forward outlook
- Local home prices are declining (-2.0%/yr); year-one equity from $2k of loan paydown is wiped out by about $5k of value loss. Plan a longer hold.
- Union County population projected at -12% by 2050 — secular population decline; favor cash flow + early exit over multi-decade hold.
Negotiation context
- It's been on market 40 days — a 3% lower offer ($223k) is reasonable based on typical stale-listing flexibility.
Risks & watch-outs
- Climate carrying-cost: major wildfire risk; extreme-heat days projected 7→20/yr by 2055 (HVAC capex compounding) — expect insurance premiums to compound above CPI over the hold.
Questions for the listing agent
- It's been on market 40 days. Have you received any prior offers? Is the seller open to a 3% concession, seller financing, or rate buy-down credit?
- Is there a deadline driving the sale (1031 exchange, divorce, estate, relocation)? That informs how much negotiation room exists.
- Schools are F-rated, which usually means shorter tenancies and higher turnover. Who's the typical renter profile here, and what's been the actual vacancy rate?
- What's the average days-on-market for RENTAL listings here right now (not sales)? A rising rental-DOM trend means longer vacancies and softer asking-rent achievability than the comps imply.
- What's the recent tenant-quality profile in this submarket — average credit score on applications, eviction rate, late-payment / NSF rate, and stable-employment percentage? A property-management company in the area should have these aggregated.
- How much new for-sale + rental construction is in the pipeline within 1–3 miles? Heavy new supply typically softens prices + rents 12–24 months out; constrained supply supports both.
Investment metrics
- 1% rule
- 1.11% ✓
- Cap rate
- 8.53%
- Cash-on-cash
- 7.99%
- DSCR
- 1.36
- GRM
- 7.5
CMA / ARV
No comps found within radius.
Projected returns pro-forma
-2.04% appreciation · 3.0% rent growth · sell at horizon
- IRR
- -0.2%
- Equity multiple
- 0.99×
- Total profit
- $-525
- Equity at exit
- $44,229
- IRR
- 7.9%
- Equity multiple
- 1.67×
- Total profit
- $43,147
- Equity at exit
- $37,453
Cash invested: $64,288 (down + closing). Projections, not guarantees.
Landlord ↔ Tenant lean methodology
- Overall (STATE)
- 87 Strongly Landlord-Friendly
- State Tennessee
- 87 Strongly Landlord-Friendly · R+13
- County
- — inherits STATE
- City
- — inherits STATE
ZIP-level market 37807
- Home prices YoY
- -0.6%
- Active inventory
- 80
- Price-to-rent
- 7.5×
Monthly cashflow live
- Estimated rent
- $2,550 medium interval (Pro) →
- Mortgage (P&I)
- −$1,204
- Tax est. 1.5%
- −$287 /mo · $3,444/yr
- Insurance
- −$96
- HOA
- −$0
- Vacancy / Maint / Mgmt
- −$536
- Net cashflow
- $428
Break-even live
UW: 25.0% down · 7.5% · 30yr · 1.5% tax · 5.0% vac · 8.0% maint · 8.0% mgmt
Financing live
Cash to close
- Down payment
- $57,400
- Closing costs
- $6,888
- Reserves months
- —
- Total cash needed
- —
Loan-product check · same deal, 3 products live
Conventional
25% down · 7.5% · 30yr
- Down + closing
- —
- Monthly P&I
- —
- Monthly cashflow
- —
- DSCR
- —
- Eligible?
- —
Personal DTI + credit; lowest rate.
DSCR
20% down · 8.5% · 30yr
- Down + closing
- —
- Monthly P&I
- —
- Monthly cashflow
- —
- DSCR
- —
- Eligible?
- —
No personal income docs; deal must DSCR.
Hard money
10% down · 12.0% · 12mo
- Down + closing
- —
- Monthly P&I
- —
- Monthly cashflow
- —
- DSCR
- —
- Eligible?
- —
Short-term bridge; refi at stabilization.
Rent comps 1 comps
| Address | Beds | Baths | Sqft | Rent | $/sqft | DOM | Units | Dist |
|---|---|---|---|---|---|---|---|---|
| 210 A J Ln Maynardville, TN | 3.0 | 2.0 | 1944 | $2,550 | $1.31 | 2d | 1 | 0.54mi |
Listing history 20 events
-
2026-06-18days on market $229,599 Active 40 DOM
-
2026-06-17days on market $229,599 Active 39 DOM
-
2026-06-16days on market $229,599 Active 38 DOM
-
2026-06-15days on market $229,599 Active 37 DOM
-
2026-06-14remarks 629-char remark
-
2026-06-14days on market $229,599 Active 35 DOM
-
2026-06-10days on market $229,599 Active 32 DOM
-
2026-06-09days on market $229,599 Active 31 DOM
-
2026-06-08days on market $229,599 Active 30 DOM
-
2026-06-07days on market $229,599 Active 29 DOM
-
2026-06-05days on market $229,599 Active 26 DOM
-
2026-06-03days on market $229,599 Active 25 DOM
-
2026-06-02days on market $229,599 Active 24 DOM
-
2026-06-01days on market $229,599 Active 23 DOM
-
2026-05-31price $229,599 Active 22 DOM
-
2026-05-31days on market $239,998 Active 22 DOM
-
2026-05-31days on market $239,998 Active 21 DOM
-
2026-05-21price $239,998
-
2026-05-09$250,000 Active
-
2026-05-08historical $250,000
ⓘ Source: listings_history table (triggers on properties + properties_extension) + one-shot
backfill from property_details.listing_events for pre-trigger history.
Climate risk First Street
- Flood 1/10 Low FEMA zone X (unshaded) · 0% chance over 30 yrs
- Wildfire 6/10 Major
- Heat 5/10 Major 7 d/yr ≥102°F today · 20 d/yr by 30 yrs out
- Wind 2/10 Low 2% chance of damaging wind over 30 yrs
- Air quality 3/10 Moderate 3 unhealthy d/yr today · 4 by 30 yrs out
Nearby sold comps map
Loading sold comps map…
Walkable amenities ~0.75 mi
Loading nearby amenities…
Taxation est. · year 1
- Rental income
- $30,600
- − Mortgage interest
- −$12,861
- − Property taxes
- −$3,444
- − Insurance
- −$1,148
- − Repairs & maintenance
- −$2,448
- − Management
- −$2,448
- − Depreciation
- −$6,679
- Taxable income
- $1,572
- Est. tax owed @ 24.0%
- −$377
- After-tax cash flow
- $4,756/yr
For passive investors: Depreciation is non-cash, so a rental often shows a tax loss while cash-flowing — sheltering income. Rental losses are passive: they offset passive income freely, and up to $25,000/yr can offset ordinary (W-2) income if you actively participate and your MAGI is under $100k (phasing out to $0 by $150k); unused losses carry forward. On sale, claimed depreciation is recaptured at up to 25%, and gains may owe capital-gains tax (a 1031 exchange can defer both). Figures are a year-1 estimate at your 24.0% rate — not tax advice; consult a CPA.
Schools (NCES district)
- District
- Union County
- NCES district ID
- 4704290
- Math proficiency
- 14% ▼ -7.00%
- Reading proficiency
- 19% ▼ -5.00%
- Median HH income
- $35,598
- Composite
- 13.62/100
- National rank
- #9507
- State rank
- #127 of 139 in TN
Livability — Maynardville
- Score
- 57/100
- State rank
- #331
- US rank
- #22002
Category grades
Schools grade is shown separately in the Schools card above.
Census & demographics
- Population (ZIP)
- 11,476
Population outlook (Union County) Hauer SSP2
- Today (2025)
- 19,073 people
- By 2030
- 18,888 · -1.0%
- By 2040
- 18,090 · -5.2%
- By 2050
- 16,693 · -12.5%
- By 2075
- 12,894 · -32.4%
- By 2100
- 8,564 · -55.1%
Race, ethnicity, and origin ACS 2023
- Neighborhood character
- Predominantly White (96%)
- Race & ethnicity
- White 96% Two or more races 3%
- Common ancestry
- Slovak 4% Serbian 3% Iranian 1%
- Foreign-born
- 1% · Canada
Political lean MEDSL · Union
- 2024 margin
- Solid R (+71.2) · D 14.0% · R 85.2%
- 2008→2024 swing
- -29.9pp toward R · 2008: -41.2pp · 2024: -71.2pp
- All cycles
- 2024: R+71.2 2020: R+68.4 2016: R+64.7 2012: R+48.2 2008: R+41.2
Not yet ingested
- Civics
- —
Market trends
- HPI YoY
- ▼ -2.04%
- Current HPI
- 368.7218
- Rent YoY
- —
- Metro
- —
- State GDP YoY
- ▲ 2.78%
- F500 in state
- 22
Industry mix (Fortune 500 HQ in TN)
| Industry | F500 HQs | Revenue |
|---|---|---|
| Healthcare | 3 | $91B |
|
||
| Retail | 3 | $72B |
|
||
| Transportation / Logistics | 1 | $88B |
|
||
| Paper / Packaging | 1 | $19B |
|
||
| Insurance | 1 | $13B |
|
||
| Energy | 1 | $12B |
|
||
Price history
-4.0% since first listed3 events — show timeline
- 2026-05-21 Price Changed $239,998 Knoxville MLS
- 2026-05-09 Listed $250,000 Knoxville MLS
- 2026-05-08 Coming Soon $250,000 Knoxville MLS
Property tax history
+3.8%/yrLatest (2025): $396 · +0.0% YoY. Source: county tax records.
Cash-flow waterfall
monthlySold comps — $/sqft
last 12 mo · ≤1 miLoading sold comps…