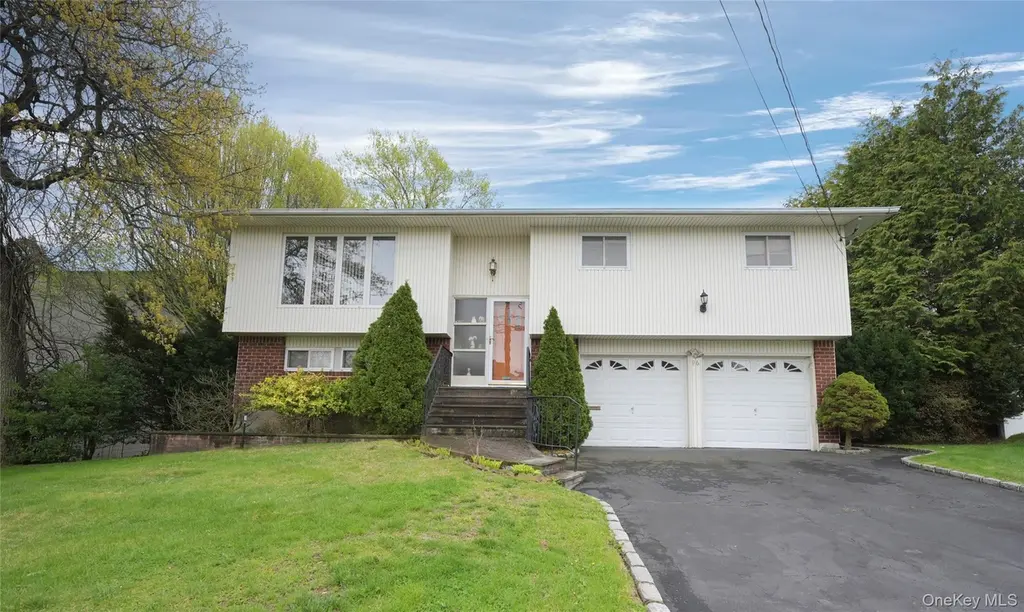
96 Cedar Dr W · Plainview, NY
Flood risk 1/10 · Minimal
- FEMA flood zone
- X (unshaded)
- Chance of flooding over 30 yrs
- 0.0%
- Est. flood insurance / yr
- $473 – $860
Fire risk 1/10 · Minimal
- Est. fire insurance / yr
- $691 – $1,283
Heat risk 5/10 · Moderate
- Hot days now (above 98°F)
- 7 days/yr
- Hot days in 30 yrs
- 16 days/yr
Wind risk 6/10 · Moderate
- Chance of severe wind over 30 yrs
- 69.0%
Air-quality risk 4/10 · Minor
- Unhealthy air days now
- 5 days/yr
- Unhealthy air days in 30 yrs
- 7 days/yr
Risk factors via First Street. Map © Google.
Why this score? — see what drove the D grade
The composite is a weighted blend of 9 inputs, each scored 0–100. Each bar is that input's sub-score; the figure is the points it added to the 100-point composite (weight × sub-score).
- ARV discount +15.0/15.0
- Schools +8.0/10.0
- Cash flow +6.1/30.0
- Livability +4.2/5.0
- Rent growth +2.5/5.0
- Condition / age +2.5/5.0
- 1% rule +1.9/10.0
- DSCR +0.4/10.0
- Appreciation +0.0/10.0
$809,000
🖨 Deal sheet 📄 Offer letter ✓ Due diligence
Listing remarks MLS
Bright and spacious 4 bedroom 2 bath hi-ranch in the heart of Plainview. Large rooms with hardwood floors under carpet, eat in kitchen and a 2 car garage set on an oversized 70x140 lot. Ready for new owners to make this their home! House is being sold As-Is.
Key facts
- 9,800 sq ft lot
- 2 garage spots
- Built 1964
Neighborhood map
What this means for you Summary
Snapshot
- This is a 4-bed/2.0-bath single-family listed at $809k.
Deal economics
- At list price, monthly cash flow is $-2k ($-18k/yr) — negative.
- To cash-flow at today's rent, offer at most $542k (33.0% below list).
- To meet the 1% rule (rent ≥ 1% of price), the offer needs to be $556k (31.2% below list).
- Recommended offer: $542k (33.0% below list) — sets the bar for cash-flow.
- Cap rate 4.0% vs local median 2.7% in Plainview — top-decile yield for the area; either an underpriced asset or a hidden risk that comps aren't pricing in. Stress-test before assuming the spread holds.
Location & tenants
- Location reads 85/100 on livability (#36 in NY, #554 nationally) — a professional / high-income tenant draw. Strengths: schools A+, commute A+, employment A+; Watch: cost of living F.
- Plainview-Old Bethpage Central School District (suburban): math 88% / reading 86% proficiency, ranked #20 of 590 in NY (top 3%) — strong family-tenant draw, lease renewals of 3-5y typical; only 4% free/reduced lunch — higher-income household profile.
- Market conditions: 158 active listings in the ZIP; 17 comparable units currently listed for rent nearby; rentals leasing fast (median 11d on market — plan ~1-2 weeks tenant-placement turnaround); high-income renter base; 824 units permitted in Nassau County in 2024 (153 in 5+ unit buildings).
- This rent runs 36% of the median local income ($188k/yr) — at the standard rent-burdened threshold; future hikes will face affordability resistance.
Forward outlook
- Local home prices are declining (-3.0%/yr); year-one equity from $6k of loan paydown is wiped out by about $24k of value loss. Plan a longer hold.
- Nassau County population projected at +7% by 2050 — modest demand growth; plan on rents tracking national, not racing it.
Negotiation context
- It's been on market 15 days — a 2% lower offer ($797k) is reasonable based on typical stale-listing flexibility.
- Current owner paid $55k; list at $809k implies a 1371% gain — meaningful room to come down on a strong offer.
Risks & watch-outs
- Climate carrying-cost: major wind risk, 69% chance of damaging wind over 30y; extreme-heat days projected 7→16/yr by 2055 (HVAC capex compounding) — expect insurance premiums to compound above CPI over the hold.
Questions for the listing agent
- What do current leases actually rent for vs. the listed asking? Can we see a recent rent roll and the last 12 months of T-12 income?
- Built in 1964 — when were the roof, HVAC, electrical panel, plumbing, and water heater last replaced?
- Is there a deadline driving the sale (1031 exchange, divorce, estate, relocation)? That informs how much negotiation room exists.
- Schools are A-rated — typically a magnet for longer-tenancy family renters. What's the average tenant stay here, and is there a school-zone premium baked into asking?
- The area grade is low — what's the realistic commute time and amenity access for the typical tenant pool here? Any planned neighborhood developments (good or bad) we should know about?
- What's the average days-on-market for RENTAL listings here right now (not sales)? A rising rental-DOM trend means longer vacancies and softer asking-rent achievability than the comps imply.
- What's the recent tenant-quality profile in this submarket — average credit score on applications, eviction rate, late-payment / NSF rate, and stable-employment percentage? A property-management company in the area should have these aggregated.
- How much new for-sale + rental construction is in the pipeline within 1–3 miles? Heavy new supply typically softens prices + rents 12–24 months out; constrained supply supports both.
Investment metrics
- 1% rule
- 0.69% ✗
- Cap rate
- 4.05%
- Cash-on-cash
- -8.02%
- DSCR
- 0.64
- GRM
- 12.1
CMA / ARV
- ARV (median comp)
- $1,058,861
- List price
- $809,000
- Delta
- -23.60%
- Verdict
- UNDERPRICED
- Comps
- 20 within 1.0 mi
Show comp detail 12 sales within ~0.75 mi
| Address | Dist | Beds/Ba | Sqft | Sold | Price | $/sf | Match |
|---|---|---|---|---|---|---|---|
| 6 Cedar Dr E | 0.51mi | 4/1.5 | 1,805 (-0%) | 1mo | $990,000 | $548 | 73 |
| 15 Vista Rd | 0.40mi | 3/2.5 (-1) | 1,800 (-1%) | 3mo | $1,150,000 | $639 | 71 |
| 44 Wallace Dr | 0.27mi | 4/2.5 | 2,000 (+10%) | 2mo | $999,000 | $500 | 66 |
| 20 Vista Rd | 0.40mi | 3/2.0 (-1) | 1,910 (+6%) | 1mo | $1,355,000 | $709 | 66 |
| 43 Maplewood Dr | 0.34mi | 3/2.5 (-1) | 1,689 (-7%) | 1mo | $1,025,000 | $607 | 65 |
| 7 Judith St | 0.32mi | 4/2.5 | 2,029 (+12%) | 2mo | $1,163,000 | $573 | 62 |
| 25 Westbury Ave | 0.65mi | 4/2.0 | 1,890 (+4%) | 2mo | $920,000 | $487 | 60 |
| 26 Glenwood Rd | 0.66mi | 3/2.5 (-1) | 1,827 (+1%) | 3mo | $1,225,000 | $670 | 59 |
| 11 Fordham Dr | 0.74mi | 3/2.0 (-1) | 1,800 (-1%) | 2mo | $888,000 | $493 | 58 |
| 5 Hillvale Rd | 0.75mi | 3/2.5 (-1) | 1,796 (-1%) | 1mo | $1,340,000 | $746 | 56 |
| 24 Glenwood Rd | 0.67mi | 3/2.5 (-1) | 1,888 (+4%) | 3mo | $1,200,000 | $636 | 52 |
| 39 Garnet Ln | 0.56mi | 4/2.0 | 1,554 (-14%) | 2mo | $999,000 | $643 | 49 |
Match score weights: distance 35% · size 25% · config 20% · recency 20%. Top-matched comps best support the ARV.
Projected returns pro-forma
-3.0% appreciation · 3.0% rent growth · sell at horizon
- IRR
- -30.3%
- Equity multiple
- -0.00×
- Total profit
- $-227,198
- Equity at exit
- $120,625
- IRR
- -32.0%
- Equity multiple
- -0.42×
- Total profit
- $-320,817
- Equity at exit
- $69,948
Cash invested: $226,520 (down + closing). Projections, not guarantees.
Landlord ↔ Tenant lean methodology
- Overall (STATE)
- 15 Strongly Tenant-Friendly
- State New York
- 15 Strongly Tenant-Friendly · D+10
- County
- — inherits STATE
- City
- — inherits STATE
ZIP-level market 11803
- Active inventory
- 158
- Price-to-rent
- 12.1×
Monthly cashflow live
- Estimated rent
- $5,564 high interval (Pro) →
- Mortgage (P&I)
- −$4,242
- Tax from tax record
- −$1,329 /mo · $15,950/yr
- Insurance
- −$337
- HOA
- −$0
- Vacancy / Maint / Mgmt
- −$1,168
- Net cashflow
- $-1,513
Break-even live
UW: 25.0% down · 7.5% · 30yr · 1.5% tax · 5.0% vac · 8.0% maint · 8.0% mgmt
Financing live
Cash to close
- Down payment
- $202,250
- Closing costs
- $24,270
- Reserves months
- —
- Total cash needed
- —
Loan-product check · same deal, 3 products live
Conventional
25% down · 7.5% · 30yr
- Down + closing
- —
- Monthly P&I
- —
- Monthly cashflow
- —
- DSCR
- —
- Eligible?
- —
Personal DTI + credit; lowest rate.
DSCR
20% down · 8.5% · 30yr
- Down + closing
- —
- Monthly P&I
- —
- Monthly cashflow
- —
- DSCR
- —
- Eligible?
- —
No personal income docs; deal must DSCR.
Hard money
10% down · 12.0% · 12mo
- Down + closing
- —
- Monthly P&I
- —
- Monthly cashflow
- —
- DSCR
- —
- Eligible?
- —
Short-term bridge; refi at stabilization.
Rent comps 17 comps
| Address | Beds | Baths | Sqft | Rent | $/sqft | DOM | Units | Dist |
|---|---|---|---|---|---|---|---|---|
| 72 Winthrop Rd Plainview, NY | 3.0 | 2.5 | 1827 | $6,000 | $3.28 | 44d | 1 | 0.47mi |
| 8 Spector Ln Plainview, NY | 3.0 | 3.0 | 1439 | $5,600 | $3.89 | 1d | 1 | 0.54mi |
| 6 Patricia St Plainview, NY | 5.0 | 3.0 | 2500 | $5,900 | $2.36 | 44d | 1 | 0.56mi |
| 36 Forest Dr Plainview, NY | 4.0 | 3.5 | 2034 | $4,900 | $2.41 | 1d | 1 | 0.64mi |
| 36 Forest Dr Plainview, NY | 4.0 | 3.5 | 2034 | $4,900 | $2.41 | 13d | 1 | 0.64mi |
| 40 Relda St Plainview, NY | 4.0 | 2.0 | 1810 | $5,200 | $2.87 | 1d | 1 | 0.74mi |
| 41 Eaton Rd Syosset, NY | 3.0 | 2.5 | 1701 | $6,300 | $3.70 | 1d | 1 | 0.87mi |
| 59 Andover Ln Hicksville, NY | 4.0 | 3.0 | 2156 | $5,500 | $2.55 | 1d | 1 | 0.89mi |
| 12 Vernon St Plainview, NY | 5.0 | 2.0 | 2614 | $5,800 | $2.22 | 1d | 1 | 0.92mi |
| 21 Gary Rd Syosset, NY | 3.0 | 2.5 | 1500 | $5,300 | $3.53 | 19d | 1 | 1.03mi |
| 102 Birchwood Park Dr Syosset, NY | 4.0 | 2.0 | 1565 | $5,000 | $3.19 | 10d | 1 | 1.09mi |
| 4 Hope Dr Plainview, NY | 3.0 | 2.0 | 1690 | $4,800 | $2.84 | 44d | 1 | 1.14mi |
| 62 Summit St Hicksville, NY | 4.0 | 2.0 | 1973 | $5,500 | $2.79 | 24d | 1 | 1.16mi |
| 24 Elderberry Rd Syosset, NY | 4.0 | 2.0 | 1302 | $5,200 | $3.99 | 1d | 1 | 1.19mi |
| 11 Halcourt Dr Plainview, NY | 3.0 | 2.0 | 1608 | $1,550 | $0.96 | 13d | 1 | 1.24mi |
| 14 Glenn Dr Woodbury, NY | 4.0 | 3.0 | 1568 | $6,200 | $3.95 | 1d | 1 | 1.31mi |
| 52 Miller Pl Syosset, NY | 4.0 | 3.0 | 1561 | $5,950 | $3.81 | 13d | 1 | 1.37mi |
Listing history 4 events
-
2026-05-08status Pending 258-char remark
Show marketing remark (258 chars)
Bright and spacious 4 bedroom 2 bath hi-ranch in the heart of Plainview. Large rooms with hardwood floors under carpet, eat in kitchen and a 2 car garage set on an oversized 70x140 lot. Ready for new owners to make this their home! House is being sold As-Is.
-
2026-04-23$809,000 Active 258-char remark
Show marketing remark (258 chars)
Bright and spacious 4 bedroom 2 bath hi-ranch in the heart of Plainview. Large rooms with hardwood floors under carpet, eat in kitchen and a 2 car garage set on an oversized 70x140 lot. Ready for new owners to make this their home! House is being sold As-Is.
-
2026-04-23historical $809,000 258-char remark
Show marketing remark (258 chars)
Bright and spacious 4 bedroom 2 bath hi-ranch in the heart of Plainview. Large rooms with hardwood floors under carpet, eat in kitchen and a 2 car garage set on an oversized 70x140 lot. Ready for new owners to make this their home! House is being sold As-Is.
-
1977-10-01soldstatus $55,000
ⓘ Source: listings_history table (triggers on properties + properties_extension) + one-shot
backfill from property_details.listing_events for pre-trigger history.
Tax reassessment forecast NY · Partial reset (capped growth)
- Current annual tax
- $15,950 · $1,329/mo
- Projected year-2 tax
- $15,950 · $1,329/mo
- Expected delta
- $0/yr ($0/mo · 0.0%)
ⓘ Screening estimate from a state-policy table — verify with the county assessor before closing.
Climate risk First Street
- Flood 1/10 Low FEMA zone X (unshaded) · 0% chance over 30 yrs
- Wildfire 1/10 Low
- Heat 5/10 Major 7 d/yr ≥98°F today · 16 d/yr by 30 yrs out
- Wind 6/10 Major 69% chance of damaging wind over 30 yrs
- Air quality 4/10 Moderate 5 unhealthy d/yr today · 7 by 30 yrs out
Nearby sold comps map
Loading sold comps map…
Walkable amenities ~0.75 mi
Loading nearby amenities…
Taxation est. · year 1
- Rental income
- $66,766
- − Mortgage interest
- −$45,317
- − Property taxes
- −$15,950
- − Insurance
- −$4,045
- − Repairs & maintenance
- −$5,341
- − Management
- −$5,341
- − Depreciation
- −$23,535
- Taxable loss
- −$32,763
- Est. tax savings @ 24.0%
- +$7,863
- After-tax cash flow
- $-10,297/yr
For passive investors: Depreciation is non-cash, so a rental often shows a tax loss while cash-flowing — sheltering income. Rental losses are passive: they offset passive income freely, and up to $25,000/yr can offset ordinary (W-2) income if you actively participate and your MAGI is under $100k (phasing out to $0 by $150k); unused losses carry forward. On sale, claimed depreciation is recaptured at up to 25%, and gains may owe capital-gains tax (a 1031 exchange can defer both). Figures are a year-1 estimate at your 24.0% rate — not tax advice; consult a CPA.
Schools (NCES district)
- District
- Plainview-Old Bethpage Central School District
- NCES district ID
- 3623220
- Math proficiency
- 88% ▲ 1.00%
- Reading proficiency
- 86% ▲ 7.00%
- Median HH income
- $122,932
- Composite
- 80.45/100
- National rank
- #47
- State rank
- #20 of 590 in NY
Livability — Plainview
- Score
- 85/100
- State rank
- #36
- US rank
- #554
Category grades
Schools grade is shown separately in the Schools card above.
Census & demographics
- Census place
- Plainview, NY
- County
- Nassau County · 653,051 people
- City population
- 29,713
- Metro
- New York-Newark-Jersey City, NY-NJ-PA
- Population (ZIP)
- 29,713
- Household income
- $187,514
- Rent vs Own
- Severe rent burden
- 169.0
Population outlook (Nassau County) Hauer SSP2
- Today (2025)
- 1,409,302 people
- By 2030
- 1,431,482 · +1.6%
- By 2040
- 1,471,607 · +4.4%
- By 2050
- 1,502,845 · +6.6%
- By 2075
- 1,575,403 · +11.8%
- By 2100
- 1,554,356 · +10.3%
Race, ethnicity, and origin ACS 2023
- Neighborhood character
- Predominantly White (74%)
- Race & ethnicity
- White 74% Asian 19% Hispanic / Latino 4% Two or more races 3%
- Common ancestry
- Romanian 10% Scotch-Irish 6% Italian 2%
- Foreign-born
- 16% · China, South Korea, Canada
- Languages at home
- 81% English-only · Other Indo-European 7% Chinese 4% Korean 2%
Political lean MEDSL · Nassau
- 2024 margin
- Toss-up / Even · D 47.9% · R 52.1%
- 2008→2024 swing
- -12.6pp toward R · 2008: 8.4pp · 2024: -4.2pp
- All cycles
- 2024: R+4.2 2020: D+9.5 2016: D+5.3 2012: D+6.7 2008: D+8.4
Not yet ingested
- Civics
- —
Market trends
- HPI YoY
- ▼ -825.62%
- Current HPI
- 298.0511
- Rent YoY
- —
- Metro
- New York-Newark-Jersey City, NY-NJ-PA
- State GDP YoY
- ▲ 2.60%
- F500 in state
- 92
Industry mix (Fortune 500 HQ in NY)
| Industry | F500 HQs | Revenue |
|---|---|---|
| Financial Services | 10 | $950B |
|
||
| Consumer Goods | 9 | $162B |
|
||
| Insurance | 4 | $225B |
|
||
| Telecommunications | 2 | $144B |
|
||
| Pharmaceuticals | 2 | $112B |
|
||
| Media / Entertainment | 2 | $69B |
|
||
Price history
+1370.9% since first listed4 events — show timeline
- 2026-05-08 Pending — OneKey® MLS as Distributed by MLS Grid
- 2026-04-23 Listed $809,000 OneKey® MLS as Distributed by MLS Grid
- 2026-04-23 Coming Soon $809,000 OneKey® MLS as Distributed by MLS Grid
- 1977-10-01 Sold (Public Records) $55,000 Public Records
Property tax history
+2.4%/yrLatest (2024): $15,950 · +3.0% YoY. Source: county tax records.
Cash-flow waterfall
monthlySold comps — $/sqft
last 12 mo · ≤1 miLoading sold comps…