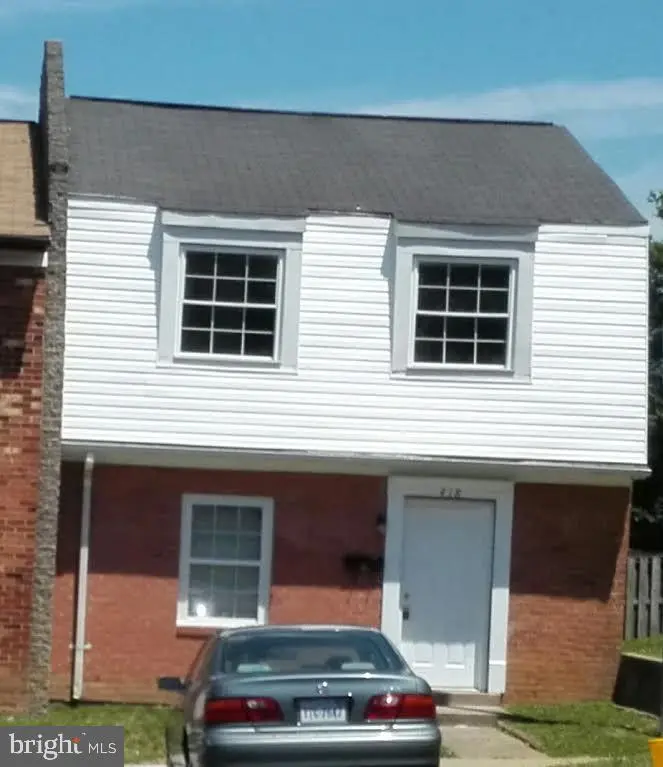
418 Rann Ct · Fredericksburg, VA
Flood risk 1/10 · Minimal
- FEMA flood zone
- X (unshaded)
- Chance of flooding over 30 yrs
- 0.0%
- Est. flood insurance / yr
- $507 – $1,088
Fire risk 4/10 · Minor
- Est. fire insurance / yr
- $666 – $1,236
Heat risk 8/10 · Major
- Hot days now (above 107°F)
- 7 days/yr
- Hot days in 30 yrs
- 17 days/yr
Wind risk 5/10 · Moderate
- Chance of severe wind over 30 yrs
- 21.0%
Air-quality risk 2/10 · Minimal
- Unhealthy air days now
- 0 days/yr
- Unhealthy air days in 30 yrs
- 1 days/yr
Risk factors via First Street. Map © Google.
Why this score? — see what drove the D grade
The composite is a weighted blend of 9 inputs, each scored 0–100. Each bar is that input's sub-score; the figure is the points it added to the 100-point composite (weight × sub-score).
- Cash flow +13.9/30.0
- ARV discount +7.5/15.0
- DSCR +4.2/10.0
- Schools +3.5/10.0
- 1% rule +3.4/10.0
- Livability +3.4/5.0
- Rent growth +2.6/5.0
- Condition / age +2.5/5.0
- Appreciation +0.0/10.0
$248,888
🖨 Deal sheet (PDF) 📄 Offer letter ✓ Due diligence
Listing remarks MLS
About this home: Handyman and investor special! Rarely available 3-bedroom townhome at this price these days. Needs substantial renovation, but it provides great potential to build your equity value. Don't miss the opportunity to grab it quickly, as the owner is likely to change mind and renovate it by himself and then sell for a regular price. Please contact owner directly for showing and offering.
Key facts
- $84 HOA
- 2 parking spots
- Built 1977
Neighborhood map
What this means for you Summary
Snapshot
- This is a 3-bed/1.5-bath condo listed at $249k.
Deal economics
- At list price, monthly cash flow is $30 ($354/yr) — positive.
- The deal already cash-flows at list — no discount required.
- To meet the 1% rule (rent ≥ 1% of price), the offer needs to be $210k (15.8% below list).
- Recommended offer: $210k (15.8% below list) — sets the bar for 1% rule.
- Cap rate 6.4% vs local median 3.7% in Fredericksburg — top-decile yield for the area; either an underpriced asset or a hidden risk that comps aren't pricing in. Stress-test before assuming the spread holds.
Location & tenants
- Location reads 67/100 on livability (#299 in VA) — a middle-class / working-renter tenant base. Strengths: health & safety A+, employment A-, housing B+; Watch: crime F, commute F, cost of living F.
- Fredericksburg City Public School District (suburban): math 27% / reading 54% proficiency, ranked #119 of 131 in VA (top 91%) — families likely to look elsewhere, expect single-tenant / working-renter base with shorter leases.
- Zoned schools: Hugh Mercer Elementary (959 students, 84% FRL); Walker-Grant Middle (math 20% / reading 46%, grade F, #332 of 342 statewide, top 97%, 750 students, 83% FRL); James Monroe High (math 25% / reading 70%, grade D, #304 of 319 statewide, top 95%, 1,002 students, 85% FRL) — zoned schools average 84% FRL vs 54% district-wide (30 pts higher); higher-poverty schools than district average — tighter screening recommended.
- Market conditions: Rents flat; 121 active listings in the ZIP; 17 comparable units currently listed for rent nearby; rentals leasing fast (median 1d on market — plan ~1-2 weeks tenant-placement turnaround); solid renter incomes; 37 units permitted in Fredericksburg city in 2024 (0 in 5+ unit buildings).
Forward outlook
- Local home prices are declining (-3.0%/yr); year-one equity from $2k of loan paydown is wiped out by about $7k of value loss. Plan a longer hold.
- Fredericksburg County population projected at +66% by 2050 — long-run rental-demand tailwind backs the buy-and-hold thesis.
Negotiation context
- It's been on market 49 days — a 3% lower offer ($241k) is reasonable based on typical stale-listing flexibility.
- 5 sale attempts since 22y ago with the ask held roughly flat each time — persistent listings suggest the price (not the market) is what's stuck; bring a comps-based counter.
- Current owner paid $70k; list at $249k implies a 254% gain — meaningful room to come down on a strong offer.
Risks & watch-outs
- Climate carrying-cost: moderate wind risk, 21% chance of damaging wind over 30y; extreme-heat days projected 7→17/yr by 2055 (HVAC capex compounding) — expect insurance premiums to compound above CPI over the hold.
Questions for the listing agent
- It's been on market 49 days. Have you received any prior offers? Is the seller open to a 16% concession, seller financing, or rate buy-down credit?
- Built in 1977 — when were the roof, HVAC, electrical panel, plumbing, and water heater last replaced?
- What does the HOA fee cover, when was the last increase, and are there any pending special assessments or reserve-fund shortfalls?
- Any open or pending special assessments — roof, HVAC, plumbing, elevator, façade? What's the per-unit balance and payoff schedule, and is the seller paying it off at close or rolling it to the buyer?
- Is there a deadline driving the sale (1031 exchange, divorce, estate, relocation)? That informs how much negotiation room exists.
- Schools are A-rated — typically a magnet for longer-tenancy family renters. What's the average tenant stay here, and is there a school-zone premium baked into asking?
- Crime grade is F in this area — have there been break-ins, vandalism, or insurance claims at this property in the last 3 years? What carrier currently insures it and at what premium?
- The area grade is low — what's the realistic commute time and amenity access for the typical tenant pool here? Any planned neighborhood developments (good or bad) we should know about?
- What's the average days-on-market for RENTAL listings here right now (not sales)? A rising rental-DOM trend means longer vacancies and softer asking-rent achievability than the comps imply.
- What's the recent tenant-quality profile in this submarket — average credit score on applications, eviction rate, late-payment / NSF rate, and stable-employment percentage? A property-management company in the area should have these aggregated.
- How much new apartment / multifamily construction is in the pipeline within 1–3 miles? Heavy new supply (>2% of stock underway) typically softens rents 12–24 months out; light construction supports rent growth.
Investment metrics
- 1% rule
- 0.84% ✗
- Cap rate
- 6.44%
- Cash-on-cash
- 0.51%
- DSCR
- 1.02
- GRM
- 9.9
CMA / ARV
No comps found within radius.
Projected returns pro-forma
-3.0% appreciation · 0.2% rent growth · sell at horizon
- IRR
- -18.5%
- Equity multiple
- 0.37×
- Total profit
- $-44,220
- Equity at exit
- $37,110
- IRR
- -17.4%
- Equity multiple
- 0.16×
- Total profit
- $-58,476
- Equity at exit
- $21,519
Cash invested: $69,689 (down + closing). Projections, not guarantees.
Landlord ↔ Tenant lean methodology
- Overall (STATE)
- 55 Moderately Landlord-Leaning
- State Virginia
- 55 Moderately Landlord-Leaning · D+2
- County
- — inherits STATE
- City
- — inherits STATE
ZIP-level market 22401
- Home prices YoY
- -30.7%
- Rents YoY
- 0.2%
- Active inventory
- 121
- Price-to-rent
- 9.9×
Monthly cashflow live
- Estimated rent
- $2,096 high interval (Pro) →
- Mortgage (P&I)
- −$1,305
- Tax from tax record
- −$133 /mo · $1,601/yr
- Insurance
- −$104
- HOA
- −$84
- Vacancy / Maint / Mgmt
- −$440
- Net cashflow
- $30
Break-even live
Sensitivity live
| Price | -10% $170 | -5% $100 | +0% $30 | +5% $-41 | +10% $-111 |
|---|---|---|---|---|---|
| Rent | -10% $-136 | -5% $-53 | +0% $30 | +5% $112 | +10% $195 |
| Rate | -1.0pp $155 | -0.5pp $93 | base $30 | +0.5pp $-35 | +1.0pp $-101 |
UW: 25.0% down · 7.5% · 30yr · 1.5% tax · 5.0% vac · 8.0% maint · 8.0% mgmt
Financing live
Cash to close
- Down payment
- $62,222
- Closing costs
- $7,467
- Reserves months
- —
- Total cash needed
- —
Loan-product check · same deal, 3 products live
Conventional
25% down · 7.5% · 30yr
- Down + closing
- —
- Monthly P&I
- —
- Monthly cashflow
- —
- DSCR
- —
- Eligible?
- —
Personal DTI + credit; lowest rate.
DSCR
20% down · 8.5% · 30yr
- Down + closing
- —
- Monthly P&I
- —
- Monthly cashflow
- —
- DSCR
- —
- Eligible?
- —
No personal income docs; deal must DSCR.
Hard money
10% down · 12.0% · 12mo
- Down + closing
- —
- Monthly P&I
- —
- Monthly cashflow
- —
- DSCR
- —
- Eligible?
- —
Short-term bridge; refi at stabilization.
Rent comps 17 comps
| Address | Beds | Baths | Sqft | Rent | $/sqft | DOM | Units | Dist |
|---|---|---|---|---|---|---|---|---|
| 400 Rann Ct Fredericksburg, VA | 3.0 | 1.5 | 1141 | $1,895 | $1.66 | 0d | 1 | 0.03mi |
| 319 Brock Sq Fredericksburg, VA | 2.0 | 2.0 | 950 | $1,749 | $1.84 | 4d | 1 | 0.07mi |
| 330 Brock Sq Fredericksburg, VA | 3.0 | 1.5 | 1141 | $2,050 | $1.80 | 0d | 1 | 0.09mi |
| 1150 Noble Way Fredericksburg, VA | 2.0–3.0 | 2.0 | 1191 | $2,125 | $1.78 | 0d | 1 | 0.53mi |
| 1300 Forest Vlg Fredericksburg, VA | 1.0–3.0 | 1.0 | 916 | $1,450 | $1.58 | 0d | 1 | 0.58mi |
| 1201 Ashford Cir Fredericksburg, VA | 1.0–3.0 | 1.0–2.0 | 1127 | $3,600 | $3.19 | 0d | 16 | 0.66mi |
| 1001 Dunes St Fredericksburg, VA | 1.0–3.0 | 1.0–2.0 | 1040 | $2,663 | $2.56 | 0d | 34 | 0.96mi |
| 3107 Linden Ave Fredericksburg, VA | 4.0 | 1.0 | 1152 | $2,400 | $2.08 | 0d | 1 | 0.98mi |
| 2352 Cowan Blvd Fredericksburg, VA | 3.0 | 2.0 | 1069 | $1,899 | $1.78 | 14d | 1 | 1.04mi |
| 2352 Cowan Blvd Fredericksburg, VA | 1.0–2.0 | 1.0 | 772 | $1,599 | $2.07 | 0d | 1 | 1.04mi |
| 123 Streamview Dr Fredericksburg, VA | 3.0 | 3.0 | 1280 | $2,300 | $1.80 | 45d | 1 | 1.05mi |
| 623 Anvil Rd Fredericksburg, VA | 3.0 | 2.5 | 1240 | $1,795 | $1.45 | 0d | 1 | 1.11mi |
| 3456 Fall Hill Ave Fredericksburg, VA | 2.0 | 1.0 | 840 | $1,850 | $2.20 | 18d | 1 | 1.16mi |
| 101 Riverside Manor Blvd Fredericksburg, VA | 2.0–3.0 | 2.5 | 1400 | $2,425 | $1.73 | 0d | 1 | 1.19mi |
| 908 Anvil Rd Fredericksburg, VA | 3.0 | 1.5 | 1200 | $1,550 | $1.29 | 7d | 1 | 1.25mi |
| 929 Anvil Rd Fredericksburg, VA | 3.0 | 1.5 | 1200 | $1,900 | $1.58 | 45d | 1 | 1.29mi |
| 2000 Woodlyn Dr Fredericksburg, VA | 1.0–2.0 | 1.0 | 790 | $1,644 | $2.08 | 0d | 2 | 1.41mi |
HOA detail condo
- Monthly dues
- $84 · $1,008/yr
- Assessments
- None detected in remarks — confirm with the listing agent.
Listing history 21 events
-
2026-06-04days on market $248,888 Active 49 DOM
-
2026-06-03days on market $248,888 Active 48 DOM
-
2026-06-02days on market $248,888 Active 47 DOM
-
2026-06-01days on market $248,888 Active 46 DOM
-
2026-05-31days on market $248,888 Active 45 DOM
-
2026-04-17$248,888 Active 403-char remark
Show marketing remark (403 chars)
About this home: Handyman and investor special! Rarely available 3-bedroom townhome at this price these days. Needs substantial renovation, but it provides great potential to build your equity value. Don't miss the opportunity to grab it quickly, as the owner is likely to change mind and renovate it by himself and then sell for a regular price. Please contact owner directly for showing and offering.
-
2026-04-17historical $248,888 403-char remark
Show marketing remark (403 chars)
About this home: Handyman and investor special! Rarely available 3-bedroom townhome at this price these days. Needs substantial renovation, but it provides great potential to build your equity value. Don't miss the opportunity to grab it quickly, as the owner is likely to change mind and renovate it by himself and then sell for a regular price. Please contact owner directly for showing and offering.
-
2016-05-18historical 173-char remark
Show marketing remark (173 chars)
Are you looking for an investment opportunity? Are you looking for a low maintenance rental? This property is made of pure potential. Needs repairs but a solid investment.
-
2016-05-16soldstatus $70,350 173-char remark
Show marketing remark (173 chars)
Are you looking for an investment opportunity? Are you looking for a low maintenance rental? This property is made of pure potential. Needs repairs but a solid investment.
-
2016-05-16soldstatus $70,350 Sold
Show marketing remark (173 chars)
Are you looking for an investment opportunity? Are you looking for a low maintenance rental? This property is made of pure potential. Needs repairs but a solid investment.
-
2016-03-31status Contract
-
2016-03-18$68,000 Active
Show marketing remark (173 chars)
Are you looking for an investment opportunity? Are you looking for a low maintenance rental? This property is made of pure potential. Needs repairs but a solid investment.
-
2016-03-18$68,000 173-char remark
Show marketing remark (173 chars)
Are you looking for an investment opportunity? Are you looking for a low maintenance rental? This property is made of pure potential. Needs repairs but a solid investment.
-
2006-12-31historical
-
2006-05-25
-
2004-04-30soldstatus $91,900
-
2004-04-30soldstatus $91,900
-
2004-03-18historical
-
2004-03-16$91,900
-
2000-12-28soldstatus $1,087,500
-
1990-02-01soldstatus $312,000
ⓘ Source: listings_history table (triggers on properties + properties_extension) + one-shot
backfill from property_details.listing_events for pre-trigger history.
Tax reassessment forecast VA · Resets to sale price
- Current annual tax
- $1,601 · $133/mo
- Projected year-2 tax
- $2,041 · $170/mo
- Expected delta
- +$440/yr (+$37/mo · 27.4%)
ⓘ Screening estimate from a state-policy table — verify with the county assessor before closing.
Climate risk First Street
- Flood 1/10 Low FEMA zone X (unshaded) · 0% chance over 30 yrs
- Wildfire 4/10 Moderate
- Heat 8/10 Severe 7 d/yr ≥107°F today · 17 d/yr by 30 yrs out
- Wind 5/10 Major 21% chance of damaging wind over 30 yrs
- Air quality 2/10 Low 0 unhealthy d/yr today · 1 by 30 yrs out
Nearby sold comps map
Loading sold comps map…
Walkable amenities ~0.75 mi
Loading nearby amenities…
Taxation est. · year 1
- Rental income
- $25,153
- − Mortgage interest
- −$13,942
- − Property taxes
- −$1,601
- − Insurance
- −$1,244
- − Repairs & maintenance
- −$2,012
- − Management
- −$2,012
- − HOA
- −$1,008
- − Depreciation
- −$7,240
- Taxable loss
- −$3,908
- Est. tax savings @ 24.0%
- +$938
- After-tax cash flow
- $1,292/yr
For passive investors: Depreciation is non-cash, so a rental often shows a tax loss while cash-flowing — sheltering income. Rental losses are passive: they offset passive income freely, and up to $25,000/yr can offset ordinary (W-2) income if you actively participate and your MAGI is under $100k (phasing out to $0 by $150k); unused losses carry forward. On sale, claimed depreciation is recaptured at up to 25%, and gains may owe capital-gains tax (a 1031 exchange can defer both). Figures are a year-1 estimate at your 24.0% rate — not tax advice; consult a CPA.
Schools (NCES district)
- District
- Fredericksburg City Public School District
- NCES district ID
- 5101510
- Math proficiency
- 27% ▼ -34.00%
- Reading proficiency
- 54% ▼ -10.00%
- Median HH income
- $49,839
- Composite
- 34.78/100
- National rank
- #5121
- State rank
- #119 of 131 in VA
Livability — Fredericksburg
- Score
- 67/100
- State rank
- #299
- US rank
- #10735
Category grades
Schools grade is shown separately in the Schools card above.
Census & demographics
- Census place
- Fredericksburg, VA
- County
- Fredericksburg City · 28,731 people
- City population
- 207,206
- Metro
- Washington-Arlington-Alexandria, DC-VA-MD-WV
- Population (ZIP)
- 28,731
- Household income
- $86,230
- Rent vs Own
- Severe rent burden
- 1698.0
Population outlook (Fredericksburg County) Hauer SSP2
- Today (2025)
- 36,164 people
- By 2030
- 40,700 · +12.5%
- By 2040
- 50,013 · +38.3%
- By 2050
- 59,947 · +65.8%
- By 2075
- 83,220 · +130.1%
- By 2100
- 101,491 · +180.6%
Race, ethnicity, and origin ACS 2023
- Neighborhood character
- Diverse neighborhood (Simpson 0.63)
- Race & ethnicity
- White 56% Black 20% Hispanic / Latino 12% Two or more races 10% Asian 4%
- Hispanic origin (detail)
- Mexican 3% Puerto Rican 1%
- Common ancestry
- Italian 4% Slovak 3% Romanian 2%
- Foreign-born
- 12% · Canada, South Korea
- Languages at home
- 82% English-only · Spanish 9% Other Indo-European 5% German/W. Germanic 1%
Political lean MEDSL · Fredericksburg
- 2024 margin
- Solid D (+31.7) · D 64.9% · R 33.2% · Other 1.9%
- 2008→2024 swing
- +3.4pp toward D · 2008: 28.3pp · 2024: 31.7pp
- All cycles
- 2024: D+31.7 2020: D+34.8 2016: D+26.6 2012: D+26.9 2008: D+28.3
Not yet ingested
- Civics
- —
Market trends
- HPI YoY
- ▼ -147.45%
- Current HPI
- 332.4856
- Rent YoY
- ▲ 0.20%
- Metro
- Washington-Arlington-Alexandria, DC-VA-MD-WV
- State GDP YoY
- ▲ 2.40%
- F500 in state
- 50
Industry mix (Fortune 500 HQ in VA)
| Industry | F500 HQs | Revenue |
|---|---|---|
| Aerospace / Defense | 4 | $236B |
|
||
| Technology / Defense | 3 | $32B |
|
||
| Financial Services | 2 | $176B |
|
||
| Utilities | 2 | $27B |
|
||
| Insurance | 2 | $25B |
|
||
| Technology | 2 | $15B |
|
||
Price history
-20.2% since first listed16 events — show timeline
- 2026-04-17 Listed $248,888 BRIGHT MLS
- 2026-04-17 Coming Soon $248,888 BRIGHT MLS
- 2016-05-18 Listing Removed — BRIGHT MLS
- 2016-05-16 Sold (MLS) $70,350 MRIS
- 2016-05-16 Sold (MLS) $70,350 BRIGHT MLS
- 2016-03-31 Pending — MRIS
- 2016-03-18 Listed $68,000 MRIS
- 2016-03-18 Listed $68,000 BRIGHT MLS
- 2006-12-31 Delisted — MRIS
- 2006-05-25 Listed — MRIS
- 2004-04-30 Sold (Public Records) $91,900 Public Records
- 2004-04-30 Sold (MLS) $91,900 MRIS
- 2004-03-18 Delisted — MRIS
- 2004-03-16 Listed $91,900 MRIS
- 2000-12-28 Sold (Public Records) $1,087,500 Public Records
- 1990-02-01 Sold (Public Records) $312,000 Public Records
Property tax history
+17.7%/yrLatest (2025): $1,601 · +5.2% YoY. Source: county tax records.
Cash-flow waterfall
monthlySold comps — $/sqft
last 12 mo · ≤1 miLoading sold comps…