 🏗️ New Construction
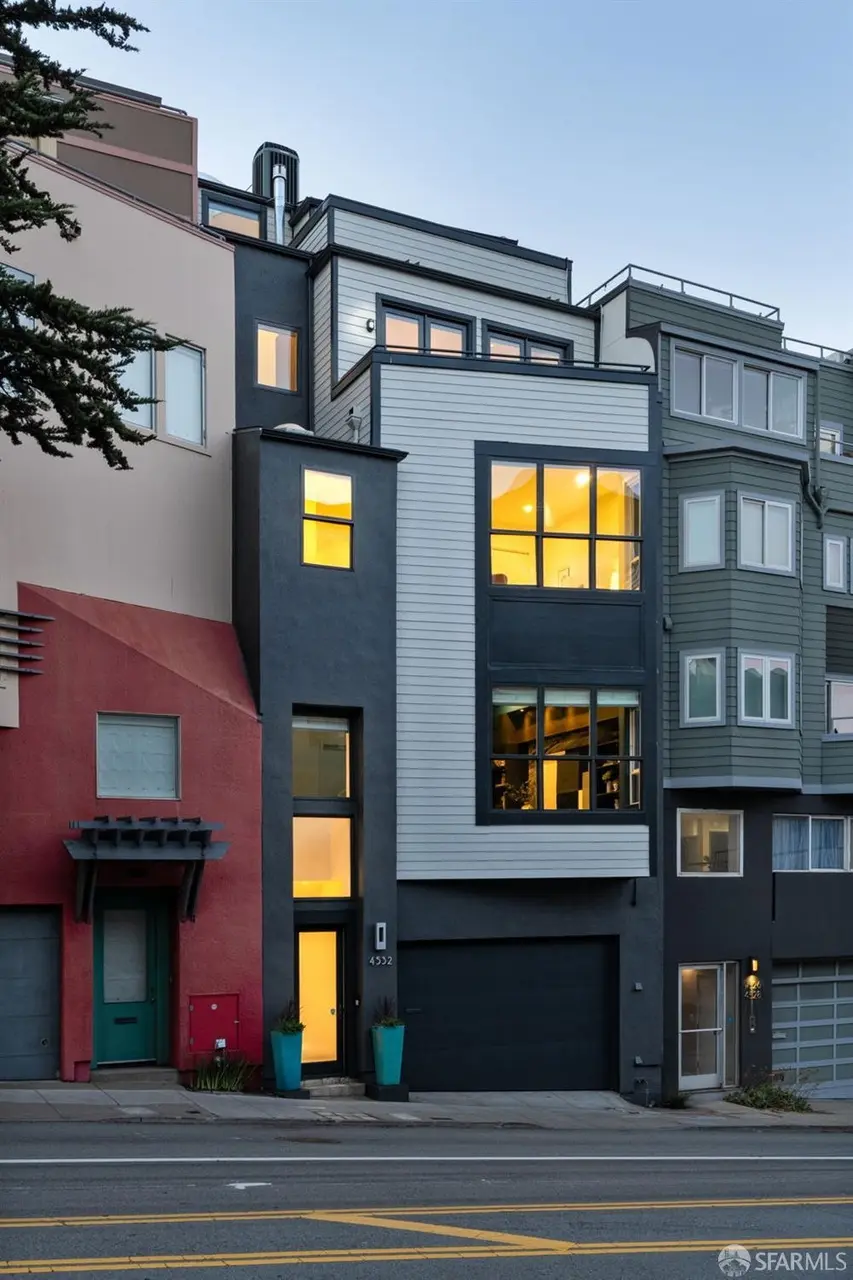
4532 17th St · San Francisco, CA
Flood risk 1/10 · Minimal
- FEMA flood zone
- X (unshaded)
- Chance of flooding over 30 yrs
- 0.0%
- Est. flood insurance / yr
- $507 – $1,088
Fire risk 1/10 · Minimal
- Est. fire insurance / yr
- $659 – $1,223
Heat risk 1/10 · Minimal
- Hot days now (above 76°F)
- 7 days/yr
- Hot days in 30 yrs
- 16 days/yr
Wind risk 1/10 · Minimal
- Chance of severe wind over 30 yrs
- —
Air-quality risk 8/10 · Major
- Unhealthy air days now
- 15 days/yr
- Unhealthy air days in 30 yrs
- 15 days/yr
Risk factors via First Street. Map © Google.
Why this score? — see what drove the F grade
The composite is a weighted blend of 9 inputs, each scored 0–100. Each bar is that input's sub-score; the figure is the points it added to the 100-point composite (weight × sub-score).
- Appreciation +9.8/10.0
- ARV discount +7.5/15.0
- Rent growth +5.0/5.0
- Schools +5.0/10.0
- Livability +3.8/5.0
- Condition / age +2.5/5.0
- Cash flow +1.4/30.0
- 1% rule +0.0/10.0
- DSCR +0.0/10.0
$2,995,000
🖨 Deal sheet (PDF) 📄 Offer letter ✓ Due diligence
Listing remarks
A views-centric residence spanning nearly 3,000 square feet of interior living space, 4532 17th Street presents a rare blend of scale, flexibility, privacy, and modern luxury in one of San Francisco's most coveted central locations. Framed by sweeping outlooks from multiple levels, the home captures iconic vistas of Downtown San Francisco, the Bay, sparkling city lights, & Sutro Tower, while also backing to a serene, landscaped hillside that provides an unexpected sense of greenery & retreat in the heart of the city. Ideally positioned moments from Cole Valley, the Castro, & the Upper Haight, this home offers exceptional access to neighborhood amenities, parks, and transit.
Key facts
- Private elevator
- Private rear terrace
- Iconic vistas
Tags
Property features AI
Finance
- HOA & community: No association fee
Exterior
- Parking: Enclosed parking with 2 covered spaces; Independent garage; Garage door opener; Electric vehicle charging station(s); On-site parking
- Utilities: Has heating; Has cooling
- Home design: Single family residence; Residential property; New construction and updated/remodeled; Built in 1999
- Construction: Graphic Artist source for living/building area; Living/building area approx. 2985; Kitchen and bathrooms updated within last 5 years
- Exterior features: Entry on level 0
Interior
- Kitchen: Disposal; Range hood; Ice maker; Microwave
- Bedrooms: 3 bedrooms
- Flooring: Bamboo flooring; Marble flooring
- Bathrooms: 3 full bathrooms
- Heating & cooling: Central heating; Central air conditioning
- Interior features: Formal entry; Storage; One fireplace in the living room
- Laundry & utility: Washer; Dryer; Laundry inside room
Neighborhood map
What this means for you Summary
Snapshot
- This is a 3-bed/3.0-bath single-family listed at $3.00M.
Deal economics
- At list price, monthly cash flow is $-14k ($-164k/yr) — negative.
- To cash-flow at today's rent, offer at most $1.02M (65.8% below list).
- To meet the 1% rule (rent ≥ 1% of price), the offer needs to be $1.01M (66.2% below list).
- Recommended offer: $1.01M (66.2% below list) — sets the bar for 1% rule.
- Cap rate 1.5% vs local median 2.1% in San Francisco — below-typical yield; the buyer is paying a premium for something (appreciation thesis, condition, location) that the cap rate doesn't capture.
Location & tenants
- Location reads 76/100 on livability (#90 in CA, #3,143 nationally) — a middle-class / working-renter tenant base. Strengths: amenities A+, commute A+, employment A+; Watch: crime F, cost of living F.
- San Francisco Unified (urban): math 50% / reading 56% proficiency, ranked #322 of 1,400 in CA (top 23%) — acceptable for families but not a draw, mixed tenant base, ~2y average lease.
- Zoned schools: Lilienthal (Claire) Elementary (669 students, 19% FRL); Giannini (A.P.) Middle (1,192 students, 34% FRL); Lowell High (2,632 students, 37% FRL) — zoned schools average 30% FRL vs 49% district-wide (19 pts lower); this property's tenant base skews higher-income than the district average.
- Market conditions: Rents rising fast (+14.4%/yr); 121 active listings in the ZIP; 9 comparable units currently listed for rent nearby; rentals at typical pace (median 26d on market — plan ~3-4 weeks tenant-placement turnaround); 44% of comp listings sitting > 30 days — soft ceiling on asking rent; high-income renter base; 750 units permitted in San Francisco County in 2024 (688 in 5+ unit buildings).
- At $10,121/mo this rent would consume 59% of the median local household income ($204k/yr) (locally 1336% of renters already pay >50% of income on rent) — very limited rent-growth headroom before tenants either downsize or default.
Forward outlook
- In year one you build about $350k of equity ($24k loan paydown + $326k appreciation (9.5% local appreciation)).
- San Francisco County population projected at +39% by 2050 — long-run rental-demand tailwind backs the buy-and-hold thesis.
- By year 2, paydown + projected appreciation supports a ~$562k cash-out refi (75% LTV) — recoverable capital for the next deal without selling this one.
Negotiation context
- It's been on market 21 days — a 2% lower offer ($2.95M) is reasonable based on typical stale-listing flexibility.
- 8 sale attempts since 29y ago; this cycle's ask has dropped $800k (21%) from the opening price — seller is motivated, your offer sets the floor, not the list.
Questions for the listing agent
- What do current leases actually rent for vs. the listed asking? Can we see a recent rent roll and the last 12 months of T-12 income?
- Is there a deadline driving the sale (1031 exchange, divorce, estate, relocation)? That informs how much negotiation room exists.
- Schools are B-rated — typically a magnet for longer-tenancy family renters. What's the average tenant stay here, and is there a school-zone premium baked into asking?
- Crime grade is F in this area — have there been break-ins, vandalism, or insurance claims at this property in the last 3 years? What carrier currently insures it and at what premium?
- The area grade is low — what's the realistic commute time and amenity access for the typical tenant pool here? Any planned neighborhood developments (good or bad) we should know about?
- What's the average days-on-market for RENTAL listings here right now (not sales)? A rising rental-DOM trend means longer vacancies and softer asking-rent achievability than the comps imply.
- What's the recent tenant-quality profile in this submarket — average credit score on applications, eviction rate, late-payment / NSF rate, and stable-employment percentage? A property-management company in the area should have these aggregated.
- How much new for-sale + rental construction is in the pipeline within 1–3 miles? Heavy new supply typically softens prices + rents 12–24 months out; constrained supply supports both.
Investment metrics
- 1% rule
- 0.29% ✗
- Cap rate
- 1.52%
- Cash-on-cash
- -17.03%
- DSCR
- 0.24
- GRM
- 28.3
CMA / ARV
- ARV (median comp)
- $3,433,542
- List price
- $2,995,000
- Delta
- -12.77%
- Verdict
- UNDERPRICED
- Comps
- 20 within 1.0 mi
Show comp detail 12 sales within ~0.75 mi
| Address | Dist | Beds/Ba | Sqft | Sold | Price | $/sf | Match |
|---|---|---|---|---|---|---|---|
| 4532 17th St | 0.00mi | 3/3.0 | 2,985 (+7%) | 0mo | $3,350,000 | $1,122 | 89 |
| 4376 17th St | 0.19mi | 3/3.5 | 3,045 (+9%) | 2mo | $3,400,000 | $1,117 | 73 |
| 601 Corbett Ave | 0.37mi | 3/2.5 | 2,601 (-7%) | 2mo | $3,000,000 | $1,153 | 68 |
| 4349 20th St | 0.61mi | 4/4.0 (+1) | 2,807 (+0%) | 2mo | $4,163,000 | $1,483 | 61 |
| 159 Carl St #3 | 0.38mi | 3/2.0 | 2,516 (-10%) | 3mo | $1,600,000 | $636 | 59 |
| 143 Collingwood St | 0.58mi | 4/4.0 (+1) | 2,895 (+3%) | 0mo | $4,850,000 | $1,675 | 58 |
| 1443 Shrader St | 0.26mi | 4/3.5 (+1) | 3,150 (+12%) | 5mo | $3,950,000 | $1,254 | 56 |
| 7 Broderick St | 0.70mi | 4/3.5 (+1) | 2,865 (+2%) | 2mo | $4,950,000 | $1,728 | 55 |
| 316 Douglass St | 0.43mi | 3/4.0 | 2,420 (-14%) | 2mo | $4,200,000 | $1,736 | 51 |
| 323 Eureka St | 0.59mi | 4/3.5 (+1) | 2,576 (-8%) | 3mo | $4,999,999 | $1,941 | 50 |
| 279 Diamond St | 0.58mi | 4/2.5 (+1) | 3,010 (+8%) | 5mo | $4,580,000 | $1,522 | 49 |
| 4333 23rd St | 0.75mi | 3/3.0 | 2,467 (-12%) | 2mo | $3,200,000 | $1,297 | 43 |
Match score weights: distance 35% · size 25% · config 20% · recency 20%. Top-matched comps best support the ARV.
Projected returns pro-forma
9.51% appreciation · 8.0% rent growth · sell at horizon
- IRR
- 11.9%
- Equity multiple
- 1.98×
- Total profit
- $937,964
- Equity at exit
- $2,970,544
- IRR
- 13.0%
- Equity multiple
- 4.69×
- Total profit
- $3,548,120
- Equity at exit
- $6,279,899
Cash invested: $961,392 (down + closing). Projections, not guarantees.
Landlord ↔ Tenant lean methodology
- Overall (CITY)
- 0 Strongly Tenant-Friendly
- State California
- 18 Strongly Tenant-Friendly · D+13
- County
- — inherits STATE
- City San Francisco
- 0 Strongly Tenant-Friendly · D+57
ZIP-level market 94114
- Home prices YoY
- 4.4%
- Rents YoY
- 14.4%
- Active inventory
- 121
- Price-to-rent
- 24.7×
Monthly cashflow live
- Estimated rent
- $10,121 high interval (Pro) →
- Mortgage (P&I)
- −$18,006
- Tax from tax record
- −$2,204 /mo · $26,451/yr
- Insurance
- −$1,431
- HOA
- −$0
- Vacancy / Maint / Mgmt
- −$2,125
- Net cashflow
- $-13,645
Break-even live
Sensitivity live
| Price | -10% $-11,702 | -5% $-12,674 | +0% $-13,645 | +5% $-14,617 | +10% $-15,589 |
|---|---|---|---|---|---|
| Rent | -10% $-14,445 | -5% $-14,045 | +0% $-13,645 | +5% $-13,246 | +10% $-12,846 |
| Rate | -1.0pp $-11,916 | -0.5pp $-12,772 | base $-13,645 | +0.5pp $-14,535 | +1.0pp $-15,440 |
UW: 25.0% down · 7.5% · 30yr · 1.5% tax · 5.0% vac · 8.0% maint · 8.0% mgmt
Financing live
Cash to close
- Down payment
- $858,385
- Closing costs
- $103,006
- Reserves months
- —
- Total cash needed
- —
Loan-product check · same deal, 3 products live
Conventional
25% down · 7.5% · 30yr
- Down + closing
- —
- Monthly P&I
- —
- Monthly cashflow
- —
- DSCR
- —
- Eligible?
- —
Personal DTI + credit; lowest rate.
DSCR
20% down · 8.5% · 30yr
- Down + closing
- —
- Monthly P&I
- —
- Monthly cashflow
- —
- DSCR
- —
- Eligible?
- —
No personal income docs; deal must DSCR.
Hard money
10% down · 12.0% · 12mo
- Down + closing
- —
- Monthly P&I
- —
- Monthly cashflow
- —
- DSCR
- —
- Eligible?
- —
Short-term bridge; refi at stabilization.
Rent comps 9 comps
| Address | Beds | Baths | Sqft | Rent | $/sqft | DOM | Units | Dist |
|---|---|---|---|---|---|---|---|---|
| 143 Corbett Ave San Francisco, CA | 4.0 | 4.0 | 2500 | $10,500 | $4.20 | 45d | 1 | 0.25mi |
| 1265 Stanyan St San Francisco, CA | 3.0 | 2.0 | 2005 | $13,900 | $6.93 | 9d | 1 | 0.35mi |
| 124 Alpine Ter San Francisco, CA | 3.0 | 2.0 | 2200 | $11,995 | $5.45 | 15d | 1 | 0.64mi |
| 124 Alpine Ter San Francisco, CA | 3.0 | 2.0 | 2200 | $12,500 | $5.68 | 26d | 1 | 0.64mi |
| 124 Alpine Ter San Francisco, CA | 3.0 | 2.0 | 2200 | $11,995 | $5.45 | 12d | 1 | 0.64mi |
| 753 Castro St San Francisco, CA | 4.0 | 3.0 | 2467 | $10,950 | $4.44 | 45d | 1 | 0.73mi |
| 65 High St Unit NA San Francisco, CA | 4.0 | 3.0 | 2315 | $9,950 | $4.30 | 45d | 1 | 0.95mi |
| 1059 Noe St San Francisco, CA | 3.0 | 2.5 | 2545 | $14,000 | $5.50 | 45d | 1 | 1.04mi |
| 2577 Post St San Francisco, CA | 4.0 | 3.0 | 2754 | $15,000 | $5.45 | 5d | 1 | 1.49mi |
Listing history 25 events
-
2026-06-07status $2,995,000 Pending 21 DOM
-
2026-06-04days on market $2,995,000 Active 21 DOM
-
2026-06-03days on market $2,995,000 Active 20 DOM
-
2026-06-02days on market $2,995,000 Active 19 DOM
-
2026-06-01days on market $2,995,000 Active 18 DOM
-
2026-05-31days on market $2,995,000 Active 17 DOM
-
2026-05-14price $3,695,000 2471-char remark
-
2026-05-14$3,795,000 Active 2471-char remark
-
2016-12-12historical
-
2016-12-09soldstatus $1,925,000 Closed
-
2016-12-09soldstatus $1,925,000
-
2016-11-14status Pending
-
2016-09-29price $1,999,000
-
2016-08-05$2,495,000 Active
-
2002-10-16soldstatus $1,076,000
-
2002-10-16soldstatus $1,076,000
-
2002-09-13historical
-
2002-07-10$1,149,000
-
2002-03-26$1,350,000
-
1999-08-19soldstatus $1,050,000
-
1999-07-15historical
-
1999-06-10$1,050,000
-
1998-03-31$199,000
-
1998-02-13$270,000
-
1997-11-01$299,500
ⓘ Source: listings_history table (triggers on properties + properties_extension) + one-shot
backfill from property_details.listing_events for pre-trigger history.
Tax reassessment forecast CA · Resets to sale price
- Current annual tax
- $26,451 · $2,204/mo
- Projected year-2 tax
- $26,451 · $2,204/mo
- Expected delta
- $0/yr ($0/mo · 0.0%)
ⓘ Screening estimate from a state-policy table — verify with the county assessor before closing.
Climate risk First Street
- Flood 1/10 Low FEMA zone X (unshaded) · 0% chance over 30 yrs
- Wildfire 1/10 Low
- Heat 1/10 Low 7 d/yr ≥76°F today · 16 d/yr by 30 yrs out
- Wind 1/10 Low
- Air quality 8/10 Severe 15 unhealthy d/yr today · 15 by 30 yrs out
Nearby sold comps map
Loading sold comps map…
Walkable amenities ~0.75 mi
Loading nearby amenities…
Taxation est. · year 1
- Rental income
- $121,447
- − Mortgage interest
- −$192,332
- − Property taxes
- −$26,451
- − Insurance
- −$17,168
- − Repairs & maintenance
- −$9,716
- − Management
- −$9,716
- − Depreciation
- −$99,885
- Taxable loss
- −$233,819
- Est. tax savings @ 24.0%
- +$56,117
- After-tax cash flow
- $-107,629/yr
For passive investors: Depreciation is non-cash, so a rental often shows a tax loss while cash-flowing — sheltering income. Rental losses are passive: they offset passive income freely, and up to $25,000/yr can offset ordinary (W-2) income if you actively participate and your MAGI is under $100k (phasing out to $0 by $150k); unused losses carry forward. On sale, claimed depreciation is recaptured at up to 25%, and gains may owe capital-gains tax (a 1031 exchange can defer both). Figures are a year-1 estimate at your 24.0% rate — not tax advice; consult a CPA.
Schools (NCES district)
- District
- San Francisco Unified
- NCES district ID
- 0634410
- Math proficiency
- 50% ▬ 0.00%
- Reading proficiency
- 56% ▲ 1.00%
- Median HH income
- $81,249
- Composite
- 50.14/100
- National rank
- #4088
- State rank
- #322 of 1400 in CA
Livability — San Francisco
- Score
- 76/100
- State rank
- #90
- US rank
- #3143
Category grades
Schools grade is shown separately in the Schools card above.
Census & demographics
- Census place
- San Francisco, CA
- County
- San Francisco County · 827,552 people
- City population
- 827,552
- Metro
- San Francisco-Oakland-Berkeley, CA
- Population (ZIP)
- 33,020
- Household income
- $204,134
- Rent vs Own
- Severe rent burden
- 1336.0
Population outlook (San Francisco County) Hauer SSP2
- Today (2025)
- 1,030,936 people
- By 2030
- 1,110,409 · +7.7%
- By 2040
- 1,270,010 · +23.2%
- By 2050
- 1,435,001 · +39.2%
- By 2075
- 1,779,074 · +72.6%
- By 2100
- 1,966,767 · +90.8%
Race, ethnicity, and origin ACS 2023
- Neighborhood character
- Predominantly White (65%)
- Race & ethnicity
- White 65% Asian 14% Two or more races 12% Hispanic / Latino 10% Black 2%
- Hispanic origin (detail)
- Mexican 5%
- Common ancestry
- Lithuanian 4% Italian 4% Romanian 3%
- Foreign-born
- 20% · Canada, China, Vietnam
- Languages at home
- 77% English-only · Spanish 6% Chinese 4% Other Indo-European 4%
Political lean MEDSL · San Francisco
- 2024 margin
- Solid D (+64.8) · D 80.3% · R 15.5% · Other 4.1%
- 2008→2024 swing
- -5.7pp toward R · 2008: 70.5pp · 2024: 64.8pp
- All cycles
- 2024: D+64.8 2020: D+72.5 2016: D+76.1 2012: D+70.2 2008: D+70.5
Not yet ingested
- Civics
- —
Market trends
- HPI YoY
- ▲ 9.51%
- Current HPI
- 223.6988
- Rent YoY
- ▲ 14.40%
- Metro
- San Francisco-Oakland-Berkeley, CA
- State GDP YoY
- ▲ 3.21%
- F500 in state
- 116
Industry mix (Fortune 500 HQ in CA)
| Industry | F500 HQs | Revenue |
|---|---|---|
| Technology | 27 | $1,492B |
|
||
| Financial Services | 3 | $174B |
|
||
| Retail | 3 | $44B |
|
||
| Insurance | 3 | $26B |
|
||
| Media / Entertainment | 2 | $115B |
|
||
| Pharmaceuticals / Biotech | 2 | $62B |
|
||
Price history
+1018.5% since first listed22 events — show timeline
- 2026-06-12 Sold (MLS) $3,350,000 San Francisco MLS
- 2026-06-04 Pending — San Francisco MLS
- 2026-05-28 Price Changed $2,995,000 San Francisco MLS
- 2026-05-14 Price Changed $3,695,000 San Francisco MLS
- 2026-05-14 Listed $3,795,000 San Francisco MLS
- 2016-12-12 Delisted — San Francisco MLS
- 2016-12-09 Sold (Public Records) $1,925,000 Public Records
- 2016-12-09 Sold (MLS) $1,925,000 San Francisco MLS
- 2016-11-14 Pending — San Francisco MLS
- 2016-09-29 Price Changed $1,999,000 San Francisco MLS
- 2016-08-05 Listed $2,495,000 San Francisco MLS
- 2002-10-16 Sold (Public Records) $1,076,000 Public Records
- 2002-10-16 Sold (MLS) $1,076,000 San Francisco MLS
- 2002-09-13 Delisted — San Francisco MLS
- 2002-07-10 Listed $1,149,000 San Francisco MLS
- 2002-03-26 Listed $1,350,000 San Francisco MLS
- 1999-08-19 Sold (MLS) $1,050,000 San Francisco MLS
- 1999-07-15 Delisted — San Francisco MLS
- 1999-06-10 Listed $1,050,000 San Francisco MLS
- 1998-03-31 Listed $199,000 San Francisco MLS
- 1998-02-13 Listed $270,000 San Francisco MLS
- 1997-11-01 Listed $299,500 San Francisco MLS
Property tax history
+3.8%/yrLatest (2025): $26,451 · +3.0% YoY. Source: county tax records.
Cash-flow waterfall
monthlySold comps — $/sqft
last 12 mo · ≤1 miLoading sold comps…