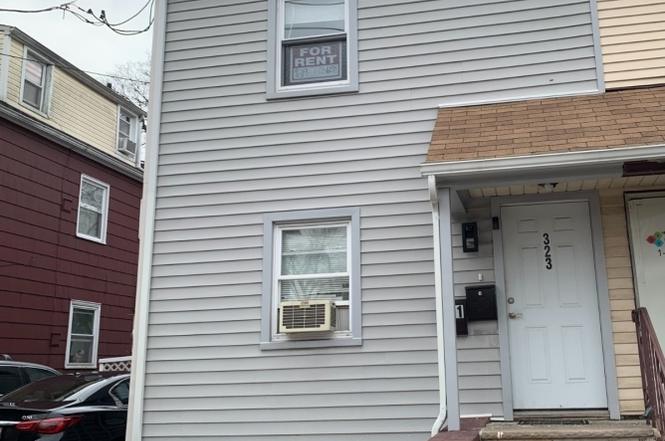
323 Union Ave · Newark, NJ
Flood risk 1/10 · Minimal
- FEMA flood zone
- X (unshaded)
- Chance of flooding over 30 yrs
- 0.0%
- Est. flood insurance / yr
- $507 – $1,088
Fire risk 1/10 · Minimal
- Est. fire insurance / yr
- $526 – $976
Heat risk 7/10 · Major
- Hot days now (above 101°F)
- 7 days/yr
- Hot days in 30 yrs
- 15 days/yr
Wind risk 6/10 · Moderate
- Chance of severe wind over 30 yrs
- 27.0%
Air-quality risk 4/10 · Minor
- Unhealthy air days now
- 4 days/yr
- Unhealthy air days in 30 yrs
- 5 days/yr
Risk factors via First Street. Map © Google.
Why this score? — see what drove the F grade
The composite is a weighted blend of 9 inputs, each scored 0–100. Each bar is that input's sub-score; the figure is the points it added to the 100-point composite (weight × sub-score).
- ARV discount +7.5/15.0
- Appreciation +5.0/10.0
- Cash flow +4.7/30.0
- Livability +3.4/5.0
- Rent growth +2.5/5.0
- Condition / age +2.5/5.0
- 1% rule +1.6/10.0
- Schools +1.1/10.0
- DSCR +0.0/10.0
$449,000
🖨 Deal sheet 📄 Offer letter ✓ Due diligence
Listing remarks
Charming, move in condition, two-family home in a two-story half of a quadruplex. The first floor unit features a living room, eat-in-kitchen, bedroom, and full bath, with direct access to a finished basement offering a recreation room, additional bedroom, full bath, storage, and utility area. The updated second floor unit includes a living room, eat-in kitchen, bedroom, and full bath, plus central air conditioning. Both units enjoy abundant natural light. The fenced backyard provides space for outdoor gatherings, and the driveway accommodates off-street parking for two vehicles. Ideal for owner-occupiers and investors alike.
Key facts
- Recreation room
- Finished basement
- Fenced backyard
Tags
Property features AI
Finance
- Financial info: Multifamily property with 2 units; Unit 1 rent: $1,825 (security deposit $1,800); Unit 2 rent: not listed; Reported net operating income, gross income, and operating expenses: $0 (no data provided)
Exterior
- Parking: 2 parking spaces
- Utilities: Electric service; Natural gas service; Public water; Public sewer
- Home design: Two-story building; Fourplex; Renovated in 2022; Year built listed as approximate
- Construction: Vinyl siding construction; Asphalt shingle roof; Approximate year built; Renovated in 2022
- Exterior features: Vinyl siding; Asphalt shingle roof; Blacktop driveway
Interior
- Kitchen: Unit 2: Dishwasher; Unit 2: Refrigerator; Unit descriptions include eat-in kitchens
- Bedrooms: Unit 1: 1 bedroom; Unit 2: 1 bedroom
- Flooring: Wood floors
- Bathrooms: 3 full bathrooms (total)
- Heating & cooling: Natural gas heating; One heating unit; One cooling unit
- Interior features: Carbon monoxide detector; Smoke detector; Wood floors; Finished full walkout basement
- Laundry & utility: Owner/tenant utility split: owner pays water; tenants pay electric and gas
Neighborhood map
What this means for you Summary
Snapshot
- This is a 6-bed/6.0-bath single-family listed at $449k.
Deal economics
- At list price, monthly cash flow is $-1k ($-13k/yr) — negative.
- To cash-flow at today's rent, offer at most $252k (43.9% below list).
- To meet the 1% rule (rent ≥ 1% of price), the offer needs to be $295k (34.3% below list).
- Recommended offer: $252k (43.9% below list) — sets the bar for cash-flow.
Location & tenants
- Location reads 67/100 on livability (#343 in NJ) — a middle-class / working-renter tenant base. Strengths: commute A+, amenities A-; Watch: schools D+, housing D+, crime F.
- Irvington Public School District (suburban): math 4% / reading 23% proficiency, ranked #465 of 472 in NJ (top 98%) — low school quality limits family demand, transient renter base, plan for 1-2y turnover; 70% free/reduced lunch — lower-income household profile, screen leases tightly.
- Market conditions: 2 active listings in the ZIP; 1 comparable units currently listed for rent nearby; 3,364 units permitted in Essex County in 2024 (2,551 in 5+ unit buildings).
Forward outlook
- In year one you build about $17k of equity ($3k loan paydown + $13k appreciation (3.0% local appreciation)).
- Essex County population projected at +3% by 2050 — modest demand growth; plan on rents tracking national, not racing it.
- By year 3, paydown + projected appreciation supports a ~$41k cash-out refi (75% LTV) — recoverable capital for the next deal without selling this one.
Negotiation context
- It's been on market 59 days — a 3% lower offer ($436k) is reasonable based on typical stale-listing flexibility.
- 2 sale attempts; this cycle's ask has dropped $50k (10%) from the opening price — seller is motivated, your offer sets the floor, not the list.
Risks & watch-outs
- Watch-outs: built in 1942 — expect roof / HVAC / electrical / plumbing capex.
- Climate carrying-cost: major wind risk, 27% chance of damaging wind over 30y; extreme-heat days projected 7→15/yr by 2055 (HVAC capex compounding) — expect insurance premiums to compound above CPI over the hold.
Questions for the listing agent
- What do current leases actually rent for vs. the listed asking? Can we see a recent rent roll and the last 12 months of T-12 income?
- It's been on market 59 days. Have you received any prior offers? Is the seller open to a 44% concession, seller financing, or rate buy-down credit?
- Built in 1942 — when were the roof, HVAC, electrical panel, plumbing, and water heater last replaced?
- Is there a deadline driving the sale (1031 exchange, divorce, estate, relocation)? That informs how much negotiation room exists.
- Schools are D-rated, which usually means shorter tenancies and higher turnover. Who's the typical renter profile here, and what's been the actual vacancy rate?
- Crime grade is F in this area — have there been break-ins, vandalism, or insurance claims at this property in the last 3 years? What carrier currently insures it and at what premium?
- The area grade is low — what's the realistic commute time and amenity access for the typical tenant pool here? Any planned neighborhood developments (good or bad) we should know about?
- What's the average days-on-market for RENTAL listings here right now (not sales)? A rising rental-DOM trend means longer vacancies and softer asking-rent achievability than the comps imply.
- What's the recent tenant-quality profile in this submarket — average credit score on applications, eviction rate, late-payment / NSF rate, and stable-employment percentage? A property-management company in the area should have these aggregated.
- How much new for-sale + rental construction is in the pipeline within 1–3 miles? Heavy new supply typically softens prices + rents 12–24 months out; constrained supply supports both.
Investment metrics
- 1% rule
- 0.66% ✗
- Cap rate
- 3.31%
- Cash-on-cash
- -10.66%
- DSCR
- 0.53
- GRM
- 12.7
CMA / ARV
No comps found within radius.
Projected returns pro-forma
3.0% appreciation · 3.0% rent growth · sell at horizon
- IRR
- -2.3%
- Equity multiple
- 0.87×
- Total profit
- $-16,788
- Equity at exit
- $201,890
- IRR
- 2.1%
- Equity multiple
- 1.32×
- Total profit
- $40,348
- Equity at exit
- $311,136
Cash invested: $125,720 (down + closing). Projections, not guarantees.
Landlord ↔ Tenant lean methodology
- Overall (CITY)
- 0 Strongly Tenant-Friendly
- State New Jersey
- 21 Tenant-Leaning · D+6
- County
- — inherits STATE
- City Newark
- 0 Strongly Tenant-Friendly · D+59
ZIP-level market 07111-2211
- Active inventory
- 2
- Price-to-rent
- 12.7×
Monthly cashflow live
- Estimated rent
- $2,950 medium interval (Pro) →
- Mortgage (P&I)
- −$2,355
- Tax from tax record
- −$906 /mo · $10,868/yr
- Insurance
- −$187
- HOA
- −$0
- Vacancy / Maint / Mgmt
- −$620
- Net cashflow
- $-1,117
Break-even live
UW: 25.0% down · 7.5% · 30yr · 1.5% tax · 5.0% vac · 8.0% maint · 8.0% mgmt
Financing live
Cash to close
- Down payment
- $112,250
- Closing costs
- $13,470
- Reserves months
- —
- Total cash needed
- —
Loan-product check · same deal, 3 products live
Conventional
25% down · 7.5% · 30yr
- Down + closing
- —
- Monthly P&I
- —
- Monthly cashflow
- —
- DSCR
- —
- Eligible?
- —
Personal DTI + credit; lowest rate.
DSCR
20% down · 8.5% · 30yr
- Down + closing
- —
- Monthly P&I
- —
- Monthly cashflow
- —
- DSCR
- —
- Eligible?
- —
No personal income docs; deal must DSCR.
Hard money
10% down · 12.0% · 12mo
- Down + closing
- —
- Monthly P&I
- —
- Monthly cashflow
- —
- DSCR
- —
- Eligible?
- —
Short-term bridge; refi at stabilization.
Rent comps 1 comps
| Address | Beds | Baths | Sqft | Rent | $/sqft | DOM | Units | Dist |
|---|---|---|---|---|---|---|---|---|
| 808 Clinton Ave Unit G Newark, NJ | 5.0 | 2.0 | 1200 | $2,950 | $2.46 | 20d | 1 | 1.25mi |
Listing history 11 events
-
2026-05-23status Under Contract
-
2026-05-05status Active
-
2026-04-09historical
-
2026-03-24price $449,000
-
2026-02-25$499,000 Active
-
2024-04-12soldstatus $423,000
-
2024-03-21soldstatus $423,000
-
2008-01-18soldstatus $230,000
-
2007-01-11soldstatus $165,000
-
1999-02-18soldstatus $72,500
-
1998-04-03soldstatus $100,000
ⓘ Source: listings_history table (triggers on properties + properties_extension) + one-shot
backfill from property_details.listing_events for pre-trigger history.
Tax reassessment forecast NJ · Partial reset (capped growth)
- Current annual tax
- $10,868 · $906/mo
- Projected year-2 tax
- $11,024 · $919/mo
- Expected delta
- +$156/yr (+$13/mo · 1.4%)
ⓘ Screening estimate from a state-policy table — verify with the county assessor before closing.
Climate risk First Street
- Flood 1/10 Low FEMA zone X (unshaded) · 0% chance over 30 yrs
- Wildfire 1/10 Low
- Heat 7/10 Severe 7 d/yr ≥101°F today · 15 d/yr by 30 yrs out
- Wind 6/10 Major 27% chance of damaging wind over 30 yrs
- Air quality 4/10 Moderate 4 unhealthy d/yr today · 5 by 30 yrs out
Nearby sold comps map
Loading sold comps map…
Walkable amenities ~0.75 mi
Loading nearby amenities…
Taxation est. · year 1
- Rental income
- $35,400
- − Mortgage interest
- −$25,151
- − Property taxes
- −$10,868
- − Insurance
- −$2,245
- − Repairs & maintenance
- −$2,832
- − Management
- −$2,832
- − Depreciation
- −$13,062
- Taxable loss
- −$21,590
- Est. tax savings @ 24.0%
- +$5,182
- After-tax cash flow
- $-8,221/yr
For passive investors: Depreciation is non-cash, so a rental often shows a tax loss while cash-flowing — sheltering income. Rental losses are passive: they offset passive income freely, and up to $25,000/yr can offset ordinary (W-2) income if you actively participate and your MAGI is under $100k (phasing out to $0 by $150k); unused losses carry forward. On sale, claimed depreciation is recaptured at up to 25%, and gains may owe capital-gains tax (a 1031 exchange can defer both). Figures are a year-1 estimate at your 24.0% rate — not tax advice; consult a CPA.
Schools (NCES district)
- District
- Irvington Public School District
- NCES district ID
- 3407680
- Math proficiency
- 4% ▼ -10.00%
- Reading proficiency
- 23% ▼ -4.00%
- Median HH income
- $39,682
- Composite
- 11.46/100
- National rank
- #9705
- State rank
- #465 of 472 in NJ
Livability — Newark
- Score
- 67/100
- State rank
- #343
- US rank
- #11138
Category grades
Schools grade is shown separately in the Schools card above.
Census & demographics
No demographic data for this ZIP.
Market trends
- HPI YoY
- —
- Current HPI
- —
- Rent YoY
- —
- Metro
- —
- State GDP YoY
- ▲ 2.05%
- F500 in state
- 34
Industry mix (Fortune 500 HQ in NJ)
| Industry | F500 HQs | Revenue |
|---|---|---|
| Consumer Goods | 3 | $31B |
|
||
| Pharmaceuticals | 2 | $153B |
|
||
| Technology | 2 | $21B |
|
||
| Insurance | 2 | $20B |
|
||
| Healthcare | 2 | $19B |
|
||
| Financial Services | 1 | $70B |
|
||
Price history
+349.0% since first listed11 events — show timeline
- 2026-05-23 Pending — GSMLS
- 2026-05-05 Relisted — GSMLS
- 2026-04-09 Delisted — GSMLS
- 2026-03-24 Price Changed $449,000 GSMLS
- 2026-02-25 Listed $499,000 GSMLS
- 2024-04-12 Sold (Public Records) $423,000 Public Records
- 2024-03-21 Sold (MLS) $423,000 GSMLS
- 2008-01-18 Sold (Public Records) $230,000 Public Records
- 2007-01-11 Sold (Public Records) $165,000 Public Records
- 1999-02-18 Sold (Public Records) $72,500 Public Records
- 1998-04-03 Sold (Public Records) $100,000 Public Records
Property tax history
+4.8%/yrLatest (2025): $10,868 · +76.8% YoY. Source: county tax records.
Cash-flow waterfall
monthlySold comps — $/sqft
last 12 mo · ≤1 miLoading sold comps…