5711 Sugar Hill Dr #108 · Houston, TX
Flood risk 1/10 · Minimal
- FEMA flood zone
- X (unshaded)
- Chance of flooding over 30 yrs
- 0.0%
- Est. flood insurance / yr
- $507 – $1,088
Fire risk 1/10 · Minimal
- Est. fire insurance / yr
- $1,222 – $2,270
Heat risk 9/10 · Severe
- Hot days now (above 109°F)
- 7 days/yr
- Hot days in 30 yrs
- 24 days/yr
Wind risk 9/10 · Severe
- Chance of severe wind over 30 yrs
- 99.0%
Air-quality risk 3/10 · Minor
- Unhealthy air days now
- 3 days/yr
- Unhealthy air days in 30 yrs
- 3 days/yr
Risk factors via First Street. Map © Google.
Why this score? — see what drove the D- grade
The composite is a weighted blend of 9 inputs, each scored 0–100. Each bar is that input's sub-score; the figure is the points it added to the 100-point composite (weight × sub-score).
- ARV discount +15.0/15.0
- 1% rule +5.6/10.0
- Appreciation +4.4/10.0
- Cash flow +3.8/30.0
- Livability +3.7/5.0
- Schools +2.7/10.0
- Condition / age +2.5/5.0
- Rent growth +2.0/5.0
- DSCR +0.0/10.0
$130,000
🖨 Deal sheet 📄 Offer letter ✓ Due diligence
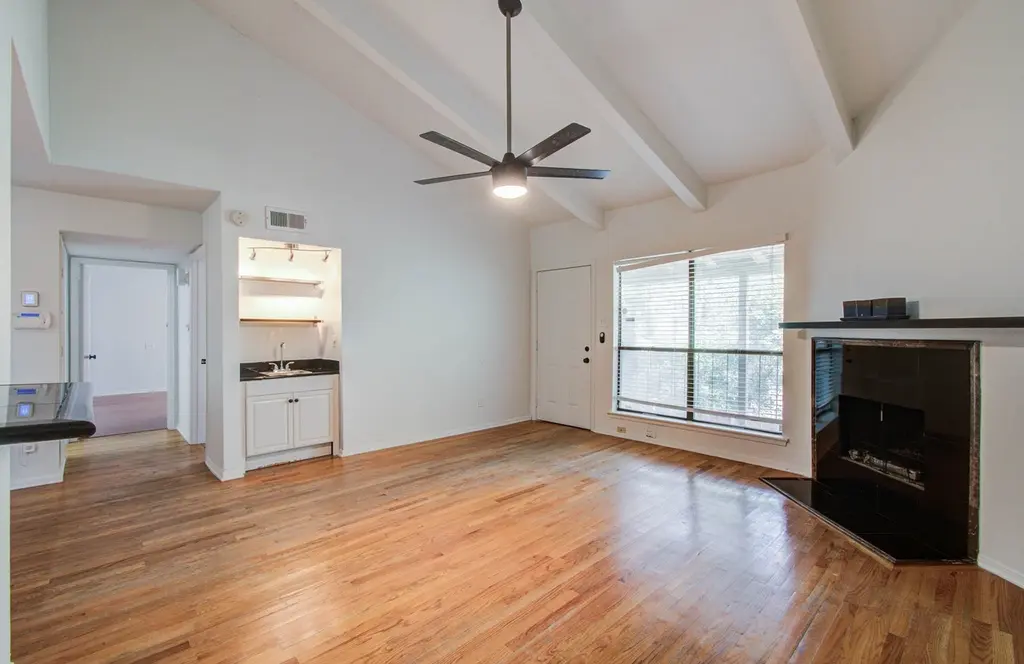
Listing remarks
Investors!! Step into this freshly painted, move-right-in condominium, where every detail has been thoughtfully refreshed for you. The open-concept living area features bright, neutral walls and soaring ceilings that draw the eye upward, amplifying the sense of space and light. Adjacent to the living room is a small wet bar—ideal for casual entertaining—and gleaming black granite countertops anchor the well-appointed kitchen. All major appliances (stainless-steel refrigerator, range, dishwasher, and microwave) are included, ready to make mealtime a breeze. Underfoot, durable ceramic tile in the kitchen flows seamlessly into warm wood-tone floors in the living and sleeping areas
Key facts
- Wet bar
- Ceramic tile
- Wood-tone floors
Tags
Property features AI
Finance
- Financial info: Lease considered
- HOA & community: Association managed by Creative Management; Association fee $495 monthly; Association fee covers common areas, structure maintenance, recreation facilities, sewer, trash and water; Community pool
Exterior
- Parking: Assigned parking
- Security: Gated community; Controlled access
- Utilities: Public water; Public sewer
- Home design: Residential property; One story; Built in 1977; Full ownership; Slab foundation
- Construction: Stucco and wood siding construction
- Exterior features: Storage; Controlled access
Interior
- Kitchen: Electric cooktop; Electric oven; Dishwasher; Microwave; Disposal; Refrigerator; Pantry
- Bedrooms: Total rooms: 5
- Flooring: Tile; Wood
- Bathrooms: 1 full bathroom
- Heating & cooling: Central heating (gas); Central air (electric)
- Interior features: Wet bar; Balcony; Double vanity; Granite counters; High ceilings; Pantry; Soaking tub; Ceiling fan(s); Electric fireplace
- Laundry & utility: Washer; Dryer; Washer/dryer stacked; Laundry in utility room
Neighborhood map
What this means for you Summary
Snapshot
- This is a 2-bed/1.0-bath condo listed at $130k.
Deal economics
- At list price, monthly cash flow is $-373 ($-4k/yr) — negative.
- To cash-flow at today's rent, offer at most $64k (50.7% below list).
- Meets the 1% rule at list price ($1k rent vs $130k).
- Recommended offer: $64k (50.7% below list) — sets the bar for cash-flow.
Location & tenants
- Location reads 74/100 on livability (#184 in TX, #4,771 nationally) — a middle-class / working-renter tenant base. Strengths: amenities A+, cost of living A+, housing A+; Watch: crime F.
- Houston ISD (urban): math 27% / reading 35% proficiency, ranked #593 of 826 in TX (top 72%) — families likely to look elsewhere, expect single-tenant / working-renter base with shorter leases; 71% free/reduced lunch — lower-income household profile, screen leases tightly.
- Zoned schools: Briargrove El (math 33% / reading 42%, grade F, #1,744 of 4,322 statewide, top 41%, 836 students, 56% FRL); Tanglewood Middle (math 29% / reading 42%, grade F, #827 of 1,662 statewide, top 51%, 808 students, 62% FRL); Wisdom H S (math 17% / reading 16%, grade F, #1,497 of 1,632 statewide, top 92%, 2,260 students, 97% FRL) — zoned schools at 71% FRL track the district average.
- Market conditions: Rents soft (-1.8%/yr); 389 active listings in the ZIP; 40 comparable units currently listed for rent nearby; rentals at typical pace (median 24d on market — plan ~3-4 weeks tenant-placement turnaround); 42% of comp listings sitting > 30 days — soft ceiling on asking rent; 29,883 units permitted in Harris County in 2024 (8,621 in 5+ unit buildings).
Forward outlook
- Local home prices are declining (-1.2%/yr); year-one equity from $899 of loan paydown is wiped out by about $2k of value loss. Plan a longer hold.
- Harris County population projected at +47% by 2050 — long-run rental-demand tailwind backs the buy-and-hold thesis.
Negotiation context
- It's been on market 27 days — a 2% lower offer ($128k) is reasonable based on typical stale-listing flexibility.
- 7 sale attempts since 16y ago with the ask held roughly flat each time — persistent listings suggest the price (not the market) is what's stuck; bring a comps-based counter.
- Current owner paid $40k; list at $130k implies a 225% gain — meaningful room to come down on a strong offer.
Risks & watch-outs
- Watch-outs: HOA is 36% of rent.
- Climate carrying-cost: severe wind risk, 99% chance of damaging wind over 30y; extreme-heat days projected 7→24/yr by 2055 (HVAC capex compounding) — expect insurance premiums to compound above CPI over the hold.
Questions for the listing agent
- What do current leases actually rent for vs. the listed asking? Can we see a recent rent roll and the last 12 months of T-12 income?
- Built in 1977 — when were the roof, HVAC, electrical panel, plumbing, and water heater last replaced?
- What does the HOA fee cover, when was the last increase, and are there any pending special assessments or reserve-fund shortfalls?
- Any open or pending special assessments — roof, HVAC, plumbing, elevator, façade? What's the per-unit balance and payoff schedule, and is the seller paying it off at close or rolling it to the buyer?
- Is there a deadline driving the sale (1031 exchange, divorce, estate, relocation)? That informs how much negotiation room exists.
- Schools are D-rated, which usually means shorter tenancies and higher turnover. Who's the typical renter profile here, and what's been the actual vacancy rate?
- Crime grade is F in this area — have there been break-ins, vandalism, or insurance claims at this property in the last 3 years? What carrier currently insures it and at what premium?
- The area grade is low — what's the realistic commute time and amenity access for the typical tenant pool here? Any planned neighborhood developments (good or bad) we should know about?
- What's the average days-on-market for RENTAL listings here right now (not sales)? A rising rental-DOM trend means longer vacancies and softer asking-rent achievability than the comps imply.
- What's the recent tenant-quality profile in this submarket — average credit score on applications, eviction rate, late-payment / NSF rate, and stable-employment percentage? A property-management company in the area should have these aggregated.
- How much new apartment / multifamily construction is in the pipeline within 1–3 miles? Heavy new supply (>2% of stock underway) typically softens rents 12–24 months out; light construction supports rent growth.
Investment metrics
- 1% rule
- 1.06% ✓
- Cap rate
- 2.85%
- Cash-on-cash
- -12.29%
- DSCR
- 0.45
- GRM
- 7.8
CMA / ARV
- ARV (median comp)
- $158,856
- List price
- $130,000
- Delta
- -15.02%
- Verdict
- UNDERPRICED
- Comps
- 20 within 1.0 mi
Projected returns pro-forma
-1.23% appreciation · 0.0% rent growth · sell at horizon
- IRR
- -26.9%
- Equity multiple
- -0.06×
- Total profit
- $-38,578
- Equity at exit
- $29,940
- IRR
- -27.2%
- Equity multiple
- -0.90×
- Total profit
- $-69,133
- Equity at exit
- $30,228
Cash invested: $36,400 (down + closing). Projections, not guarantees.
Landlord ↔ Tenant lean methodology
- Overall (STATE)
- 87 Strongly Landlord-Friendly
- State Texas
- 87 Strongly Landlord-Friendly · R+5
- County
- — inherits STATE
- City
- — inherits STATE
ZIP-level market 77057
- Home prices YoY
- -0.7%
- Rents YoY
- -1.8%
- Active inventory
- 389
- Price-to-rent
- 7.8×
Monthly cashflow live
- Estimated rent
- $1,383 high interval (Pro) →
- Mortgage (P&I)
- −$682
- Tax from tax record
- −$235 /mo · $2,816/yr
- Insurance
- −$54
- HOA
- −$495
- Vacancy / Maint / Mgmt
- −$290
- Net cashflow
- $-373
Break-even live
UW: 25.0% down · 7.5% · 30yr · 1.5% tax · 5.0% vac · 8.0% maint · 8.0% mgmt
Financing live
Cash to close
- Down payment
- $32,500
- Closing costs
- $3,900
- Reserves months
- —
- Total cash needed
- —
Loan-product check · same deal, 3 products live
Conventional
25% down · 7.5% · 30yr
- Down + closing
- —
- Monthly P&I
- —
- Monthly cashflow
- —
- DSCR
- —
- Eligible?
- —
Personal DTI + credit; lowest rate.
DSCR
20% down · 8.5% · 30yr
- Down + closing
- —
- Monthly P&I
- —
- Monthly cashflow
- —
- DSCR
- —
- Eligible?
- —
No personal income docs; deal must DSCR.
Hard money
10% down · 12.0% · 12mo
- Down + closing
- —
- Monthly P&I
- —
- Monthly cashflow
- —
- DSCR
- —
- Eligible?
- —
Short-term bridge; refi at stabilization.
Rent comps 40 comps
| Address | Beds | Baths | Sqft | Rent | $/sqft | DOM | Units | Dist |
|---|---|---|---|---|---|---|---|---|
| 1111 Bering Dr Unit 127 Houston, TX | 1.0 | 1.0 | 812 | $1,008 | $1.24 | 43d | 1 | 0.10mi |
| 1111 Bering Dr Unit 125 Houston, TX | 1.0 | 1.0 | 898 | $1,145 | $1.28 | 43d | 1 | 0.10mi |
| 1111 Bering Dr Unit 1227 Houston, TX | 1.0 | 1.0 | 835 | $1,635 | $1.96 | 43d | 1 | 0.10mi |
| 1000 Chimney Rock Rd Houston, TX | 1.0 | 1.0 | 672 | $1,375 | $2.05 | 24d | 1 | 0.11mi |
| 1100 Bering Dr Houston, TX | 1.0–2.0 | 1.0–2.0 | 828 | $1,505 | $1.82 | 1d | 9 | 0.12mi |
| 1100 Augusta Dr Houston, TX | 1.0–2.0 | 1.0 | 909 | $1,550 | $1.71 | 43d | 3 | 0.27mi |
| 845 Augusta Dr Unit 1471729P Houston, TX | 1.0 | 1.0 | 592 | $4,033 | $6.81 | 1d | 1 | 0.28mi |
| 845 Augusta Dr #44 Houston, TX | 1.0 | 1.0 | 598 | $3,000 | $5.02 | 43d | 1 | 0.28mi |
| 1300 Augusta Dr Unit 1-357 Houston, TX | 1.0 | 1.0 | 832 | $1,102 | $1.32 | 43d | 1 | 0.29mi |
| 1300 Augusta Dr Unit 2-9985 Houston, TX | 1.0 | 1.0 | 898 | $1,225 | $1.36 | 43d | 1 | 0.29mi |
| 1615 Bering Dr Houston, TX | 1.0 | 1.0 | 764 | $1,200 | $1.57 | 43d | 1 | 0.31mi |
| 5740 San Felipe St Houston, TX | 2.0 | 1.0–2.0 | 933 | $2,848 | $3.05 | 1d | 25 | 0.36mi |
| 1300 Bering Dr Houston, TX | 2.0 | 2.0 | 973 | $1,520 | $1.56 | 24d | 1 | 0.42mi |
| 5665 San Felipe St Houston, TX | 1.0 | 1.0 | 1088 | $2,653 | $2.44 | 24d | 1 | 0.44mi |
| 1621 Bering Dr Houston, TX | 1.0 | 1.0 | 725 | $1,125 | $1.55 | 43d | 1 | 0.44mi |
| 651 Bering Dr Unit 2163 Houston, TX | 1.0 | 1.0 | 822 | $1,199 | $1.46 | 43d | 1 | 0.44mi |
| 651 Bering Dr Unit 1717 Houston, TX | 1.0 | 1.0 | 855 | $1,185 | $1.39 | 43d | 1 | 0.44mi |
| 1801 Bering Dr Houston, TX | 1.0–2.0 | 1.0–2.0 | 819 | $1,535 | $1.87 | 1d | 8 | 0.47mi |
| 1617 Fountain View Dr Houston, TX | 1.0 | 1.0 | 640 | $773 | $1.21 | 12d | 1 | 0.49mi |
| 1617 Fountain View Dr Unit 2047 Houston, TX | 2.0 | 2.0 | 893 | $1,335 | $1.49 | 11d | 1 | 0.49mi |
| 1617 Fountain View Dr Unit 2047 Houston, TX | 2.0 | 2.0 | 893 | $1,292 | $1.45 | 18d | 1 | 0.49mi |
| 5800 Woodway Dr Houston, TX | 1.0–2.0 | 1.0–2.0 | 1153 | $1,772 | $1.54 | 10d | 14 | 0.51mi |
| 1617 Fountain View Dr Unit 1638 Houston, TX | 1.0 | 1.0 | 640 | $781 | $1.22 | 2d | 1 | 0.51mi |
| 1617 Fountain View Dr Unit 1638 Houston, TX | 1.0 | 1.0 | 640 | $819 | $1.28 | 13d | 1 | 0.51mi |
| 1617 Fountain View Dr Unit 1668 Houston, TX | 1.0 | 1.0 | 640 | $814 | $1.27 | 43d | 1 | 0.51mi |
| 1617 Fountain View Dr Unit 1674 Houston, TX | 2.0 | 2.0 | 893 | $1,292 | $1.45 | 3d | 1 | 0.51mi |
| 1426 Fountain View Dr Houston, TX | 1.0 | 1.0 | 759 | $1,014 | $1.34 | 43d | 1 | 0.51mi |
| 1819 Augusta Dr Houston, TX | 2.0 | 2.0–2.5 | 1167 | $1,487 | $1.27 | 14d | 5 | 0.59mi |
| 1818 Augusta Dr Houston, TX | 2.0 | 1.0 | 995 | $1,575 | $1.58 | 43d | 1 | 0.61mi |
| 5700 Green Tree Rd Houston, TX | 1.0 | 1.0 | 694 | $1,145 | $1.65 | 12d | 1 | 0.65mi |
| 1901 Augusta Dr Houston, TX | 1.0–2.0 | 1.0–2.0 | 934 | $1,715 | $1.84 | 1d | 14 | 0.67mi |
| 1907 Augusta Dr Houston, TX | 2.0 | 2.0 | 963 | $1,570 | $1.63 | 43d | 1 | 0.70mi |
| 5880 Inwood Dr Unit 2174 Houston, TX | 2.0 | 2.0 | 1071 | $1,712 | $1.60 | 13d | 1 | 0.73mi |
| 5880 Inwood Dr Unit 422 Houston, TX | 2.0 | 2.0 | 1085 | $1,505 | $1.39 | 7d | 1 | 0.73mi |
| 5880 Inwood Dr Unit 5895 Houston, TX | 1.0 | 1.0 | 807 | $1,357 | $1.68 | 13d | 1 | 0.73mi |
| 5880 Inwood Dr Unit 5931 Houston, TX | 1.0 | 1.0 | 647 | $1,102 | $1.70 | 43d | 1 | 0.73mi |
| 5880 Inwood Dr Unit 321 Houston, TX | 1.0 | 1.0 | 647 | $1,132 | $1.75 | 7d | 1 | 0.73mi |
| 5880 Inwood Dr Unit 5903 Houston, TX | 2.0 | 2.0 | 1071 | $1,712 | $1.60 | 12d | 1 | 0.73mi |
| 5880 Inwood Dr Unit 1174 Houston, TX | 1.0 | 1.0 | 807 | $1,352 | $1.68 | 13d | 1 | 0.73mi |
| 5880 Inwood Dr Unit 5917 Houston, TX | 2.0 | 2.0 | 1085 | $1,650 | $1.52 | 43d | 1 | 0.73mi |
HOA detail condo
- Monthly dues
- $495 · $5,940/yr
- Assessments
- None detected in remarks — confirm with the listing agent.
Listing history 30 events
-
2026-06-18days on market $130,000 Active 27 DOM
-
2026-06-17days on market $130,000 Active 26 DOM
-
2026-06-16days on market $130,000 Active 25 DOM
-
2026-06-15days on market $130,000 Active 24 DOM
-
2026-06-13pricedays on market $130,000 Active 22 DOM
-
2026-06-09days on market $135,000 Active 18 DOM
-
2026-06-08days on market $135,000 Active 17 DOM
-
2026-06-07days on market $135,000 Active 16 DOM
-
2026-06-04days on market $135,000 Active 13 DOM
-
2026-06-02days on market $135,000 Active 11 DOM
-
2026-06-01days on market $135,000 Active 10 DOM
-
2026-05-31days on market $135,000 Active 9 DOM
-
2026-03-22$135,000 Active 878-char remark
-
2025-11-04historical
-
2025-10-16historical $1,450
-
2025-09-19$1,450
-
2025-09-02price $135,000
-
2025-07-30price $139,999
-
2025-07-07$148,000 Active
-
2018-08-03soldstatus
-
2012-05-15soldstatus
-
2012-05-11soldstatus
-
2012-04-10historical
-
2011-11-02$79,000
-
2011-04-21historical
-
2010-08-20$79,000
-
2010-08-06historical
-
2010-03-31$97,000
-
1998-08-01soldstatus $40,000
-
1998-07-22soldstatus
ⓘ Source: listings_history table (triggers on properties + properties_extension) + one-shot
backfill from property_details.listing_events for pre-trigger history.
Tax reassessment forecast TX · Resets to sale price
- Current annual tax
- $2,816 · $235/mo
- Projected year-2 tax
- $2,816 · $235/mo
- Expected delta
- $0/yr ($0/mo · 0.0%)
ⓘ Screening estimate from a state-policy table — verify with the county assessor before closing.
Climate risk First Street
- Flood 1/10 Low FEMA zone X (unshaded) · 0% chance over 30 yrs
- Wildfire 1/10 Low
- Heat 9/10 Extreme 7 d/yr ≥109°F today · 24 d/yr by 30 yrs out
- Wind 9/10 Extreme 99% chance of damaging wind over 30 yrs
- Air quality 3/10 Moderate 3 unhealthy d/yr today · 3 by 30 yrs out
Nearby sold comps map
Loading sold comps map…
Walkable amenities ~0.75 mi
Loading nearby amenities…
Taxation est. · year 1
- Rental income
- $16,597
- − Mortgage interest
- −$7,282
- − Property taxes
- −$2,816
- − Insurance
- −$650
- − Repairs & maintenance
- −$1,328
- − Management
- −$1,328
- − HOA
- −$5,940
- − Depreciation
- −$3,782
- Taxable loss
- −$6,528
- Est. tax savings @ 24.0%
- +$1,567
- After-tax cash flow
- $-2,908/yr
For passive investors: Depreciation is non-cash, so a rental often shows a tax loss while cash-flowing — sheltering income. Rental losses are passive: they offset passive income freely, and up to $25,000/yr can offset ordinary (W-2) income if you actively participate and your MAGI is under $100k (phasing out to $0 by $150k); unused losses carry forward. On sale, claimed depreciation is recaptured at up to 25%, and gains may owe capital-gains tax (a 1031 exchange can defer both). Figures are a year-1 estimate at your 24.0% rate — not tax advice; consult a CPA.
Schools (NCES district)
- District
- Houston ISD
- NCES district ID
- 4823640
- Math proficiency
- 27% ▼ -18.00%
- Reading proficiency
- 35% ▼ -6.00%
- Median HH income
- $46,054
- Composite
- 26.63/100
- National rank
- #7173
- State rank
- #593 of 826 in TX
Livability — Houston
- Score
- 74/100
- State rank
- #184
- US rank
- #4771
Category grades
Schools grade is shown separately in the Schools card above.
Census & demographics
- Census place
- Houston, TX
- County
- Harris County · 4,702,590 people
- City population
- 3,226,434
- Metro
- Houston-The Woodlands-Sugar Land, TX
- Population (ZIP)
- 46,569
- Household income
- $66,971
- Rent vs Own
- Severe rent burden
- 3533.0
Population outlook (Harris County) Hauer SSP2
- Today (2025)
- 5,571,493 people
- By 2030
- 6,089,821 · +9.3%
- By 2040
- 7,142,806 · +28.2%
- By 2050
- 8,185,864 · +46.9%
- By 2075
- 10,574,329 · +89.8%
- By 2100
- 12,109,958 · +117.4%
Race, ethnicity, and origin ACS 2023
- Neighborhood character
- Diverse neighborhood (Simpson 0.69)
- Race & ethnicity
- Hispanic / Latino 38% White 37% Two or more races 22% Black 12% Asian 10% Native American 1%
- Hispanic origin (detail)
- Mexican 13% Cuban 1%
- Common ancestry
- Italian 3% Lithuanian 2% Slovak 1%
- Foreign-born
- 38% · Canada, China, Jamaica
- Languages at home
- 50% English-only · Spanish 33% Other Indo-European 6% Other Asian/Pacific 3%
Political lean MEDSL · Harris
- 2024 margin
- Lean D (+5.5) · D 52.0% · R 46.4% · Other 1.6%
- 2008→2024 swing
- +3.9pp toward D · 2008: 1.6pp · 2024: 5.5pp
- All cycles
- 2024: D+5.5 2020: D+13.3 2016: D+12.4 2012: D+0.1 2008: D+1.6
Not yet ingested
- Civics
- —
Market trends
- HPI YoY
- ▼ -1.23%
- Current HPI
- 167.8863
- Rent YoY
- ▼ -1.83%
- Metro
- Houston-The Woodlands-Sugar Land, TX
- State GDP YoY
- ▲ 3.95%
- F500 in state
- 110
Industry mix (Fortune 500 HQ in TX)
| Industry | F500 HQs | Revenue |
|---|---|---|
| Energy | 16 | $1,198B |
|
||
| Technology | 5 | $198B |
|
||
| Engineering / Construction | 4 | $72B |
|
||
| Energy Services | 3 | $60B |
|
||
| Utilities | 3 | $41B |
|
||
| Healthcare | 2 | $330B |
|
||
Price history
+225.0% since first listed21 events — show timeline
- 2026-06-12 Price Changed $130,000 HARMLS
- 2026-05-22 Listed $135,000 HARMLS
- 2026-05-21 Listing Removed — HARMLS
- 2026-03-22 Listed $135,000 HARMLS
- 2025-11-04 Listing Removed — HARMLS
- 2025-10-16 Rental Removed $1,450 HARMLS
- 2025-09-19 Listed for Rent $1,450 HARMLS
- 2025-09-02 Price Changed $135,000 HARMLS
- 2025-07-30 Price Changed $139,999 HARMLS
- 2025-07-07 Listed $148,000 HARMLS
- 2018-08-03 Sold (Public Records) — Public Records
- 2012-05-15 Sold (Public Records) — Public Records
- 2012-05-11 Sold (MLS) — HARMLS
- 2012-04-10 Listing Removed — HARMLS
- 2011-11-02 Listed $79,000 HARMLS
- 2011-04-21 Listing Removed — HARMLS
- 2010-08-20 Listed $79,000 HARMLS
- 2010-08-06 Listing Removed — HARMLS
- 2010-03-31 Listed $97,000 HARMLS
- 1998-08-01 Sold (Public Records) $40,000 Public Records
- 1998-07-22 Sold (Public Records) — Public Records
Property tax history
+4.4%/yrLatest (2025): $2,816 · -5.7% YoY. Source: county tax records.
Cash-flow waterfall
monthlySold comps — $/sqft
last 12 mo · ≤1 miLoading sold comps…