11395 N 1760 Rd · Sayre, OK
Flood risk 1/10 · Minimal
- FEMA flood zone
- X
- Chance of flooding over 30 yrs
- 0.0%
- Est. flood insurance / yr
- $507 – $1,088
Fire risk 7/10 · Major
- Est. fire insurance / yr
- $2,463 – $4,575
Heat risk 6/10 · Moderate
- Hot days now (above 104°F)
- 7 days/yr
- Hot days in 30 yrs
- 20 days/yr
Wind risk 2/10 · Minimal
- Chance of severe wind over 30 yrs
- 2.0%
Air-quality risk 1/10 · Minimal
- Unhealthy air days now
- 0 days/yr
- Unhealthy air days in 30 yrs
- 0 days/yr
Risk factors via First Street. Map © Google.
Why this score? — see what drove the B+ grade
The composite is a weighted blend of 9 inputs, each scored 0–100. Each bar is that input's sub-score; the figure is the points it added to the 100-point composite (weight × sub-score).
- Cash flow +30.0/30.0
- 1% rule +10.0/10.0
- DSCR +10.0/10.0
- Appreciation +8.2/10.0
- ARV discount +7.5/15.0
- Schools +3.1/10.0
- Livability +2.9/5.0
- Rent growth +2.5/5.0
- Condition / age +2.5/5.0
$55,000
🖨 Deal sheet 📄 Offer letter ✓ Due diligence
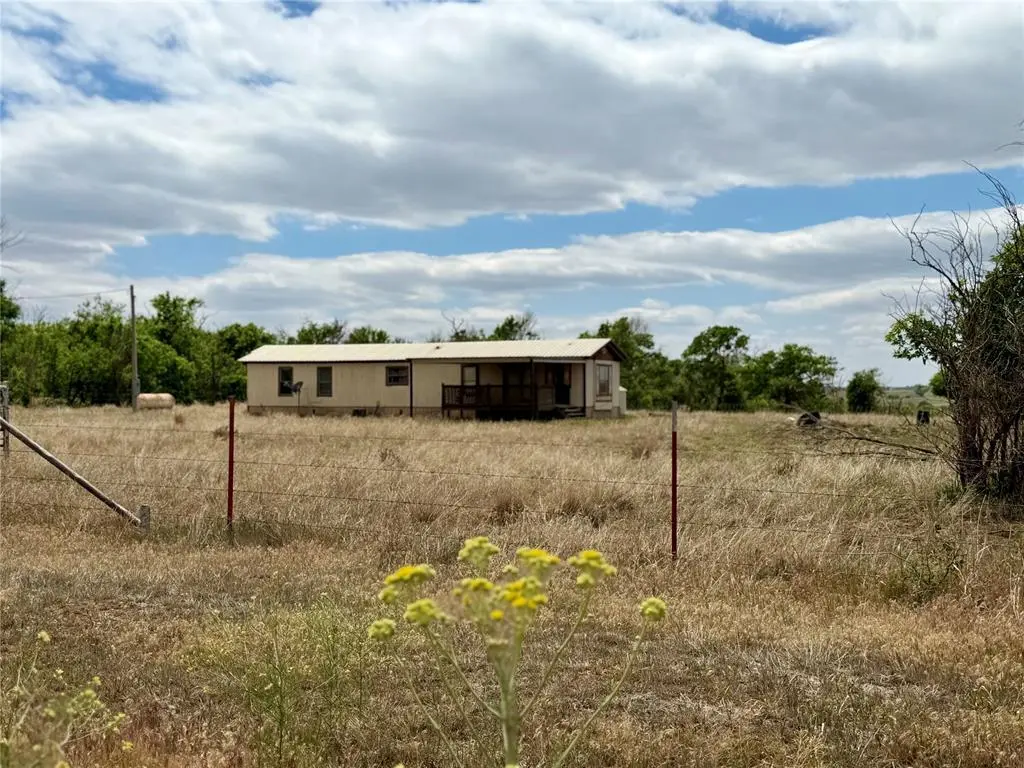
Listing remarks
This property is out in the country and located in a picturesque setting. It is a diamond in the rough. Close to Buffalo Creek and Sweetwater. It is a sought after hunting location and would make a great hunting cabin or home for that first time buyer. It has hardwood flooring, an open floor plan but needs some TLC. The large front deck is covered with a metal roof and a great place to sit and watch the sunrise. The house has a metal roof. To the west are beautiful views of the country side. This home sets on 2.5 acres and is fenced and cross fenced. Great for livestock to the north. There is a well included. Also rural water is not too far away.
Key facts
- Metal roof
- 2.5 acres
- Large front deck
Tags
Property features AI
Finance
- Other: 2.5-acre lot (approximate dimensions 399 x 186)
- Financial info: Loan qualification available; Not assumable
- HOA & community: No mandatory association dues
Exterior
- Home design: Single-family residence; Manufactured construction; One-story; Property moves to site (move-in-place/model status not a model home)
- Construction: Metal roof; Built as a manufactured home
- Exterior features: Rural setting; Metal fencing; No additional exterior features listed
Interior
- Bedrooms: 2 bedrooms
- Bathrooms: 2 full bathrooms
- Heating & cooling: Electric heating
- Interior features: One living area; No fireplace; Combination foundation
Neighborhood map
What this means for you Summary
Snapshot
- This is a 2-bed/2.0-bath manufactured listed at $55k.
Deal economics
- At list price, monthly cash flow is $441 ($5k/yr) — positive.
- The deal already cash-flows at list — no discount required.
- Meets the 1% rule at list price ($983 rent vs $55k).
- Recommended offer: $53k (3.0% below list) — sets the bar for market timing.
Location & tenants
- Location reads 58/100 on livability (#444 in OK) — a working-class tenant base; expect higher turnover. Strengths: crime A+, cost of living A+; Watch: amenities F, commute F, employment F.
- Sweetwater (rural): math 35% / reading 30% proficiency, ranked #211 of 513 in OK (top 41%) — families likely to look elsewhere, expect single-tenant / working-renter base with shorter leases; 62% free/reduced lunch — lower-income household profile, screen leases tightly.
- Zoned schools: Sweetwater Es (math 24% / reading 24%, grade F, #354 of 845 statewide, top 47%, 85 students, 0% FRL); Sweetwater Hs (math 24% / reading 24%, grade F, #150 of 447 statewide, top 48%, 37 students, 0% FRL) — zoned schools average 0% FRL vs 62% district-wide (62 pts lower); this property's tenant base skews higher-income than the district average.
- Market conditions: 6 active listings in the ZIP; 16 units permitted in Beckham County in 2024 (0 in 5+ unit buildings).
Forward outlook
- In year one you build about $4k of equity ($380 loan paydown + $4k appreciation (6.5% local appreciation)).
- Beckham County population projected at +35% by 2050 — long-run rental-demand tailwind backs the buy-and-hold thesis.
- At projected returns (6.5% appreciation + 3.0% rent growth), your $15k cash investment doubles in ~2 years — after that, you're playing with house money.
- By year 8, paydown + projected appreciation supports a ~$31k cash-out refi (75% LTV) — recoverable capital for the next deal without selling this one.
Negotiation context
- It's been on market 41 days — a 3% lower offer ($53k) is reasonable based on typical stale-listing flexibility.
Risks & watch-outs
- Climate carrying-cost: major wildfire risk; extreme-heat days projected 7→20/yr by 2055 (HVAC capex compounding) — expect insurance premiums to compound above CPI over the hold.
Questions for the listing agent
- It's been on market 41 days. Have you received any prior offers? Is the seller open to a 3% concession, seller financing, or rate buy-down credit?
- Is there a deadline driving the sale (1031 exchange, divorce, estate, relocation)? That informs how much negotiation room exists.
- Schools are F-rated, which usually means shorter tenancies and higher turnover. Who's the typical renter profile here, and what's been the actual vacancy rate?
- What's the average days-on-market for RENTAL listings here right now (not sales)? A rising rental-DOM trend means longer vacancies and softer asking-rent achievability than the comps imply.
- What's the recent tenant-quality profile in this submarket — average credit score on applications, eviction rate, late-payment / NSF rate, and stable-employment percentage? A property-management company in the area should have these aggregated.
- How much new for-sale + rental construction is in the pipeline within 1–3 miles? Heavy new supply typically softens prices + rents 12–24 months out; constrained supply supports both.
Investment metrics
- 1% rule
- 1.79% ✓
- Cap rate
- 15.92%
- Cash-on-cash
- 34.37%
- DSCR
- 2.53
- GRM
- 4.7
CMA / ARV
No comps found within radius.
Projected returns pro-forma
6.47% appreciation · 3.0% rent growth · sell at horizon
- IRR
- 45.4%
- Equity multiple
- 3.96×
- Total profit
- $45,521
- Equity at exit
- $36,234
- IRR
- 42.0%
- Equity multiple
- 8.24×
- Total profit
- $111,508
- Equity at exit
- $67,190
Cash invested: $15,400 (down + closing). Projections, not guarantees.
Landlord ↔ Tenant lean methodology
- Overall (STATE)
- 83 Strongly Landlord-Friendly
- State Oklahoma
- 83 Strongly Landlord-Friendly · R+20
- County
- — inherits STATE
- City
- — inherits STATE
ZIP-level market 73662
- Home prices YoY
- 4.8%
- Active inventory
- 6
- Price-to-rent
- 4.7×
Monthly cashflow live
- Estimated rent
- $983 medium interval (Pro) →
- Mortgage (P&I)
- −$288
- Tax from tax record
- −$24 /mo · $294/yr
- Insurance
- −$23
- HOA
- −$0
- Vacancy / Maint / Mgmt
- −$207
- Net cashflow
- $441
Break-even live
UW: 25.0% down · 7.5% · 30yr · 1.5% tax · 5.0% vac · 8.0% maint · 8.0% mgmt
Financing live
Cash to close
- Down payment
- $13,750
- Closing costs
- $1,650
- Reserves months
- —
- Total cash needed
- —
Loan-product check · same deal, 3 products live
Conventional
25% down · 7.5% · 30yr
- Down + closing
- —
- Monthly P&I
- —
- Monthly cashflow
- —
- DSCR
- —
- Eligible?
- —
Personal DTI + credit; lowest rate.
DSCR
20% down · 8.5% · 30yr
- Down + closing
- —
- Monthly P&I
- —
- Monthly cashflow
- —
- DSCR
- —
- Eligible?
- —
No personal income docs; deal must DSCR.
Hard money
10% down · 12.0% · 12mo
- Down + closing
- —
- Monthly P&I
- —
- Monthly cashflow
- —
- DSCR
- —
- Eligible?
- —
Short-term bridge; refi at stabilization.
Listing history 15 events
-
2026-06-18days on market $55,000 Active 41 DOM
-
2026-06-17days on market $55,000 Active 40 DOM
-
2026-06-16days on market $55,000 Active 39 DOM
-
2026-06-15days on market $55,000 Active 38 DOM
-
2026-06-13days on market $55,000 Active 36 DOM
-
2026-06-12days on market $55,000 Active 35 DOM
-
2026-06-09days on market $55,000 Active 32 DOM
-
2026-06-08days on market $55,000 Active 31 DOM
-
2026-06-08days on market $55,000 Active 30 DOM
-
2026-06-05days on market $55,000 Active 28 DOM
-
2026-06-04days on market $55,000 Active 26 DOM
-
2026-06-02days on market $55,000 Active 25 DOM
-
2026-06-01days on market $55,000 Active 24 DOM
-
2026-05-31days on market $55,000 Active 23 DOM
-
2026-05-08$55,000 Active
ⓘ Source: listings_history table (triggers on properties + properties_extension) + one-shot
backfill from property_details.listing_events for pre-trigger history.
Tax reassessment forecast OK · Resets to sale price
- Current annual tax
- $294 · $24/mo
- Projected year-2 tax
- $495 · $41/mo
- Expected delta
- +$201/yr (+$17/mo · 68.4%)
ⓘ Screening estimate from a state-policy table — verify with the county assessor before closing.
Climate risk First Street
- Flood 1/10 Low FEMA zone X · 0% chance over 30 yrs
- Wildfire 7/10 Severe
- Heat 6/10 Major 7 d/yr ≥104°F today · 20 d/yr by 30 yrs out
- Wind 2/10 Low 2% chance of damaging wind over 30 yrs
- Air quality 1/10 Low 0 unhealthy d/yr today · 0 by 30 yrs out
Nearby sold comps map
Loading sold comps map…
Walkable amenities ~0.75 mi
Loading nearby amenities…
Taxation est. · year 1
- Rental income
- $11,802
- − Mortgage interest
- −$3,081
- − Property taxes
- −$294
- − Insurance
- −$275
- − Repairs & maintenance
- −$944
- − Management
- −$944
- − Depreciation
- −$1,600
- Taxable income
- $4,664
- Est. tax owed @ 24.0%
- −$1,119
- After-tax cash flow
- $4,174/yr
For passive investors: Depreciation is non-cash, so a rental often shows a tax loss while cash-flowing — sheltering income. Rental losses are passive: they offset passive income freely, and up to $25,000/yr can offset ordinary (W-2) income if you actively participate and your MAGI is under $100k (phasing out to $0 by $150k); unused losses carry forward. On sale, claimed depreciation is recaptured at up to 25%, and gains may owe capital-gains tax (a 1031 exchange can defer both). Figures are a year-1 estimate at your 24.0% rate — not tax advice; consult a CPA.
Schools (NCES district)
- District
- Sweetwater
- NCES district ID
- 4029310
- Math proficiency
- 35% ▼ -5.00%
- Reading proficiency
- 30% ▬ 0.00%
- Median HH income
- $47,880
- Composite
- 30.81/100
- National rank
- #11382
- State rank
- #211 of 513 in OK
Livability — Sayre
- Score
- 58/100
- State rank
- #444
- US rank
- #21299
Category grades
Schools grade is shown separately in the Schools card above.
Census & demographics
- Population (ZIP)
- 7,031
Population outlook (Beckham County) Hauer SSP2
- Today (2025)
- 26,564 people
- By 2030
- 28,217 · +6.2%
- By 2040
- 31,865 · +20.0%
- By 2050
- 35,862 · +35.0%
- By 2075
- 47,189 · +77.6%
- By 2100
- 55,622 · +109.4%
Race, ethnicity, and origin ACS 2023
- Neighborhood character
- Predominantly White (65%)
- Race & ethnicity
- White 65% Black 13% Hispanic / Latino 11% Two or more races 10% Native American 4%
- Hispanic origin (detail)
- Mexican 7%
- Common ancestry
- Slovak 2% Lithuanian 1% Iranian 1%
- Foreign-born
- 1% · Canada
- Languages at home
- 94% English-only · Spanish 5%
Political lean MEDSL · Beckham
- 2024 margin
- Solid R (+70.1) · D 14.2% · R 84.3% · Other 1.4%
- 2008→2024 swing
- -14.0pp toward R · 2008: -56.1pp · 2024: -70.1pp
- All cycles
- 2024: R+70.1 2020: R+72.0 2016: R+70.8 2012: R+59.1 2008: R+56.1
Not yet ingested
- Civics
- —
Market trends
- HPI YoY
- ▲ 6.47%
- Current HPI
- 141.807
- Rent YoY
- —
- Metro
- —
- State GDP YoY
- ▲ 1.55%
- F500 in state
- 6
Industry mix (Fortune 500 HQ in OK)
| Industry | F500 HQs | Revenue |
|---|---|---|
| Energy | 3 | $48B |
|
||
Price history
1 event — show timeline
- 2026-05-08 Listed $55,000 MLSOK
Property tax history
+11.3%/yrLatest (2025): $294 · -2.0% YoY. Source: county tax records.
Cash-flow waterfall
monthlySold comps — $/sqft
last 12 mo · ≤1 miLoading sold comps…