1360 5th Ave N · Naples, FL
Flood risk 9/10 · Severe
- FEMA flood zone
- AE
- Chance of flooding over 30 yrs
- 0.99%
- Est. flood insurance / yr
- $1,737 – $8,500
Fire risk 1/10 · Minimal
- Est. fire insurance / yr
- $947 – $1,759
Heat risk 10/10 · Severe
- Hot days now (above 107°F)
- 7 days/yr
- Hot days in 30 yrs
- 27 days/yr
Wind risk 10/10 · Severe
- Chance of severe wind over 30 yrs
- 99.0%
Air-quality risk 2/10 · Minimal
- Unhealthy air days now
- 2 days/yr
- Unhealthy air days in 30 yrs
- 2 days/yr
Risk factors via First Street. Map © Google.
Why this score? — see what drove the B- grade
The composite is a weighted blend of 9 inputs, each scored 0–100. Each bar is that input's sub-score; the figure is the points it added to the 100-point composite (weight × sub-score).
- Cash flow +23.2/30.0
- DSCR +7.5/10.0
- ARV discount +7.5/15.0
- Appreciation +7.0/10.0
- 1% rule +6.0/10.0
- Schools +5.0/10.0
- Rent growth +4.7/5.0
- Livability +4.0/5.0
- Condition / age +2.5/5.0
$599,000
🖨 Deal sheet 📄 Offer letter ✓ Due diligence
Listing remarks
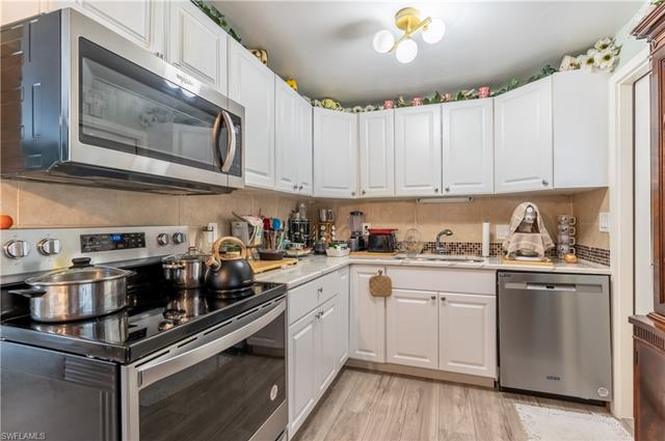
Waterfront !! Experience relaxed waterfront living at 1360 5th Ave N, a fully renovated and furnished single-family home set along a serene canal with direct access to the Gordon River and the Gulf of Mexico. This three-bedroom, one-bath residence combines modern interior finishes with an enviable Naples location close to downtown, beaches, shopping, and dining. NO HOA FEE HERE !! The home’s interior renovation features luxury vinyl plank flooring, a bright and open living area, and a beautifully updated kitchen appointed with quartz countertops, a stylish tile backsplash, and stainless steel appliances. The three well-sized bedrooms provide versatility for guests, a home office, o
Key facts
- Updated kitchen
- Renovated interior
- Waterfront
Tags
Property features AI
Finance
- Other: Single unit, single floor building
- Financial info: Property has gulf access via nearby bridges (Gulf access); Canal width approximately 121–150 ft
- HOA & community: No HOA maintenance fees; Community amenities include internet access, sidewalks, and streetlights; Community type: see remarks
Exterior
- Parking: Attached carport (1 space)
- Security: Impact resistant doors and windows
- Utilities: Central water; Central sewer; Cable available
- Home design: Residential single-family home; 1 story (Ranch); Rear exposure to the south; Built in 1963; Concrete block construction; Located in River Park development
- Construction: Concrete block construction; Built in 1963; Shingle roof; Stucco finish
- Exterior features: Stucco exterior; Shingle roof; Single-hung windows; Impact resistant doors and windows; Shutters; Canal view; Canal waterfront; Irrigation: Central; Regular lot
Interior
- Kitchen: Dishwasher; Microwave; Range; Self-cleaning oven; Refrigerator/Icemaker
- Bedrooms: 3 bedrooms
- Flooring: Vinyl
- Bathrooms: 1 full bathroom; No master bathroom
- Heating & cooling: Central electric heat; Central electric air conditioning; Ceiling fans
- Interior features: Cable prewire; High-speed internet available; Eat-in kitchen; Furnished
- Laundry & utility: Washer; Dryer; Central laundry/utility service
Neighborhood map
What this means for you Summary
Snapshot
- This is a 3-bed/1.0-bath single-family listed at $599k.
Deal economics
- At list price, monthly cash flow is $660 ($8k/yr) — positive.
- The deal already cash-flows at list — no discount required.
- Meets the 1% rule at list price ($7k rent vs $599k).
- Recommended offer: $527k (12.0% below list) — sets the bar for market timing.
Location & tenants
- Location reads 80/100 on livability (#126 in FL, #1,903 nationally) — a professional / high-income tenant draw. Strengths: crime A+, amenities A+, employment A+; Watch: commute D+, cost of living F.
- Collier (suburban): math 60% / reading 56% proficiency, ranked #16 of 73 in FL (top 22%) — acceptable for families but not a draw, mixed tenant base, ~2y average lease.
- Zoned schools: Lake Park Elementary School (math 76% / reading 77%, grade A, #185 of 2,144 statewide, top 9%, 502 students, 39% FRL); Naples High School (math 47% / reading 52%, grade D, #179 of 667 statewide, top 29%, 1,719 students, 39% FRL) — zoned schools average 39% FRL vs 55% district-wide (16 pts lower); this property's tenant base skews higher-income than the district average.
- Market conditions: Rents rising fast (+8.8%/yr); 614 active listings in the ZIP; 38 comparable units currently listed for rent nearby; rentals at typical pace (median 24d on market — plan ~3-4 weeks tenant-placement turnaround); high-income renter base; 3,520 units permitted in Collier County in 2024 (959 in 5+ unit buildings).
- At $6,615/mo this rent would consume 61% of the median local household income ($131k/yr) (locally 333% of renters already pay >50% of income on rent) — very limited rent-growth headroom before tenants either downsize or default.
Forward outlook
- In year one you build about $29k of equity ($4k loan paydown + $24k appreciation (4.1% local appreciation)).
- Collier County population projected at +30% by 2050 — long-run rental-demand tailwind backs the buy-and-hold thesis.
- At projected returns (4.1% appreciation + 8.0% rent growth), your $168k cash investment doubles in ~4 years — after that, you're playing with house money.
- By year 2, paydown + projected appreciation supports a ~$46k cash-out refi (75% LTV) — recoverable capital for the next deal without selling this one.
Negotiation context
- It's been on market 146 days — a 12% lower offer ($527k) is reasonable based on typical stale-listing flexibility.
- Current owner paid $62k; list at $599k implies a 866% gain — meaningful room to come down on a strong offer.
Risks & watch-outs
- Watch-outs: flood insurance adds $427/mo.
- Climate carrying-cost: in FEMA flood zone AE (mandatory federal flood insurance); severe wind risk, 99% chance of damaging wind over 30y; extreme-heat days projected 7→27/yr by 2055 (HVAC capex compounding) — expect insurance premiums to compound above CPI over the hold.
Questions for the listing agent
- It's been on market 146 days. Have you received any prior offers? Is the seller open to a 12% concession, seller financing, or rate buy-down credit?
- Built in 1963 — when were the roof, HVAC, electrical panel, plumbing, and water heater last replaced?
- What's the actual annual flood-insurance premium (NFIP or private), and is the property in a SFHA with mandatory coverage?
- Why hasn't it sold? Are there any deal-killer items the seller is aware of (foundation, flood, title, zoning, code violations)?
- Is there a deadline driving the sale (1031 exchange, divorce, estate, relocation)? That informs how much negotiation room exists.
- Schools are B-rated — typically a magnet for longer-tenancy family renters. What's the average tenant stay here, and is there a school-zone premium baked into asking?
- What's the average days-on-market for RENTAL listings here right now (not sales)? A rising rental-DOM trend means longer vacancies and softer asking-rent achievability than the comps imply.
- What's the recent tenant-quality profile in this submarket — average credit score on applications, eviction rate, late-payment / NSF rate, and stable-employment percentage? A property-management company in the area should have these aggregated.
- How much new for-sale + rental construction is in the pipeline within 1–3 miles? Heavy new supply typically softens prices + rents 12–24 months out; constrained supply supports both.
Investment metrics
- 1% rule
- 1.10% ✓
- Cap rate
- 8.47%
- Cash-on-cash
- 7.77%
- DSCR
- 1.35
- GRM
- 7.5
CMA / ARV
No comps found within radius.
Projected returns pro-forma
4.08% appreciation · 8.0% rent growth · sell at horizon
- IRR
- 17.7%
- Equity multiple
- 2.10×
- Total profit
- $184,562
- Equity at exit
- $306,630
- IRR
- 20.9%
- Equity multiple
- 4.71×
- Total profit
- $622,485
- Equity at exit
- $503,867
Cash invested: $167,720 (down + closing). Projections, not guarantees.
Landlord ↔ Tenant lean methodology
- Overall (STATE)
- 87 Strongly Landlord-Friendly
- State Florida
- 87 Strongly Landlord-Friendly · R+3
- County
- — inherits STATE
- City
- — inherits STATE
ZIP-level market 34102
- Home prices YoY
- 1.3%
- Rents YoY
- 8.8%
- Active inventory
- 614
- Price-to-rent
- 7.5×
Monthly cashflow live
- Estimated rent
- $6,615 medium interval (Pro) →
- Mortgage (P&I)
- −$3,141
- Tax est. 1.5%
- −$749 /mo · $8,985/yr
- Insurance
- −$250
- Flood insurance flood zone
- −$427 /mo · $5,118/yr
- HOA
- −$0
- Vacancy / Maint / Mgmt
- −$1,389
- Net cashflow
- $660
Break-even live
UW: 25.0% down · 7.5% · 30yr · 1.5% tax · 5.0% vac · 8.0% maint · 8.0% mgmt
Financing live
Cash to close
- Down payment
- $149,750
- Closing costs
- $17,970
- Reserves months
- —
- Total cash needed
- —
Loan-product check · same deal, 3 products live
Conventional
25% down · 7.5% · 30yr
- Down + closing
- —
- Monthly P&I
- —
- Monthly cashflow
- —
- DSCR
- —
- Eligible?
- —
Personal DTI + credit; lowest rate.
DSCR
20% down · 8.5% · 30yr
- Down + closing
- —
- Monthly P&I
- —
- Monthly cashflow
- —
- DSCR
- —
- Eligible?
- —
No personal income docs; deal must DSCR.
Hard money
10% down · 12.0% · 12mo
- Down + closing
- —
- Monthly P&I
- —
- Monthly cashflow
- —
- DSCR
- —
- Eligible?
- —
Short-term bridge; refi at stabilization.
Rent comps 38 comps
| Address | Beds | Baths | Sqft | Rent | $/sqft | DOM | Units | Dist |
|---|---|---|---|---|---|---|---|---|
| 410 Bayfront Pl Naples, FL | 1.0–3.0 | 1.0–2.0 | 1242 | $9,750 | $7.85 | 23d | 6 | 0.63mi |
| 450 Bayfront Pl Naples, FL | 1.0–3.0 | 1.0–2.5 | 1324 | $12,000 | $9.06 | 23d | 6 | 0.66mi |
| 766 Central Ave Naples, FL | 2.0–3.0 | 2.0 | 943 | $6,500 | $6.89 | 13d | 4 | 0.72mi |
| 766 Central Ave Naples, FL | 2.0–3.0 | 2.0 | 855 | $6,500 | $7.60 | 21d | 3 | 0.72mi |
| 1100 8th Ave S Naples, FL | 2.0 | 2.0 | 1218 | $9,000 | $7.39 | 13d | 5 | 0.98mi |
| 1395 Curlew Ave Unit 4-3 Naples, FL | 2.0 | 2.0 | 975 | $7,000 | $7.18 | 23d | 1 | 1.04mi |
| 1435 Curlew Ave #1 Naples, FL | 2.0 | 2.0 | 975 | $2,850 | $2.92 | 23d | 1 | 1.04mi |
| 1435 Curlew Ave #1 Naples, FL | 2.0 | 2.0 | 975 | $2,850 | $2.92 | 21d | 1 | 1.04mi |
| 286 4th St S #203 Naples, FL | 2.0 | 2.0 | 1058 | $10,000 | $9.45 | 23d | 1 | 1.10mi |
| 290 4th St S #202 Naples, FL | 2.0 | 2.0 | 1058 | $10,000 | $9.45 | 23d | 1 | 1.10mi |
| 282 4th St S Naples, FL | 2.0 | 2.0 | 1058 | $11,000 | $10.40 | 23d | 1 | 1.10mi |
| 284 4th St S #103 Naples, FL | 2.0 | 2.0 | 979 | $9,000 | $9.19 | 23d | 1 | 1.10mi |
| 1950 Mayfair St Naples, FL | 3.0 | 1.0–3.5 | 1514 | $11,999 | $7.92 | 13d | 109 | 1.16mi |
| 388 4th Ave S #388 Naples, FL | 2.0 | 2.0 | 965 | $13,000 | $13.47 | 23d | 1 | 1.16mi |
| 1950 Mayfair ST Unit 901 Naples, FL | 2.0 | 2.0 | 1025 | $4,560 | $4.45 | 13d | 1 | 1.18mi |
| 365 5th Ave S #303 Naples, FL | 2.0 | 2.0 | 1090 | $13,000 | $11.93 | 23d | 1 | 1.20mi |
| 296 4th Ave S #296 Naples, FL | 2.0 | 2.5 | 1120 | $2,950 | $2.63 | 21d | 1 | 1.23mi |
| 230 3rd Ave S #4 Naples, FL | 2.0 | 2.5 | 978 | $12,000 | $12.27 | 23d | 1 | 1.24mi |
| 1334 Crayton Rd #1 Naples, FL | 2.0 | 2.0 | 1100 | $6,800 | $6.18 | 23d | 1 | 1.29mi |
| 1155 Sandpiper St Naples, FL | 2.0 | 2.0 | 1062 | $4,050 | $3.81 | 23d | 2 | 1.33mi |
| 1155 Sandpiper St Naples, FL | 2.0 | 2.0 | 1062 | $3,950 | $3.72 | 21d | 3 | 1.33mi |
| 175 5th Ave S Naples, FL | 2.0 | 2.0 | 732 | $14,000 | $19.13 | 23d | 2 | 1.33mi |
| 351 8th Ave S #351 Naples, FL | 2.0 | 2.0 | 930 | $4,000 | $4.30 | 23d | 1 | 1.33mi |
| 1100 Gulf Shore Blvd N Naples, FL | 2.0 | 2.0 | 945 | $6,000 | $6.35 | 23d | 2 | 1.34mi |
| 666 3rd St S Naples, FL | 1.0–2.0 | 1.0–2.0 | 932 | $8,000 | $8.58 | 13d | 2 | 1.35mi |
| 1555 Blue Point Ave Unit 3 Naples, FL | 2.0 | 2.0 | 1025 | $1,745 | $1.70 | 13d | 1 | 1.35mi |
| 250 7th Ave S #301 Naples, FL | 2.0 | 2.0 | 1000 | $10,000 | $10.00 | 23d | 1 | 1.37mi |
| 1686 Blue Point Ave Naples, FL | 2.0 | 2.0 | 1057 | $5,500 | $5.20 | 13d | 2 | 1.41mi |
| 1751 Smugglers Cv Unit 2 1 Naples, FL | 2.0 | 1.0 | 800 | $1,995 | $2.49 | 13d | 1 | 1.41mi |
| 1300 Gulf Shore Blvd N #406 Naples, FL | 2.0 | 2.0 | 850 | $6,500 | $7.65 | 23d | 1 | 1.41mi |
| 1300 Gulf Shore Blvd N #304 Naples, FL | 2.0 | 2.0 | 850 | $5,500 | $6.47 | 23d | 1 | 1.41mi |
| 1300 Gulf Shore Blvd N #205 Naples, FL | 2.0 | 2.0 | 850 | $5,900 | $6.94 | 23d | 1 | 1.41mi |
| 1300 Gulf Shore Blvd N #700 Naples, FL | 2.0 | 2.0 | 850 | $6,250 | $7.35 | 23d | 1 | 1.41mi |
| 1535 Chesapeake Ave Unit A2 Naples, FL | 2.0 | 2.0 | 1080 | $2,000 | $1.85 | 23d | 1 | 1.43mi |
| 1605 Chesapeake Ave #2 Naples, FL | 2.0 | 1.0 | 850 | $2,300 | $2.71 | 23d | 1 | 1.44mi |
| 636 Broad Ave S Unit 1259386P Naples, FL | 2.0 | 2.0 | 882 | $4,307 | $4.88 | 13d | 1 | 1.47mi |
| 940 3rd St S Naples, FL | 1.0–2.0 | 1.0–2.0 | 870 | $3,995 | $4.59 | 23d | 2 | 1.47mi |
| 12 Knights Bridge Rd Unit A32 Naples, FL | 2.0 | 2.0 | 1095 | $3,200 | $2.92 | 21d | 1 | 1.50mi |
Listing history 7 events
-
2026-06-14status $599,000 Pending 146 DOM
-
2026-05-06status Pending With Contingencies
-
2026-03-20price $599,000
-
2026-02-11price $639,000
-
2025-12-12$649,000 Active
-
1999-09-03soldstatus $62,000
-
1999-09-03soldstatus $62,000
ⓘ Source: listings_history table (triggers on properties + properties_extension) + one-shot
backfill from property_details.listing_events for pre-trigger history.
Climate risk First Street
- Flood 9/10 Extreme FEMA zone AE · 99% chance over 30 yrs
- Wildfire 1/10 Low
- Heat 10/10 Extreme 7 d/yr ≥107°F today · 27 d/yr by 30 yrs out
- Wind 10/10 Extreme 99% chance of damaging wind over 30 yrs
- Air quality 2/10 Low 2 unhealthy d/yr today · 2 by 30 yrs out
Nearby sold comps map
Loading sold comps map…
Walkable amenities ~0.75 mi
Loading nearby amenities…
Taxation est. · year 1
- Rental income
- $79,382
- − Mortgage interest
- −$33,553
- − Property taxes
- −$8,985
- − Insurance
- −$8,114
- − Repairs & maintenance
- −$6,351
- − Management
- −$6,351
- − Depreciation
- −$17,425
- Taxable loss
- −$1,397
- Est. tax savings @ 24.0%
- +$335
- After-tax cash flow
- $8,253/yr
For passive investors: Depreciation is non-cash, so a rental often shows a tax loss while cash-flowing — sheltering income. Rental losses are passive: they offset passive income freely, and up to $25,000/yr can offset ordinary (W-2) income if you actively participate and your MAGI is under $100k (phasing out to $0 by $150k); unused losses carry forward. On sale, claimed depreciation is recaptured at up to 25%, and gains may owe capital-gains tax (a 1031 exchange can defer both). Figures are a year-1 estimate at your 24.0% rate — not tax advice; consult a CPA.
Schools (NCES district)
- District
- Collier
- NCES district ID
- 1200330
- Math proficiency
- 60% ▼ -4.00%
- Reading proficiency
- 56% ▼ -2.00%
- Median HH income
- $58,275
- Composite
- 50.23/100
- National rank
- #1892
- State rank
- #16 of 73 in FL
Livability — Naples
- Score
- 80/100
- State rank
- #126
- US rank
- #1903
Category grades
Schools grade is shown separately in the Schools card above.
Census & demographics
- Census place
- Naples, FL
- County
- Collier County · 396,295 people
- City population
- 344,941
- Metro
- Naples-Marco Island, FL
- Population (ZIP)
- 11,179
- Household income
- $130,929
- Rent vs Own
- Severe rent burden
- 333.0
Population outlook (Collier County) Hauer SSP2
- Today (2025)
- 420,858 people
- By 2030
- 450,054 · +6.9%
- By 2040
- 502,232 · +19.3%
- By 2050
- 544,932 · +29.5%
- By 2075
- 627,203 · +49.0%
- By 2100
- 659,015 · +56.6%
Race, ethnicity, and origin ACS 2023
- Neighborhood character
- Predominantly White (79%)
- Race & ethnicity
- White 79% Hispanic / Latino 9% Two or more races 8% Black 8% Asian 1%
- Hispanic origin (detail)
- Cuban 6%
- Common ancestry
- Hispanic 4% Lithuanian 4% Romanian 4%
- Foreign-born
- 17% · Canada, China
- Languages at home
- 87% English-only · Spanish 7% French/Haitian/Cajun 4% German/W. Germanic 1%
Political lean MEDSL · Collier
- 2024 margin
- Solid R (+33.1) · D 33.1% · R 66.2%
- 2008→2024 swing
- -10.6pp toward R · 2008: -22.5pp · 2024: -33.1pp
- All cycles
- 2024: R+33.1 2020: R+24.7 2016: R+26.0 2012: R+30.1 2008: R+22.5
Not yet ingested
- Civics
- —
Market trends
- HPI YoY
- ▲ 4.08%
- Current HPI
- 328.2755
- Rent YoY
- ▲ 8.75%
- Metro
- Naples-Marco Island, FL
- State GDP YoY
- ▲ 3.28%
- F500 in state
- 36
Industry mix (Fortune 500 HQ in FL)
| Industry | F500 HQs | Revenue |
|---|---|---|
| Industrial Technology | 2 | $29B |
|
||
| Insurance | 2 | $17B |
|
||
| Retail | 1 | $60B |
|
||
| Technology Distribution | 1 | $58B |
|
||
| Homebuilding | 1 | $35B |
|
||
| Technology Manufacturing | 1 | $35B |
|
||
Price history
+866.1% since first listed6 events — show timeline
- 2026-05-06 Pending — NAPLESMLS
- 2026-03-20 Price Changed $599,000 NAPLESMLS
- 2026-02-11 Price Changed $639,000 NAPLESMLS
- 2025-12-12 Listed $649,000 NAPLESMLS
- 1999-09-03 Sold (Public Records) $62,000 Public Records
- 1999-09-03 Sold (Public Records) $62,000 Public Records
Property tax history
-0.6%/yrLatest (2025): $293 · +1.9% YoY. Source: county tax records.
Cash-flow waterfall
monthlySold comps — $/sqft
last 12 mo · ≤1 miLoading sold comps…